

In the world of trading, the search for the most accurate trend indicator is a constant pursuit. The direct answer is that no single indicator is universally “the best.” The ideal tool truly depends on the market you’re trading, your personal strategy, and the timeframe you’re observing. Many experienced traders, however, consider Moving Averages foundational for their clarity and reliability. This guide, from the perspective of a seasoned trader, will delve into the top contenders for the most accurate trend indicator, helping you discover which ones, perhaps with a regulated forex broker, work best for you.
Key Takeaways:
- No Single “Best” Indicator: The most accurate trend indicator is subjective and depends on your trading style, market, and strategy.
- Moving Averages are Foundational: Simple (SMA) and Exponential (EMA) Moving Averages are the bedrock of trend analysis for many traders.
- Combination is Key: Using multiple indicators for confirmation (a concept known as confluence) significantly improves signal accuracy and reduces false positives.
- Strength vs. Direction: Some indicators like the ADX measure a trend’s strength, not its direction, providing a crucial layer of analysis.
- Backtesting is Non-Negotiable: Always test your indicator-based strategies on historical data before risking real capital.
Understanding Trend Indicators
Before diving into specific tools, it’s essential to grasp what we’re trying to measure. Trend indicators are technical analysis tools designed to help traders identify the direction and strength of market momentum. In any market, prices don’t move in straight lines; they move in waves, creating overarching patterns. By analyzing historical price data, these indicators smooth out the volatility and “noise,” giving you a clearer picture of the underlying trend. This clarity is crucial for making informed decisions, whether you’re looking to enter a new position, hold an existing one, or take profits.
What is a Trend?
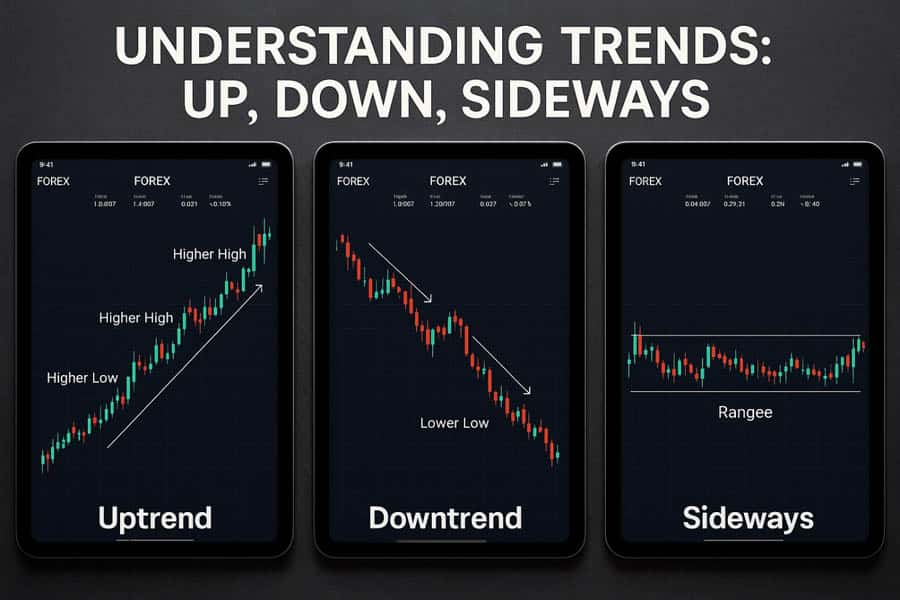
A trend is the general direction in which a market is moving over a specific period. There are three types of market trends that every trader must be able to identify:
- Uptrend: Characterized by a series of higher highs and higher lows. This indicates that bullish (buying) pressure is in control.
- Downtrend: Characterized by a series of lower highs and lower lows. This signifies that bearish (selling) pressure is dominating the market.
- Sideways Trend (or Range): Occurs when price moves back and forth between a relatively stable high and low point. There is no clear direction, and buying and selling pressures are in equilibrium.
Why Use Trend Indicators?
The primary purpose of using a trend indicator is to remove emotion and subjectivity from your trading analysis. They provide objective, data-driven signals about the market’s behavior. Effectively using a trend indicator can help you stay on the right side of the market, avoid trading against a strong current, and better time your entries and exits. For anyone serious about trading, mastering a few of these tools is not just an advantage; it’s a necessity. Finding the most accurate trend indicator for your system can fundamentally change your results.
Top 5 Most Accurate Trend Indicators
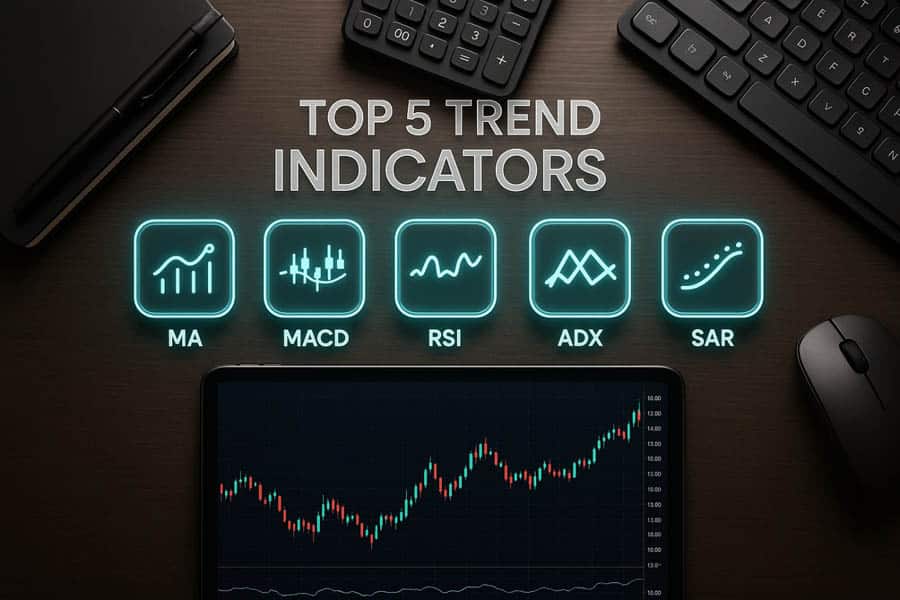
Here we explore the top five indicators that have consistently proven their worth in a trader’s toolkit. Each one offers a unique perspective on the market’s trend. While some might argue for one over the other, I’ve found that the real magic happens when you understand how each one works and when to apply it. The quest for the most accurate trend indicator often ends with mastering one or two of these fundamental tools.
Read More: Moving Average Indicator in Forex
1. Moving Averages: Foundation of Trend Trading
If there’s one tool that could be called the cornerstone of trend analysis, it’s the Moving Average (MA). It’s a simple concept: an MA calculates the average price of an asset over a specified number of periods, plotting it as a line on your chart. Its primary function is to smooth out price action to more clearly identify the trend’s direction. The two most common types are the Simple Moving Average (SMA), which gives equal weight to all prices, and the Exponential Moving Average (EMA), which gives more weight to recent prices, making it more responsive.
How to Use Moving Averages
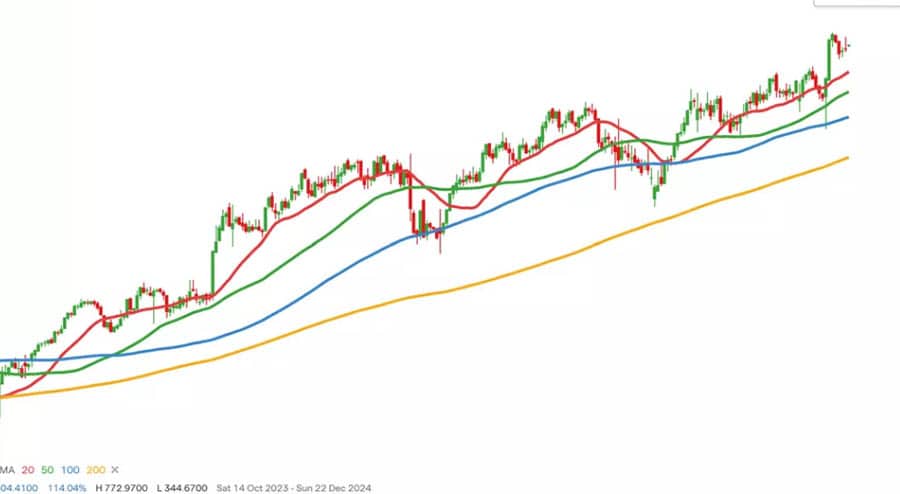
The classic way to use MAs is through crossovers. A “Golden Cross” occurs when a shorter-term MA (like the 50-period) crosses above a longer-term MA (like the 200-period), signaling a potential uptrend. Conversely, a “Death Cross” happens when the 50-period MA crosses below the 200-period MA, signaling a potential downtrend. Additionally, the price’s relationship to a single MA is telling; if the price is consistently above the MA, it’s considered an uptrend, and if it’s below, it’s a downtrend. The MA itself can also act as a dynamic level of support or resistance.
Optimum Settings for Moving Averages
The “best” settings are highly dependent on your trading style. Short-term or day traders often use faster EMAs like the 9, 12, or 26-period. Swing traders who hold positions for days or weeks tend to favor the 50-period MA. Long-term investors and position traders rely on the 100-period and, most famously, the 200-period SMA to gauge the long-term health of a market. From my experience, a combination of the 21-period EMA for short-term direction and the 50-period EMA for the medium-term trend provides a robust framework on daily charts.
Pros and Cons
- Pros: Simple to understand, excellent for identifying the primary trend, and effective at providing dynamic support and resistance levels.
- Cons: They are lagging indicators, meaning they react to past events and can be late to signal trend changes. They can also produce false signals in choppy, sideways markets.
2. MACD: A Momentum-Based Trend Indicator
The Moving Average Convergence Divergence (MACD) is a personal favorite because it does more than just show trend direction; it also measures momentum. This makes it an incredibly versatile tool and a strong candidate for the most accurate trend indicator. It’s composed of two lines—the MACD line and the signal line—and a histogram that shows the distance between these two lines. The MACD line is typically calculated by subtracting the 26-period EMA from the 12-period EMA.
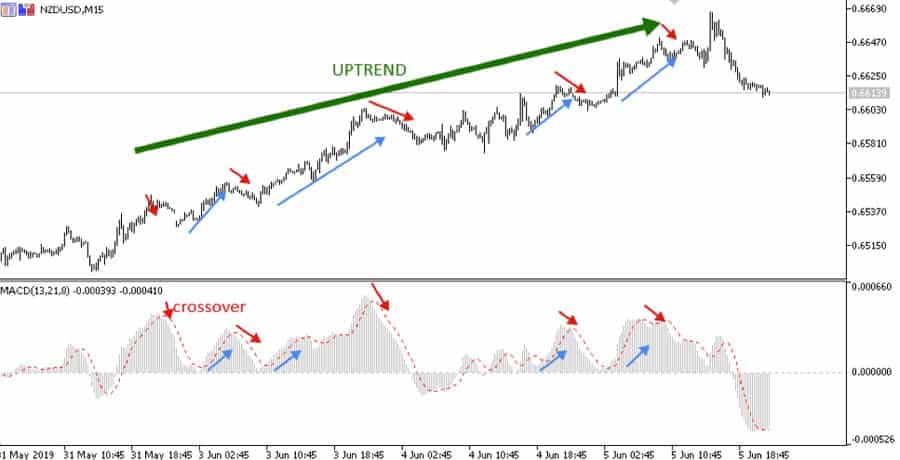
How to Use the MACD
There are three primary ways to generate signals with the MACD. The first is the crossover: when the MACD line crosses above the signal line, it’s a bullish signal. When it crosses below, it’s bearish. The second is the zero-line crossover. When the MACD line crosses above the zero line, it indicates that momentum is shifting to the upside. The third, and perhaps most powerful, signal is divergence. If the price is making a new high but the MACD is failing to make a new high, it’s a bearish divergence, signaling that the uptrend may be weakening and a reversal could be near.
Optimum Settings for the MACD
The standard setting for the MACD is (12, 26, 9). This means the MACD line is the difference between the 12- and 26-period EMAs, and the signal line is a 9-period EMA of the MACD line. These settings are time-tested and work well on most timeframes. Some short-term traders might use faster settings, like (5, 35, 5), to get earlier signals, but this comes at the cost of increased noise and more false signals. For most traders, sticking with the default (12, 26, 9) is the most reliable approach.
Pros and Cons
- Pros: Provides trend direction and momentum in one indicator. Divergence signals can be excellent predictors of trend reversals.
- Cons: Like MAs, it’s a lagging indicator. Its signals can be less reliable in ranging markets, leading to whipsaws.
3. RSI: Measuring Market Momentum
The Relative Strength Index (RSI) is a momentum oscillator that measures the speed and change of price movements. The RSI oscillates between zero and 100. While not a trend indicator in the traditional sense, it’s invaluable for confirming a trend’s strength and identifying potential reversal points, which is why it’s on this list. It helps answer the question, “Is the trend running out of steam?” For many, pairing the RSI with a trend-following tool creates a system that feels like the most accurate trend indicator setup.
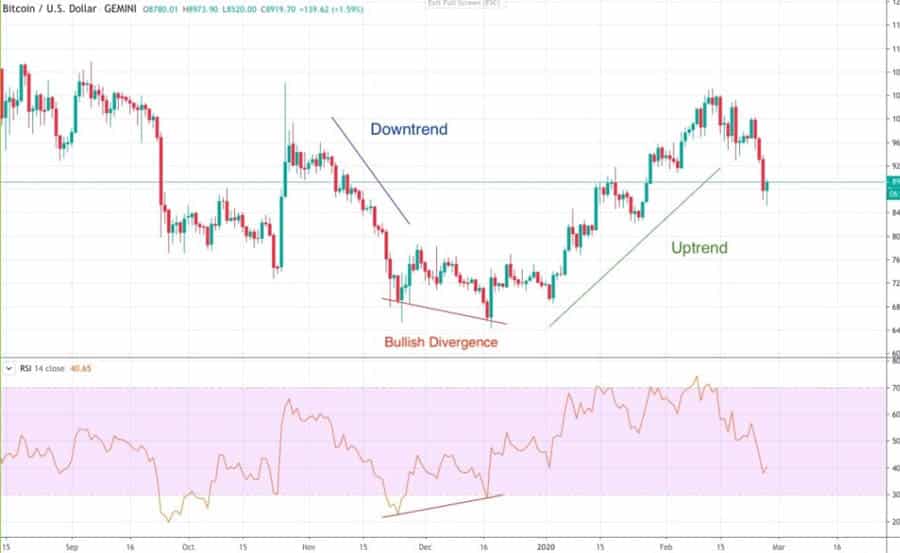
How to Use the RSI
The RSI is primarily used to identify overbought and oversold conditions. A reading above 70 is generally considered overbought, suggesting that the asset may be due for a pullback. A reading below 30 is considered oversold, suggesting a potential bounce. However, in a strong trend, the RSI can remain in overbought or oversold territory for extended periods. Therefore, a more advanced use is looking for divergence. If the price makes a new high but the RSI makes a lower high (bearish divergence), the trend’s momentum is fading. This is a powerful warning sign.
Optimum Settings for the RSI
The standard setting for the RSI is 14 periods. This is the setting used by its creator, J. Welles Wilder, and it has stood the test of time for swing trading on daily charts. Day traders might shorten this to a 7 or 9-period RSI to make it more sensitive to short-term price action. Conversely, long-term investors might use a 21 or 30-period RSI to focus on more significant momentum shifts. For the overbought/oversold levels, while 70/30 are standard, in strong uptrends, the 40-50 level often acts as support, and in strong downtrends, the 50-60 level can act as resistance.
Pros and Cons
- Pros: Excellent for gauging momentum and identifying potential trend exhaustion through overbought/oversold levels and divergence.
- Cons: Can give premature and false signals, especially in strongly trending markets where it can stay “overbought” or “oversold” for long periods.
4. ADX: Gauging Trend Strength
The Average Directional Index (ADX) is unique because it doesn’t tell you the direction of the trend, only its strength. This is a critical piece of information that many other indicators miss. The ADX is plotted as a single line with values ranging from 0 to 100. It’s an essential tool for filtering out trades during weak or non-trending periods, helping you focus only on strong moves. When traders ask for the most accurate trend indicator, they often mean a tool that prevents them from trading in choppy conditions, and the ADX excels at this.
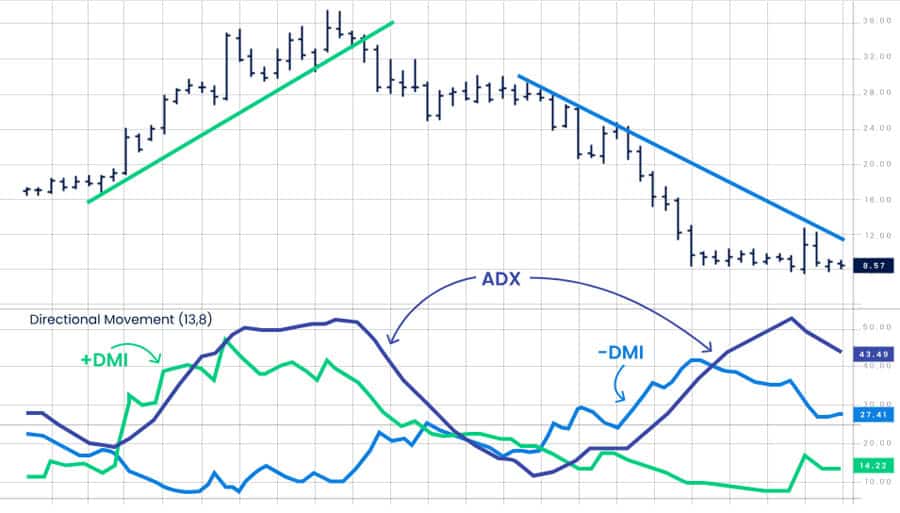
How to Use the ADX
Interpreting the ADX is straightforward. A reading below 25 suggests a weak trend or a ranging market; it’s generally wise to avoid trend-following strategies in this environment. When the ADX line rises above 25, it indicates that a trend is strengthening, either up or down. A reading above 40 or 50 signifies a very strong trend. To determine the trend’s direction, the ADX is usually paired with two other lines: the +DI (Positive Directional Indicator) and the -DI (Negative Directional Indicator). When the +DI is above the -DI, the trend is up. When the -DI is above the +DI, the trend is down. A strong signal occurs when the ADX is above 25 and the +DI and -DI lines cross.
Optimum Settings for the ADX
The standard setting for the ADX is 14 periods. This setting provides a good balance for most trading styles and timeframes. Using a shorter period (like 7) will make the ADX react more quickly but will also result in more choppiness. A longer period (like 21 or 30) will smooth out the ADX line, focusing only on more significant, long-term trends. For most applications, sticking with the 14-period setting is the most prudent choice.
Pros and Cons
- Pros: Unmatched at quantifying trend strength. Helps traders avoid weak trends and focus on high-probability setups.
- Cons: It is a lagging indicator. It does not provide the direction of the trend on its own, requiring the use of the +DI and -DI lines or another indicator for directional bias.
Read More: Mastering the ADX Indicator in Forex
5. Parabolic SAR: Identifying Trend Reversals
The Parabolic Stop and Reverse (SAR) indicator is designed to identify potential trend reversals, hence the “stop and reverse” in its name. It appears on a chart as a series of dots either above or below the price bars. Its primary use is to provide exit signals, allowing traders to trail their stops and lock in profits as a trend matures. It is a very visual indicator that clearly defines the current trend bias. While some traders find it too aggressive, its ability to pinpoint exit points makes it a contender for the most accurate trend indicator for trade management.
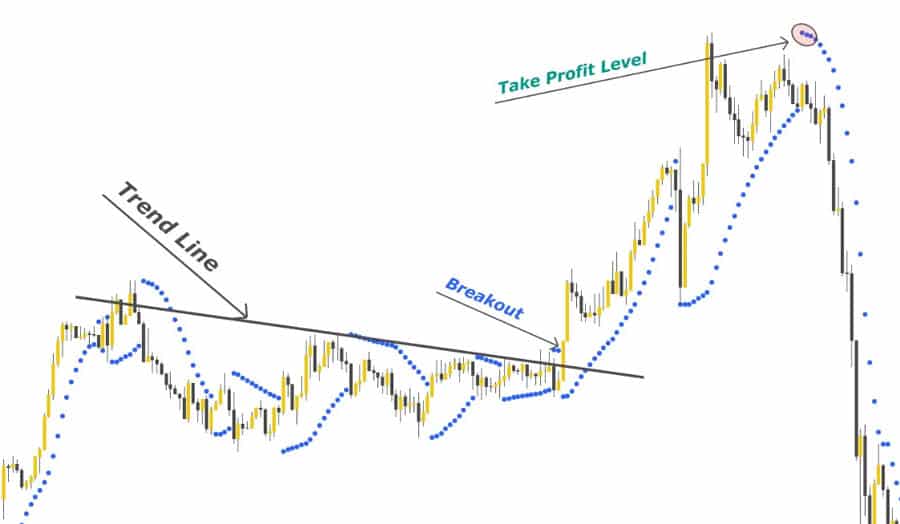
How to Use the Parabolic SAR
The usage is intuitive. When the dots are below the price candles, it signals an uptrend. When the dots are above the price candles, it signals a downtrend. A reversal signal occurs when the dots flip from one side of the price to the other. For example, if the dots are below the price (uptrend) and then flip to appear above the price, it signals that the uptrend may be over and a downtrend is beginning. Traders often use this flip as a signal to exit their long position and potentially enter a short position.
Optimum Settings for the Parabolic SAR
The Parabolic SAR has two parameters: the step and the maximum step. The standard settings are (0.02, 0.2). The ‘step’ is the acceleration factor. A higher step will make the indicator more sensitive and hug the price more closely, leading to more signals and reversals. A lower step will make it less sensitive and better suited for riding longer trends. Increasing the step makes it a better tool for short-term trading, while decreasing it tailors it for long-term trends. Most charting platforms default to (0.02, 0.2), which is a well-balanced starting point.
Pros and Cons
- Pros: Excellent for setting trailing stops and identifying exit points. Provides clear, visual signals that are easy to interpret.
- Cons: Not effective in ranging or choppy markets, where it will generate constant reversal signals resulting in many small losses (whipsaws).
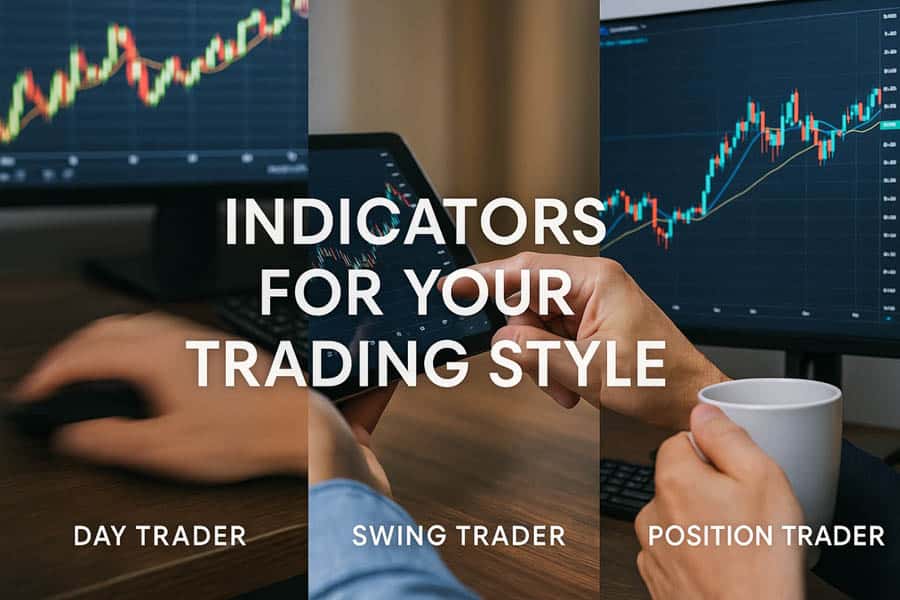
Best Indicators for Different Trading Styles
The concept of the most accurate trend indicator is not one-size-fits-all. The right tool is inextricably linked to your trading style and the market you operate in. A day trader needs an indicator that reacts quickly, while a swing trader needs one that filters out short-term noise. Here, we’ll tailor our recommendations for specific trading disciplines.
Best Trend Indicators for Forex Trading
The forex market is unique due to its 24-hour nature and high liquidity. This environment calls for indicators that can capture sustained moves while filtering out the noise from different trading sessions. Many traders consider a combination of the MACD and the RSI to be the best forex trend indicator setup. The MACD can be used on a higher timeframe (like the 4-hour chart) to establish the primary trend direction. Then, the RSI on a lower timeframe (like the 1-hour chart) can be used to time entries by looking for pullbacks to oversold levels in an uptrend or overbought levels in a downtrend. This multi-timeframe approach provides both a strategic and tactical view, making it a powerful combination for finding the best forex trend indicator system.
Best Trend Indicators for Day Trading
Day traders operate on very short timeframes and need indicators that are highly responsive to intraday price and volume changes. For this reason, classic lagging indicators can sometimes be too slow. Two excellent tools for day traders are the Volume Weighted Average Price (VWAP) and On-Balance Volume (OBV). VWAP shows the average price of a security adjusted for its volume, acting as a benchmark for the session. Traders often look to buy when the price is below VWAP and sell when it’s above. OBV is a momentum indicator that uses volume flow to predict price changes. A rising OBV confirms an uptrend, while a falling OBV confirms a downtrend. Divergence between price and OBV can be a powerful signal of an impending reversal.
Best Trend Indicators for Swing Trading
Swing traders aim to capture “swings” in the market over several days or weeks. Their goal is to identify a medium-term trend and ride it. For this style, the combination of Moving Averages and Bollinger Bands is exceptionally effective. Swing traders can use a 50-period moving average to define the overall trend. They would only look for buying opportunities when the price is above the 50 MA and selling opportunities when it is below. Bollinger Bands, which consist of a middle band (an MA) and two outer bands (standard deviations), can then be used to time entries. When the price pulls back to the lower Bollinger Band in an uptrend, it can present a great buying opportunity.
Read More: how to use bollinger bands in forex trading
How to Combine Trend Indicators
The secret to finding what feels like the most accurate trend indicator is to stop looking for a single magic bullet. Professional traders build robust systems by combining indicators that complement each other. This practice, known as confluence, involves looking for multiple, non-correlated indicators to give the same signal, thereby increasing the probability of a successful trade.
The Power of Confirmation
The core idea behind combining indicators is confirmation. If one indicator gives you a buy signal, that’s interesting. If a second, different type of indicator gives you a buy signal at the same time, that’s compelling. This layered approach helps to filter out false signals and improve confidence in your trading decisions. A classic and effective combination is using a trend-following indicator to set the context and a momentum oscillator to time the entry. For example, you can use the 200-period moving average to determine the long-term trend. If the price is above the 200 MA, you only look for buying opportunities. Then, you can use the RSI to wait for a pullback into oversold territory (e.g., below 30) to time your entry. This ensures you are trading with the primary trend but entering at a potentially favorable price. This disciplined approach is how a trader truly discovers their personal most accurate trend indicator.
Experience-Based Pro-Tips for Using Indicators
After years of looking at charts and testing countless strategies, I’ve learned a few hard truths about using technical indicators. These tools are powerful, but they are not a substitute for skill and discipline. Here are some pro-tips that go beyond the textbook definitions and can make a real difference in your trading performance. Thinking about these tips will help you develop your own philosophy on what the most accurate trend indicator is for you.
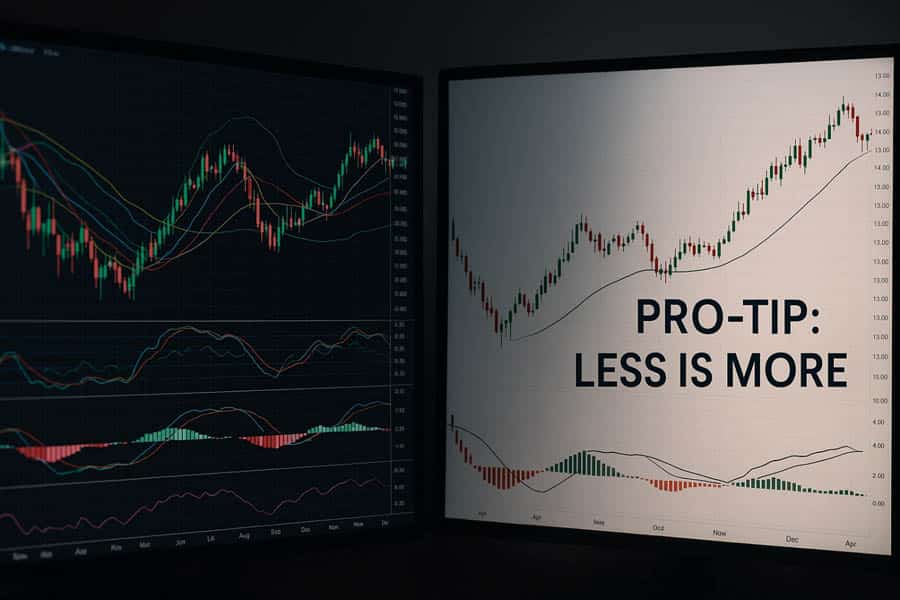
“Less is More”
One of the biggest mistakes new traders make is “analysis paralysis.” They clutter their charts with five, six, or even more indicators, hoping that more information will lead to better decisions. In reality, it leads to confusion and conflicting signals. Your chart becomes an unreadable mess. From my experience, a clean chart is a clear mind. Pick two or three indicators that complement each other—for example, one for trend, one for momentum, and perhaps one for volatility. Master them. Understand their nuances, their strengths, and their weaknesses. A deep understanding of a few tools is far more valuable than a superficial knowledge of many. This focus is a key step in finding your most accurate trend indicator.
Backtesting is Crucial
This is non-negotiable. Before you ever risk a single dollar on a strategy using an indicator or a combination of indicators, you must backtest it. This means going back in time and applying your strategy to historical price data to see how it would have performed. Most modern trading platforms have built-in features for this. Backtesting will reveal the potential profitability, win rate, and drawdown of your strategy. It builds confidence in your system and helps you understand its characteristics. A strategy might have a lower win rate but a high reward-to-risk ratio, making it very profitable. You would never know this without thorough testing. This process is the only way to prove to yourself that you have found the most accurate trend indicator setup for your needs.
Understand Market Context
Technical indicators are tools, not crystal balls. They analyze price action, but they are blind to the fundamental reasons driving that price action. A perfect technical setup can be instantly invalidated by a major news event, an economic data release, or a central bank announcement. Always be aware of the broader market context. What is the current market sentiment? Are there major news events on the horizon? Using indicators in a vacuum is a recipe for disaster. A truly skilled trader combines technical analysis with an understanding of the overall market environment. This holistic view is what elevates an indicator from a simple line on a chart to a powerful component of a winning trading plan, and helps define what the most accurate trend indicator is in a given situation.
Opofinance Services
For traders seeking a reliable platform to apply these strategies, ASIC-regulated Opofinance offers a comprehensive suite of tools. With Opofinance, you get access to a robust trading environment designed for both new and experienced traders.
- Advanced Trading Platforms: Trade on industry-leading platforms like MT4, MT5, cTrader, and the proprietary OpoTrade.
- Innovative AI Tools: Leverage cutting-edge technology with an AI Market Analyzer, AI Coach, and AI Support to enhance your trading decisions.
- Secure & Flexible Transactions: Enjoy safe and convenient deposits and withdrawals, including crypto payments, with zero fees from Opofinance.
Explore a better trading experience by visiting opofinance.com today.
Conclusion
The journey to find the single most accurate trend indicator ultimately leads back to you, the trader. While tools like Moving Averages, MACD, and RSI are powerful and reliable, their true potential is unlocked when they are skillfully combined to fit your personal trading style and strategy. The most successful traders don’t have a secret indicator; they have a deep understanding of a few chosen tools and the discipline to execute their strategy flawlessly. The most accurate trend indicator is the one you have tested, mastered, and trust.
What is the most accurate indicator for beginners?
For beginners, the Simple Moving Average (SMA), particularly the 50-period and 200-period, is often the best starting point. It’s easy to understand, clearly defines the long-term trend, and provides a solid foundation for learning more complex technical analysis.
Can trend indicators predict the future?
No, indicators cannot predict the future with certainty. They are reactive tools that analyze past price data to provide probabilities about future price movements. They are tools for risk management and decision-making, not crystal balls.
What is a leading vs. a lagging indicator?
A lagging indicator (like a Moving Average) follows price action and confirms a trend after it has started. A leading indicator (like the RSI showing divergence) attempts to signal future movements before they happen. Leading indicators offer earlier signals but have a higher rate of false signals.
How do I set up these indicators?
Nearly all modern trading platforms (like MetaTrader 4/5 or TradingView) have these indicators built-in. You can typically find them in an “Indicators” or “Insert” menu, where you can add them to your chart and adjust their settings in a properties window.
Which time frame is best for trend indicators?
There is no single “best” time frame; it depends entirely on your trading style. Long-term investors use weekly or monthly charts, swing traders focus on daily and 4-hour charts, and day traders use hourly and minute charts. The key is to ensure your indicator settings are appropriate for your chosen time frame.


