

In forex trading, technical indicators are vital tools for analyzing price movements and guiding trading decisions. They are mathematical calculations using historical price data to identify trends, potential reversals, and optimal entry and exit points. However, over-reliance on a single indicator can lead to false signals. Market conditions change, affecting indicator effectiveness. Hence, traders working with a reliable forex broker must use indicators strategically, complementing them with other forms of analysis for informed decision-making.

Popular and Effective Forex Indicators
Moving Averages (MA)
Moving Averages (MAs) are among the most effective forex trading indicators, widely used by traders to smooth out price data and identify trends. MAs help traders discern the overall direction of the market by filtering out short-term fluctuations.

Simple Moving Average (SMA) calculates the average of a specified number of past prices. For example, a 20-day SMA sums the closing prices of the last 20 days and divides by 20. This indicator is straightforward and easy to use, making it popular among traders.
Exponential Moving Average (EMA) places more weight on recent prices, making it more responsive to new information. The formula for EMA includes a multiplier that increases the weight of the most recent prices, making it quicker to react to price changes than the SMA.
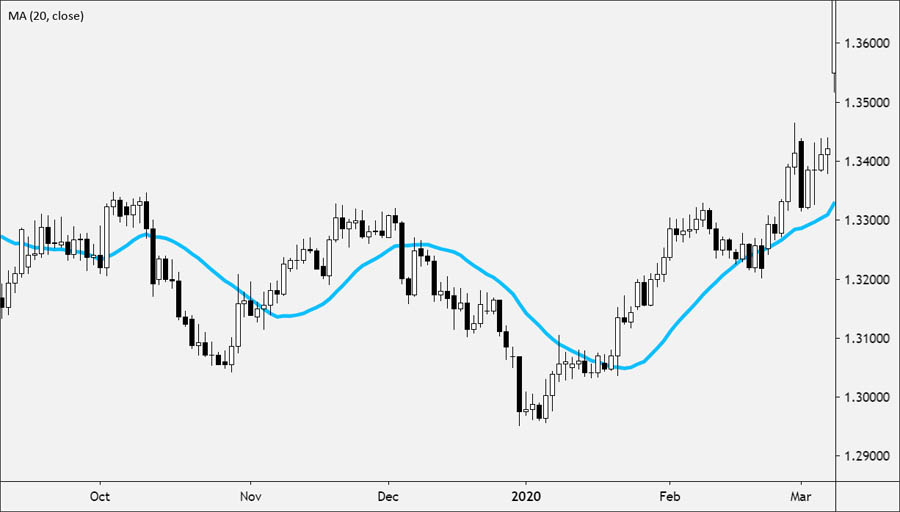
Using MAs in Forex Trading involves identifying trends and potential support and resistance levels. When the price crosses above the MA, it signals a potential uptrend, while crossing below indicates a potential downtrend. Traders often use multiple MAs, such as the 50-day and 200-day, to identify crossovers that signal trend reversals. For instance, a “golden cross” occurs when a short-term MA crosses above a long-term MA, indicating a bullish trend, while a “death cross” occurs when a short-term MA crosses below a long-term MA, indicating a bearish trend.
Bollinger Bands
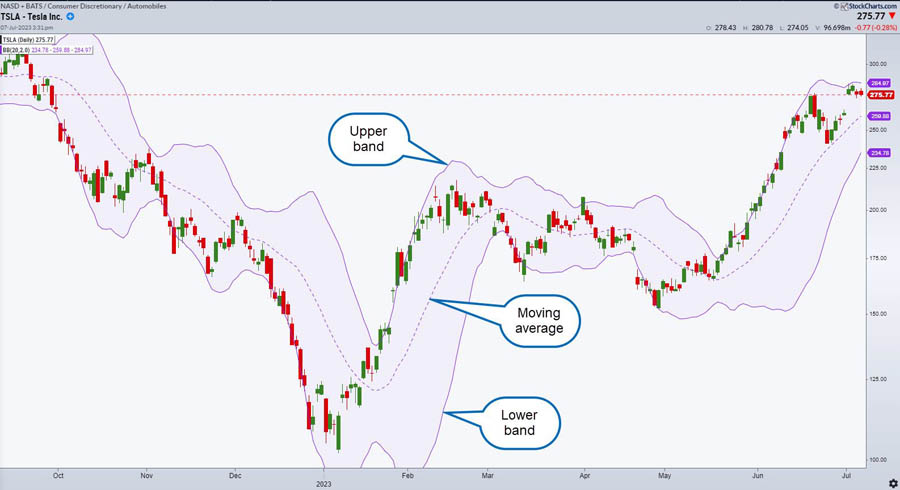
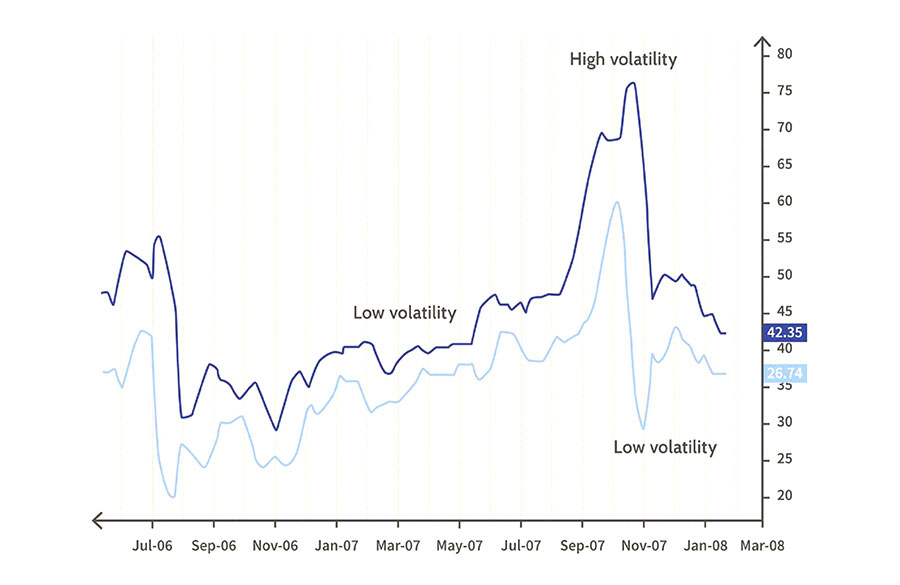
Bollinger Bands are essential forex trading indicators that measure market volatility. They consist of a central moving average (usually a 20-day SMA) and two bands plotted two standard deviations above and below this average.
Construction:
- Calculate a 20-day SMA.
- Plot two lines at a distance of two standard deviations from the SMA.
- Bands expand during high volatility and contract during low volatility.
Interpretation:
- Upper Band Touch: Price touching the upper band may indicate overbought conditions and a potential sell opportunity.
- Lower Band Touch: Price touching the lower band may indicate oversold conditions and a potential buy opportunity.
- Bollinger Squeeze: Bands coming close together suggest low volatility and potential breakouts.
- Band Widening: Increased volatility and potential trend continuation.
Read More: Best Forex Indicators for Day Trading
Relative Strength Index (RSI)
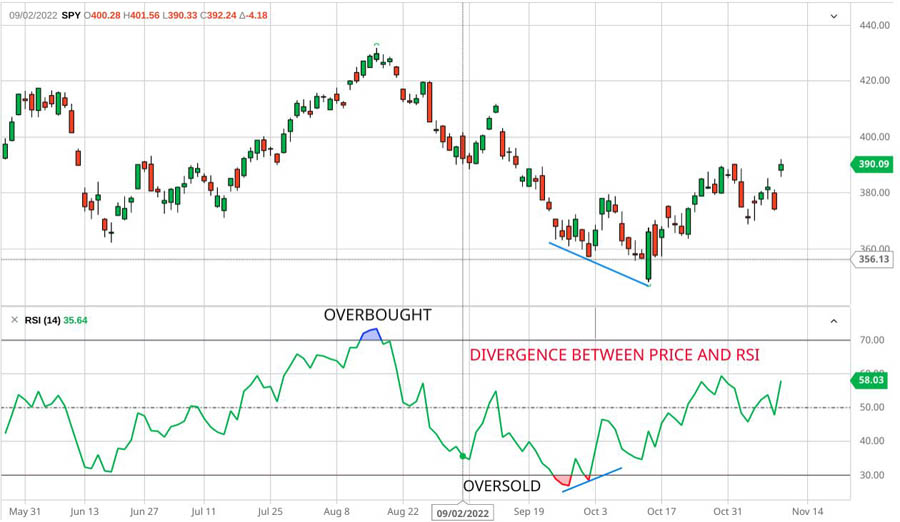
Relative Strength Index (RSI) is a powerful forex trading indicator for measuring the speed and change of price movements. RSI values range from 0 to 100:
- Above 70: Indicates overbought conditions.
- Below 30: Indicates oversold conditions.
Calculation:
- Average gains and losses over a specified period (commonly 14 days).
- Apply a formula to convert these values into an oscillator ranging between 0 and 100.
Using RSI in Forex Trading
Using RSI in Forex Trading helps traders identify potential reversal points:
- RSI Above 70: Suggests the market may be overbought and due for a correction.
- RSI Below 30: Indicates the market may be oversold and due for a bounce.
Caution:
- RSI can generate false signals during strong trends.
- Often used with other indicators like moving averages or support and resistance levels for confirmation.
Moving Average Convergence Divergence (MACD)
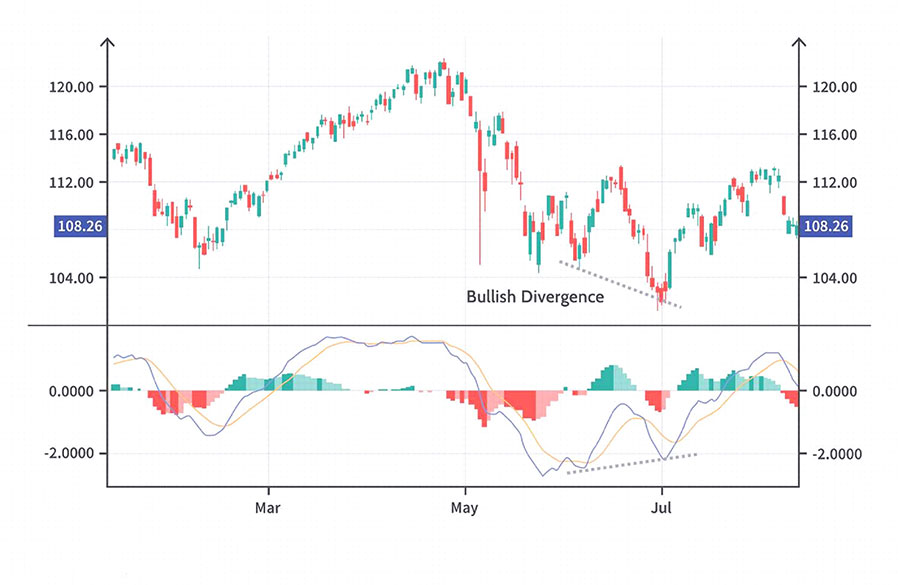
Moving Average Convergence Divergence (MACD) is a trend-following momentum indicator that shows the relationship between two moving averages of a security’s price. It consists of three main components:
Components of MACD:
- MACD Line: Difference between the 12-day and 26-day EMA.
- Signal Line: A 9-day EMA of the MACD line.
- Histogram: Difference between the MACD line and the signal line.
Using MACD in Forex Trading:
- Crossovers:
- Bullish Signal: MACD line crosses above the signal line, indicating potential upward momentum.
- Bearish Signal: MACD line crosses below the signal line, indicating potential downward momentum.
- Divergences:
- Bullish Divergence: Price makes lower lows while the MACD line makes higher lows.
- Bearish Divergence: Price makes higher highs while the MACD line makes lower highs.
- Rapid Rises/Falls: Indicate potential trend strength and possible reversals.
Read More: Forex Diversification Strategies
Fibonacci Retracements
Fibonacci Retracements are based on the principle that markets will retrace a predictable portion of a move before continuing in the original direction. The most common retracement levels are 23.6%, 38.2%, 50%, 61.8%, and 100%.
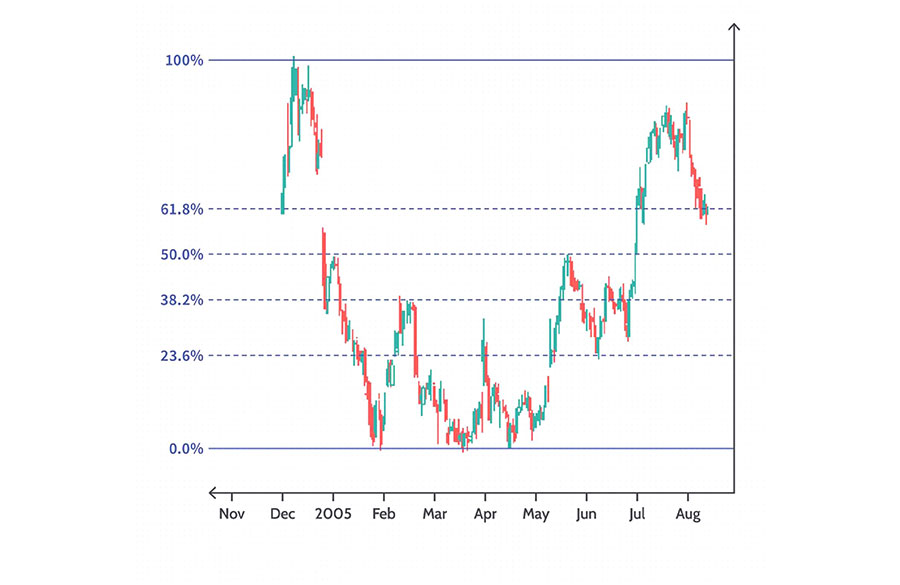
Using Fibonacci Retracements in Forex Trading:
- Plotting: Draw from the recent significant peak to the trough (or vice versa).
- Key Levels: Serve as potential support and resistance zones.
- Trading Strategy:
- Enter or exit trades at key retracement levels.
- Anticipate bounces or reversals at these levels.
- Example: If the price retraces to the 38.2% level and holds, the original trend may resume.
Combining with Other Indicators: Fibonacci retracements are particularly effective when used with other technical indicators like moving averages or trend lines.
Average True Range (ATR)
Average True Range (ATR) is a volatility indicator that measures the degree of price movement over a given period. Unlike other volatility indicators, ATR only measures volatility, not price direction.
Calculation of ATR:
- Take the greatest of the following:
- Current high minus current low.
- Absolute value of current high minus previous close.
- Absolute value of current low minus previous close.
- Average the resulting values over a specified period.
Using ATR in Forex Trading:
- Stop-Loss Orders:
- Higher ATR value indicates more volatility, suggesting wider stop-loss levels.
- Lower ATR value suggests tighter stop-loss levels.
Stochastic Oscillator
Stochastic Oscillator is a momentum indicator that compares a closing price to a range of its prices over a certain period. It ranges from 0 to 100:
- Above 80: Indicates overbought conditions.
- Below 20: Indicates oversold conditions.
Using the Stochastic Oscillator in Forex Trading:
- Buy and Sell Signals:
- Above 80: Suggests the currency pair is overbought and may correct.
- Below 20: Indicates the pair is oversold and may bounce.
- Divergence:
- Look for divergence between the Stochastic Oscillator and price for potential reversals.
- Example: If the price makes higher highs but the Stochastic Oscillator makes lower highs, it indicates weakening momentum and a possible reversal.
Ichimoku Cloud
Ichimoku Cloud, also known as Ichimoku Kinko Hyo, is a comprehensive indicator that provides information on support and resistance levels, trend direction, and momentum. It consists of five main components:
Components:
- Tenkan-sen (Conversion Line): Average of the highest high and lowest low over the last 9 periods.
- Kijun-sen (Base Line): Average of the highest high and lowest low over the last 26 periods.
- Senkou Span A (Leading Span A): Average of Tenkan-sen and Kijun-sen, plotted 26 periods ahead.
- Senkou Span B (Leading Span B): Average of the highest high and lowest low over the last 52 periods, plotted 26 periods ahead.
- Chikou Span (Lagging Span): Closing price plotted 26 periods behind.
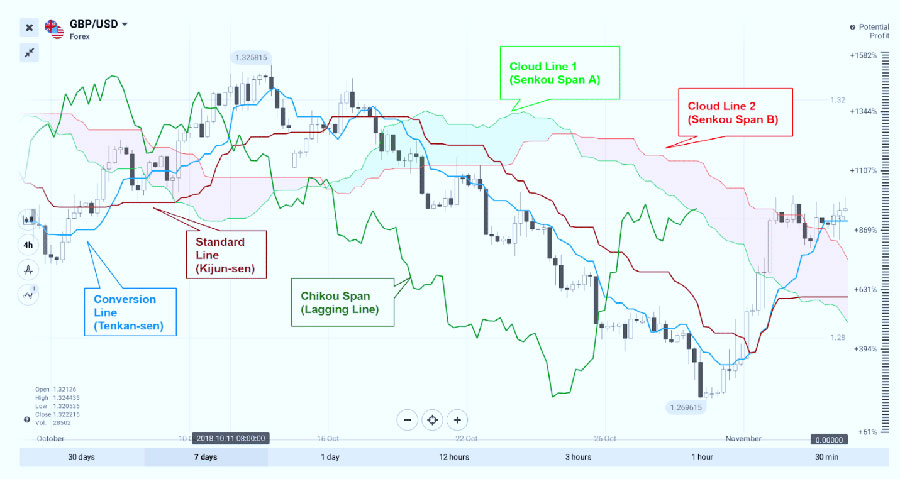
Using Ichimoku Cloud in Forex Trading:
- Cloud (Kumo): Space between Senkou Span A and Senkou Span B.
- Above Cloud: Suggests an uptrend.
- Below Cloud: Indicates a downtrend.
- Cloud Thickness: Represents the strength of support or resistance.
- Crosses:
- Tenkan-sen and Kijun-sen Crosses: Provide buy and sell signals.
Parabolic SAR
The Parabolic SAR (Stop and Reverse) is a trend-following indicator that helps traders determine potential reversal points. It plots dots above or below the price, indicating the direction of the trend.
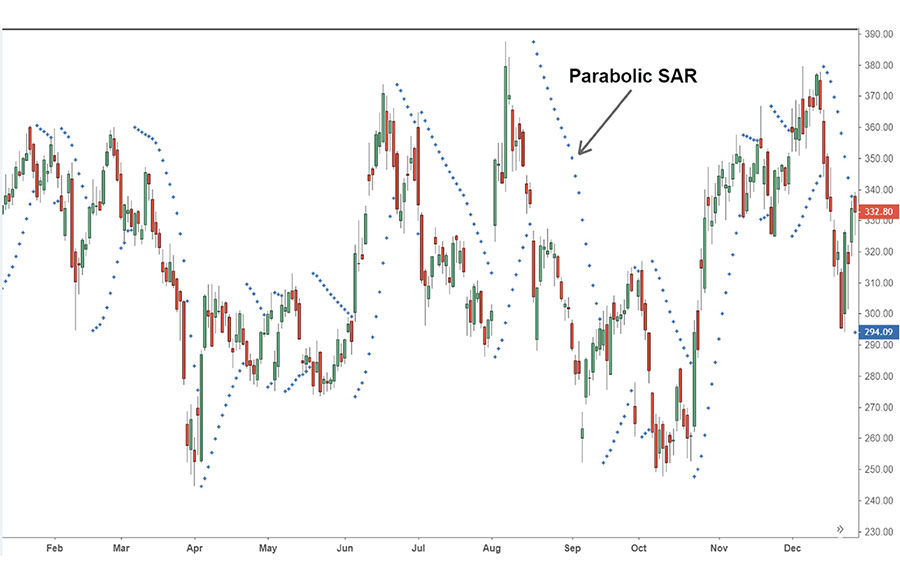
Using Parabolic SAR in Forex Trading:
- Trailing Stop-Loss Orders:
- Set trailing stop-loss orders that move with the price.
- Protect against sudden reversals.
- Example: In a long position, place a trailing stop-loss order at the level of the dots to lock in profits.
Choosing the Right Indicators for Forex Trading
Selecting the right forex trading indicators is crucial for developing a successful trading strategy. The effectiveness of an indicator depends on the trader’s style, time horizon, and risk tolerance. Here are essential factors to consider:
Trading Style:
- Day Trading:
- Indicators: Short-term Moving Averages (EMAs), RSI, Stochastic Oscillator, MACD.
- Purpose: Identify intraday trends, overbought/oversold conditions, and entry/exit points.
- Swing Trading:
- Indicators: Medium-term Moving Averages (SMAs, EMAs), Bollinger Bands, MACD, Fibonacci Retracements.
- Purpose: Highlight trends, measure volatility, identify support/resistance levels for medium-term trades.
- Long-term Investing:
- Indicators: Long-term Moving Averages (50-day, 200-day SMA), MACD, RSI, Ichimoku Cloud.
- Purpose: Confirm trends, optimize entry/exit points based on fundamental analysis and technical indicators.
Considerations:
- Time Horizon: Choose indicators that align with the duration of your trades (short-term, medium-term, long-term).
- Risk Tolerance: Select indicators that help manage risk and optimize trade management (stop-loss placement, profit-taking).
- Market Conditions: Adapt indicator selection based on current market volatility and trends.
Time Horizon
The time horizon for trading significantly influences the choice of indicators:
Short-term: Traders with a short-term focus (scalping or day trading) require indicators that provide rapid and frequent signals. Short-term EMAs, Stochastic Oscillator, and ATR for volatility are suitable for this purpose.
Medium-term: Swing traders and those with a medium-term horizon benefit from a combination of trend-following indicators (like SMAs and MACD) and momentum indicators (like RSI and Bollinger Bands). These indicators help capture price swings and potential reversals.
Long-term: Long-term traders and investors look for indicators that highlight broader market trends. Long-term SMAs, the Ichimoku Cloud, and MACD are useful for identifying and confirming these trends over extended periods.
Risk Tolerance
Risk tolerance varies among traders, influencing the choice of indicators:
High Risk Tolerance: Traders with a higher risk tolerance may prefer indicators that offer more aggressive signals and frequent trading opportunities. They might use short-term MAs, Stochastic Oscillator, and ATR for quick entries and exits.
Low Risk Tolerance: Traders with a lower risk tolerance prefer indicators that provide more conservative signals. They might rely on longer-term MAs, MACD for trend confirmation, and RSI to avoid entering overbought or oversold conditions.
Read More: High Reward Low Risk Forex Trading Strategies
Combining Indicators and Price Action
Effective forex trading often involves combining technical indicators with price action analysis to enhance decision-making and improve trading accuracy. While indicators provide objective signals based on mathematical calculations, price action analysis offers insights into market sentiment and the behavior of market participants. Here’s how traders can integrate indicators with price action for a comprehensive trading approach:
Importance of Price Action
Understanding Price Action: Price action refers to the movement of a security’s price over time, reflecting the collective decisions of buyers and sellers. Analyzing price action involves studying patterns, candlestick formations, support and resistance levels, and market structure without relying solely on indicators.
Advantages of Price Action: Price action analysis offers several advantages:
- Clearer Market Sentiment: Candlestick patterns and price movements provide direct insights into market sentiment and trader psychology.
- Accurate Support and Resistance Levels: Identifying key support and resistance levels helps traders make informed decisions about entry and exit points.
- Confirmation of Indicators: Price action can confirm or contradict signals generated by technical indicators, reducing the risk of false signals.
Combining Indicators with Price Action
Confirmation of Signals: One of the primary benefits of combining indicators with price action is signal confirmation. Here are some effective combinations:
1. Moving Averages and Price Action:
- Trend Confirmation: When the price is above a rising moving average (e.g., 50-day SMA), it confirms an uptrend. Traders look for pullbacks to the moving average as potential buying opportunities in the direction of the trend.
- Support and Resistance: Moving averages act as dynamic support or resistance levels. A bounce off a moving average combined with bullish price action (e.g., bullish engulfing pattern) strengthens the buy signal.
2. Bollinger Bands and Price Action:
- Volatility Confirmation: Bollinger Bands expand and contract based on market volatility. When the price touches the lower band and forms a bullish reversal candlestick pattern, it confirms a potential buy signal.
- Breakout Confirmation: A breakout above the upper band with strong bullish price action validates a potential continuation of the uptrend.
3. RSI and Price Action:
- Divergence Confirmation: RSI divergence with price action can signal potential reversals. For example, if the price makes a higher high but RSI forms a lower high (bearish divergence) and shows overbought conditions, it confirms a potential sell signal.
- Support and Resistance Confirmation: RSI readings at extreme levels (above 70 or below 30) combined with price action near key support or resistance levels provide stronger signals for potential reversals or continuations.
4. Fibonacci Retracements and Price Action:
- Retracement Levels: When price action confirms a bounce off a Fibonacci retracement level (e.g., 50% retracement) with bullish candlestick patterns (e.g., hammer), it validates a potential continuation of the trend.
- Confluence with Price Patterns: Combining Fibonacci levels with chart patterns (e.g., double bottoms or tops) enhances the accuracy of identifying potential reversal or breakout points.
Integration Strategies
· Waiting for Confluence: Traders wait for multiple indicators and price action signals to align before entering a trade. For example, they might look for a bullish MACD crossover, a bounce off the 50-day SMA, and a bullish engulfing candlestick pattern to confirm a buy signal.
· Using Price Action to Manage Risk: Price action analysis helps determine effective stop-loss and take-profit levels. Traders set stop-loss orders below identified key support levels from price action, reducing the risk of significant losses during adverse market conditions.
· Avoiding Over-Reliance on Indicators: While indicators offer valuable insights, traders should avoid relying solely on them. Combining indicators with price action mitigates the risk of false signals and enhances the reliability of trading decisions.
Practical Considerations
· Backtesting and Validation: Before implementing a strategy in live trading, traders should backtest it using historical data. This process evaluates how indicator combinations with price action perform across various market conditions.
· Continuous Learning and Adaptation: Markets evolve constantly. Successful traders stay updated with market developments, refine their trading techniques, and seek feedback from peers to sustain long-term trading success.
Conclusion
Technical indicators are powerful tools for forex traders, but their effectiveness depends on how well they are integrated into an overall trading strategy. Each trader must find the right combination of indicators that suit their trading style and market context. Continuous learning, practice, and adaptation are key to mastering forex trading and achieving consistent profitability.
Reference: +
Can technical indicators guarantee profits in forex trading?
No, technical indicators cannot guarantee profits. They are tools that help traders make informed decisions, but market conditions can change rapidly, and indicators can give false signals. Effective trading requires a combination of indicators, risk management, and a solid trading plan.
How many indicators should I use in my trading strategy?
The number of indicators you use depends on your trading style and preferences. However, using too many indicators can lead to analysis paralysis and conflicting signals. It’s generally recommended to use a few well-understood indicators that complement each other.
Are there any free tools available for backtesting indicators?
Yes, many trading platforms and software offer free tools for backtesting indicators. Examples include MetaTrader, TradingView, and NinjaTrader. These tools allow you to apply indicators to historical data and evaluate their performance before using them in live trading.


