

Feeling lost in the market’s noise? Many traders get tripped up by confusing signals and unexpected reversals when looking at just one chart. Relying on a single perspective often leads to entering trades too early or too late, missing the bigger picture and facing unnecessary losses. But what if you could get a clearer view and trade with more confidence? The multi timeframe moving average strategy offers a solution. By analyzing price action across different time horizons using moving averages, often facilitated by a reliable online forex broker, you can better identify strong trends and pinpoint smarter entries. In this guide, we’ll explore how to effectively implement this approach.

Understanding MTF Moving Average Analysis
Multi-timeframe analysis (MTFA) is a technique where traders look at the same asset across different time intervals – usually a long-term, medium-term, and short-term view. Why bother? Because a single chart only tells part of the story. A small dip on a 15-minute chart might just be a minor pause within a strong daily uptrend. Seeing these different perspectives provides crucial context. When you add moving averages (MAs) – those smooth lines that help show trend direction – into this mix, you get a powerful combination for navigating the markets.

Using moving averages across multiple timeframes gives you several key benefits. It helps confirm whether a trend seen on one chart is genuinely strong or just short-term noise. For instance, if the daily chart shows an uptrend with price above its MA, and the 4-hour chart confirms this, a buy signal on the 1-hour chart becomes much more reliable. This layered approach, central to a multi timeframe moving average strategy, helps filter out many false signals that can occur when you focus too narrowly on just one chart, leading to more accurate and confident trading decisions.
Selecting the Appropriate Timeframes
Choosing the right set of timeframes is key for using moving average multiple time frame analysis effectively. A popular guideline is the “Rule of 4” or “Rule of 6,” suggesting each timeframe should be about four to six times longer than the one below it (e.g., 15-minute, 1-hour, 4-hour). This helps ensure each chart offers a genuinely different perspective without too much overlap or too large a gap. The specific combination you choose, however, should really depend on your trading style.

Timeframe Combos for Trading Styles
Different trading approaches require focus on different time horizons:
- Day Traders: Focused on intraday moves, they might use a 1-hour chart for the main intraday trend, a 15-minute chart for identifying setups, and a 1-minute or 5-minute chart for precise entries.
- Swing Traders: Holding trades for days or weeks, they often use a Weekly chart for the big picture, a Daily chart for the primary trend and setup identification, and a 4-hour chart for refining entries and managing the trade.
- Position Traders: With a very long-term outlook (months to years), they might look at Monthly charts for overall direction, Weekly charts for major trends, and Daily charts for entry timing.
Matching Timeframes to Goals
Think about what you’re trying to achieve. If you want quick profits throughout the day, analyzing a weekly chart isn’t very helpful – stick to lower timeframes. If you aim to capture large, multi-week trends, the minute-by-minute noise on a 5-minute chart will likely just confuse you. Always align your timeframe selection with your trading personality and objectives. This ensures your multi timeframe moving average strategy is built on a relevant foundation.
Types of Moving Averages for MTF Analysis
Not all moving averages are created equal. They calculate the average price differently, affecting how quickly they react to market changes. Choosing the right type – Simple (SMA), Exponential (EMA), or Weighted (WMA) – can make a difference in your multi timeframe moving average strategy, especially when applied across various charts.
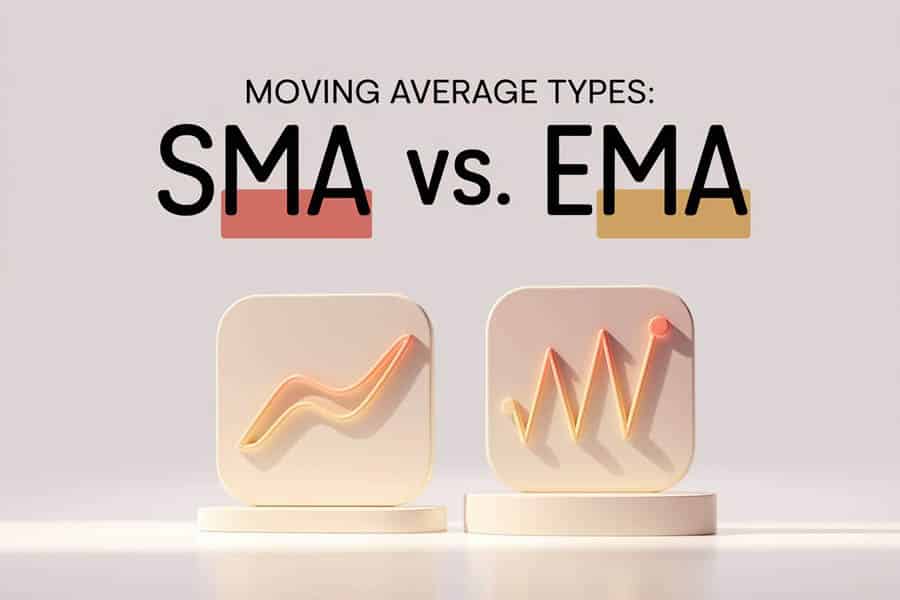
Simple Moving Average (SMA)
The SMA calculates the average price over a set period, giving every data point equal importance. Because it smooths price action significantly, it’s great for identifying long-term trends and key support or resistance zones, especially on higher timeframes like the Daily or Weekly charts. The 50-day, 100-day, and 200-day SMAs are very popular and widely watched levels.
Exponential Moving Average (EMA)
The EMA gives more weight to recent prices, making it react faster to changes than the SMA. This responsiveness is often preferred by traders looking for earlier signals, especially on lower timeframes used for entry timing. Common EMAs include the 9, 21, and 50-period. Using EMAs on your entry chart can help you catch moves quicker, provided they align with the broader trend shown on higher timeframe charts (which might use SMAs or EMAs).
Weighted Moving Average (WMA)
The WMA also emphasizes recent prices, even more so than the EMA (using a linear weighting). While it offers the quickest signals, this sensitivity makes it prone to generating more false alarms, especially in choppy markets. It’s less commonly used in standard moving average multiple time frame analysis compared to SMAs and EMAs.
Choosing the Right MA Type
Consider the market and your goal. In clear trends, EMAs might offer earlier entries, while SMAs provide a smoother trend view. For identifying major levels on daily/weekly charts, SMAs (like the 200 SMA) are often standard. For timing entries on hourly charts within that trend, EMAs (like the 21 EMA) might be more suitable. Many traders use a mix: SMAs for the big picture on high timeframes, EMAs for tactical entries on lower ones. Experiment to see what fits your multi timeframe moving average strategy best.
Adjusting MA Lengths Across Timeframes
Once you’ve picked your timeframes and MA types, you need to select the right lengths (or periods) for your moving averages. Shorter lengths mean the MA hugs prices closely and reacts quickly, while longer lengths create smoother lines that reflect longer-term trends. Tailoring these lengths to each timeframe’s role is essential for an effective multi timeframe moving average strategy.

Short-Term Timeframe MAs (e.g., 5-15 period)
On your lowest timeframe, used for pinpointing entries (like a 5-min or 15-min chart), you’ll typically use fast MAs (e.g., 9-period, 13-period, 21-period EMA). These track immediate price action, highlighting momentum shifts and potential entry triggers like crossovers or quick pullbacks, helping you time your entries precisely.
Intermediate Timeframe MAs (e.g., 20-50 period)
On your middle chart (like a 1-hour or 4-hour), slightly longer MAs (e.g., 20-period, 50-period EMA or SMA) work well. Their job is to define the main trend for your trading session or swing, acting as dynamic support or resistance zones. A pullback to the 50 EMA on the 4-hour chart can be a key area to watch for entries if the daily trend agrees.
Long-Term Timeframe MAs (e.g., 100-200 period)
On your highest timeframe (Daily or Weekly), long MAs like the 100-period or 200-period SMA dominate. These define the major, overarching trend. Trades taken on lower timeframes should ideally align with the direction indicated by these key MAs. For example, being above the 200-day SMA is a strong bullish sign for considering long trades on lower charts.
Optimizing Length Settings
While standard settings (like 9, 21, 50, 200) are popular starting points, you might find slightly different lengths work better for specific assets or market conditions. Use backtesting to explore variations, but be careful not to over-optimize – finding settings that work perfectly on past data but fail in live trading. Aim for robustness: settings that perform reasonably well across various conditions. This fine-tuning is part of refining your multi timeframe moving average strategy.
Step-by-Step Implementation Process
Putting a multi timeframe moving average strategy into practice involves a clear, top-down workflow. You start with the big picture and gradually zoom in to find specific trading opportunities. This ensures your actions are aligned with the market’s broader flow.
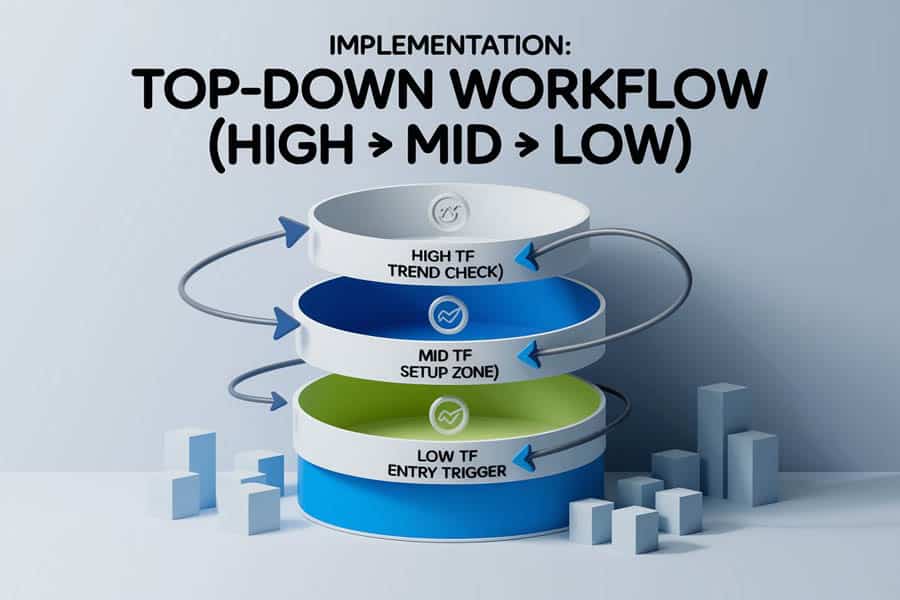
Identify Dominant Trend on Higher Timeframes
First, look at your highest chosen timeframe (e.g., Daily or Weekly). Apply your long-term MAs (like the 100 or 200 SMA). Is the price generally staying above these MAs (uptrend) or below them (downtrend)? Are the MAs sloping clearly up or down? This chart sets your overall directional bias. In an uptrend, you primarily look for buy setups on lower charts; in a downtrend, you focus on sells.
Confirm Trend on Intermediate Timeframes
Next, drop down to your middle timeframe (e.g., 4-hour). Apply your mid-term MAs (like the 20 or 50 EMA). Does the picture here agree with the higher timeframe? In a major uptrend, is the price also staying mostly above the 50 EMA on this chart? This timeframe is great for spotting pullbacks or consolidations within the main trend – potential zones where you might look for entries.
Find Optimal Entry Points on Lower Timeframes
Finally, go to your lowest timeframe (e.g., 1-hour or 15-minute) with your short-term MAs (like the 9 and 21 EMA). Here, you watch for specific entry triggers that align with the direction confirmed on the higher charts. This could be a bullish crossover (9 EMA moving above 21 EMA) during a pullback identified on the intermediate chart, or price bouncing firmly off one of the short-term MAs.
Using MA Crossovers Across Timeframes
Moving average crossovers are popular signals, but they’re much more reliable within a moving average multiple time frame context. A buy crossover on your entry chart (e.g., 5-minute) is far more convincing if the intermediate (e.g., 1-hour) and long-term (e.g., 4-hour) charts also show bullish conditions based on their respective MAs. Always filter lower timeframe signals through the lens of the higher timeframe trends.
Practical Trading Strategies
Applying the multi timeframe moving average strategy framework allows for several concrete trading approaches. These strategies use the context from higher timeframes to enhance the signals found on lower ones, aiming for higher-probability trades.
Read More: Moving Average Indicator in Forex

Trend Alignment Strategy
This is the foundation. Only take trades that align with the trend confirmed across your chosen timeframes. 1. Check the highest timeframe (e.g., Daily) with long MAs (e.g., 200 SMA) for the main trend. 2. Confirm the trend on the intermediate timeframe (e.g., 4-hour) with mid-term MAs (e.g., 50 EMA). 3. Look for entries on the lower timeframe (e.g., 1-hour) using short-term MAs (e.g., 9/21 EMA) during pullbacks in the direction of the confirmed trend. For example, buy on a dip to the 21 EMA on the 1-hour chart only if the Daily and 4-hour charts show an uptrend.
MA Crossover Strategy Across Timeframes
Use MA crossovers on your entry chart as triggers, but only if they agree with the larger trend. 1. Confirm the trend direction on higher/intermediate timeframes. 2. Wait for a crossover (e.g., 9 EMA crossing above 21 EMA for a buy) on your lower timeframe. 3. Enter only if the crossover direction matches the established larger trend. A bullish crossover during a major downtrend is often a false signal or a minor correction.
Support and Resistance with MAs
Moving averages, especially on intermediate and higher timeframes (like the 50 EMA or 200 SMA), often act as dynamic support in uptrends and resistance in downtrends. 1. Identify these key MA levels on your higher/intermediate charts. 2. Watch how price reacts when it pulls back (in an uptrend) or rallies (in a downtrend) to these MAs. 3. Look for entry signals (like candlestick patterns or bounces) on your lower timeframe as price interacts with these significant MA levels, ensuring alignment with the overall trend.
Using MA Bands for Entries/Exits
Plotting two MAs (one fast, one slow, e.g., 10 EMA and 20 EMA) creates a dynamic band. 1. In an uptrend (confirmed on higher TFs), look for entries when price dips into or near the lower edge of the band on your entry chart. 2. In a downtrend, look for short entries when price rallies towards the upper edge. 3. The band can also help with exits – e.g., exiting a long if price closes firmly below the lower MA.
These strategies integrate the core principles of the multi timeframe moving average strategy, focusing on context and confirmation.
Risk Management with MTF Moving Averages
A solid multi timeframe moving average strategy isn’t complete without robust risk management. The analysis across different charts provides logical places for stop-losses and helps in deciding appropriate position sizes.
Read More: Multiple Timeframe Strategy
Setting Stop-Loss Levels
Where do you place your safety net? MTF analysis offers several options:
- Near Entry Chart MA: Just beyond a short-term MA on your entry chart. Tighter stop, but more risk of getting stopped out by noise.
- Beyond Intermediate MA: Below a key MA on your intermediate timeframe (e.g., below the 4H 50 EMA for a long trade entered on the 1H). Gives the trade more room, requires smaller size for same risk.
- Based on Higher TF Structure: Using major support/resistance or a key MA on the highest timeframe. Widest stop, often used by longer-term traders.
Choose a level that logically invalidates your trade idea if breached. Consider using the Average True Range (ATR) to set stops a volatility-adjusted distance from an MA.
Position Sizing Considerations
How much capital do you allocate? The degree of alignment across timeframes can influence this (within your overall risk rules):
- Strong Alignment: If all timeframes clearly agree on the trend, you might feel confident taking a slightly larger position (still respecting your max risk per trade, e.g., 1%).
- Mixed Signals: If the highest timeframe trend is clear, but the intermediate chart is choppy, perhaps use a smaller size.
- Stop Distance is Key: Wider stops always require smaller position sizes to keep the dollar risk constant.
Managing Trailing Stops with MAs
MAs are great for trailing stops to lock in profits:
- Trail tightly below a fast MA on the entry chart to protect profits quickly.
- Trail more loosely below an intermediate MA (like the 4H 50 EMA) to ride a larger move, allowing for deeper pullbacks.
Adjusting your risk parameters based on the insights from your moving average multiple time frame analysis makes your trading plan more cohesive.
Common Pitfalls and How to Avoid Them
While powerful, the multi timeframe moving average strategy isn’t foolproof. Traders can fall into common traps. Knowing these helps you steer clear and maintain discipline.
Read More: 20, 50 and 200 day moving average crossover
Information Overload (Too Many Charts)
Trying to watch 5, 6, or more timeframes at once often leads to confusion, not clarity. Signals clash, and decision-making freezes.
- Avoidance: Stick to three core timeframes relevant to your trading style (e.g., Daily/4H/1H). Define the purpose of each chart and focus only on the MAs and price action relevant to that purpose. Keep it clean.
Conflicting Signals Across Timeframes
Sometimes the 1-hour chart screams “sell” while the Daily chart firmly says “buy.” What do you do?
- Avoidance: Give more weight to the higher timeframes. A short-term counter-trend signal is often just a pullback, potentially offering an entry in line with the major trend. If major timeframes genuinely conflict, it’s often best to wait for clarity. Patience prevents trading against the dominant flow.
Over-Optimization (Curve-Fitting)
Endlessly tweaking MA lengths to perfectly fit past data is a recipe for disappointment in live trading.
- Avoidance: Start with standard MA lengths. If optimizing, ensure the settings work reasonably well across different historical periods and market conditions, not just perfectly on one specific dataset. Robustness beats perfection. Simplicity often works best with a moving average multiple time frame approach.
Ignoring Other Market Factors
Relying solely on MAs means ignoring valuable information from price action patterns, support/resistance levels, volume, or news.
- Avoidance: Use the multi timeframe moving average strategy as your core framework, but incorporate other analysis. Does price action confirm the MA signal? Is there a major news event pending? MAs are lagging indicators; combine them with leading or real-time information for a well-rounded view. And always, always follow your risk management rules.
Opofinance Services: Enhance Your Trading
To effectively execute a multi timeframe moving average strategy, partnering with the right broker for forex trading is essential. Opofinance, regulated by ASIC, provides a secure and technologically advanced trading environment tailored to support your strategic needs.
- Advanced Trading Platforms: Choose from MT4, MT5, cTrader, and the user-friendly OpoTrade platform. All offer robust charting capabilities ideal for multi-timeframe analysis.
- Innovative AI Tools: Gain an edge with unique AI-driven features like the AI Market Analyzer, personalized AI Coach, and responsive AI Support to enhance your trading insights and skills.
- Social & Prop Trading: Connect with other traders through social trading features or explore opportunities to trade larger capital via proprietary trading programs.
- Secure & Flexible Transactions: Enjoy peace of mind with secure deposit and withdrawal options, including popular cryptocurrencies. Opofinance facilitates these transactions conveniently and typically without charging any fees from their end.

Optimize your trading potential with a broker focused on security, cutting-edge tools, and trader growth.
Explore Opofinance and elevate your trading journey today!
Conclusion
The multi timeframe moving average strategy offers a clear path through the often-chaotic financial markets. By analyzing trends across different time horizons using moving averages, you gain essential context that helps filter out noise and identify higher-probability trading opportunities. This approach promotes discipline by encouraging traders to align their actions with the dominant market flow revealed on higher timeframes. While it requires careful selection of timeframes, MA types, and lengths, mastering this strategy can significantly enhance your ability to make informed, confident decisions, forming a cornerstone of a robust trading plan.
Key Takeaways
- Get Context: Multi-timeframe analysis reveals the bigger picture missed on single charts.
- Confirm Trends: Use MAs on high timeframes (Daily/Weekly) to spot the main trend.
- Filter Noise: Use MAs on intermediate timeframes (4-hour/1-hour) to confirm the trend and find pullback zones.
- Time Entries: Use MAs on low timeframes (15-min/5-min) for precise entries aligned with the bigger trends.
- Choose MAs Wisely: SMAs for smooth, long-term views; EMAs for faster signals, especially on lower TFs.
- Sensible Lengths: Use appropriate MA periods for each timeframe’s role; avoid over-fitting to past data.
- Top-Down Approach: Analyze High TF -> Mid TF -> Low TF for systematic trade identification.
- Manage Risk: Use MTF levels for logical stop-losses and informed position sizing.
- Avoid Traps: Keep analysis focused, prioritize higher TFs, don’t over-optimize, and combine with price action.
- Apply Strategies: Use Trend Alignment, Contextual Crossovers, and MA Support/Resistance tactics.
Can the multi timeframe moving average strategy be used for scalping?
Yes, absolutely. Scalpers can adapt the multi timeframe moving average strategy by using much shorter timeframes. For example, they might use the 15-minute chart for intermediate context, the 5-minute chart for the immediate trend, and the 1-minute chart with very fast EMAs (like 5 or 8) for pinpoint entries and exits. The core principle of aligning with the slightly higher timeframe’s direction remains crucial, though noise and transaction costs are bigger factors.
How do I handle flat or sideways moving averages across multiple timeframes?
Flat MAs across your chosen timeframes signal a ranging or directionless market. In these conditions, a trend-following multi timeframe moving average strategy will likely generate many false signals. The best approaches are usually to either wait patiently for a clear trend to establish itself across the timeframes before engaging, or switch to a different strategy specifically designed for range-bound markets (like trading bounces off support/resistance or using oscillators).
Is it better to use SMAs or EMAs for a multi timeframe moving average strategy?
There’s no single “best” answer, as it often comes down to preference. However, a very common and effective approach within the multi timeframe moving average strategy is to use SMAs (like the 50, 100, 200) on higher timeframes (Daily, Weekly) for their smoothness in defining major trends and levels, and EMAs (like the 9, 21, 50) on lower/intermediate timeframes (4H, 1H, 15M) for their responsiveness in identifying pullbacks and entry signals. This combines the strengths of both types.


