Scalping is one of the most dynamic trading strategies, and among the variety of tools available, the Parabolic SAR scalping strategy stands out for its simplicity and effectiveness. But how exactly does this strategy function, and why is it considered a go-to for many traders? In essence, the Parabolic SAR (Stop and Reverse) indicator identifies potential price reversals, enabling traders to take advantage of brief price fluctuations in the market. For traders utilizing a regulated forex trading broker, this approach can yield quick profits when implemented correctly.

In this comprehensive guide, we will delve deep into the Parabolic SAR scalping strategy, reveal the best settings for scalping, and answer frequently asked questions to equip you with valuable knowledge. By the conclusion of this article, you will have the tools needed to apply the strategy effectively and optimize your trading results.
What is the Parabolic SAR Scalping Strategy?

The Parabolic SAR (Stop and Reverse) is a technical indicator developed by J. Welles Wilder Jr., designed to detect potential reversals in price trends. Scalpers, who execute multiple trades to capitalize on small market movements, find this indicator particularly useful due to its simplicity and quick responsiveness.
How does it work?
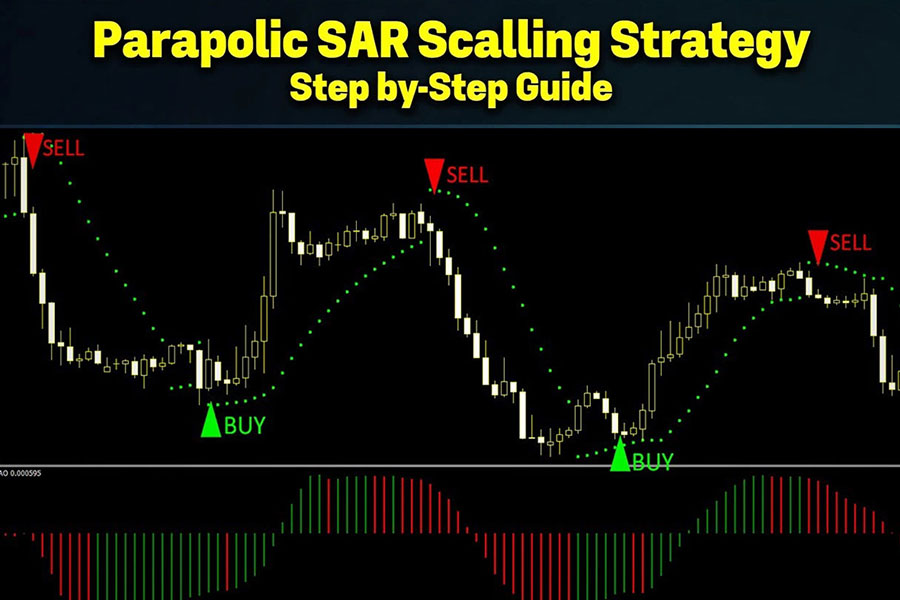
The Parabolic SAR consists of dots placed above or below the price on a chart. When the dots appear below the price, the market is in an uptrend, indicating a buy signal. Conversely, when the dots appear above the price, the market is in a downtrend, signaling a sell opportunity. In scalping, the focus is on quick entries and exits as soon as the dots shift positions, helping traders lock in small, frequent profits.
Key Elements of the Parabolic SAR Scalping Strategy
1. Fast Execution is Key
Scalping relies on the ability to execute trades rapidly. The second a trend reversal is identified through the Parabolic SAR, traders must act swiftly to open or close their positions. Timing is crucial in scalping, as delayed actions can lead to lost opportunities. This is where using a platform from a regulated forex broker is beneficial, ensuring seamless trade execution and minimal lag.
2. Short Time Frames for Scalping
The Parabolic SAR scalping strategy works optimally on short time frames, such as 1-minute, 3-minute, or 5-minute charts. Scalpers aim to capture small price changes by limiting their exposure time, allowing them to execute numerous trades within a single session.
3. Volatility as a Scalper’s Best Friend
Scalping strategies flourish in volatile markets. The more frequent the price fluctuations, the more opportunities exist for scalpers. Traders often focus on liquid assets like major forex pairs because they exhibit frequent price movements with low spreads.
4. Fine-Tuned Parabolic SAR Settings for Scalping
To fully optimize the Parabolic SAR indicator for scalping, adjustments must be made to its settings. The default Step of 0.02 and Maximum of 0.2 are often not sensitive enough for quick trades. Instead, traders tend to reduce the Step to 0.01 for more precise trend reversals.
Here’s a recap of the recommended Parabolic SAR settings for scalping:
- Step: 0.01 for increased sensitivity.
- Maximum: 0.1 to reduce distance between the price and dots.
These optimized settings ensure that traders can respond faster to potential reversals.
Read More: Parabolic SAR Indicator Strategy
Parabolic SAR Scalping Strategy: Step-by-Step Guide
1. Select a Short Time Frame
Start by selecting a short time frame such as a 1-minute, 3-minute, or 5-minute chart. The objective of scalping is to capture small price movements, and shorter time frames allow you to spot reversals more quickly.
2. Apply the Parabolic SAR Indicator
Most trading platforms, including MetaTrader 4 and MetaTrader 5, come equipped with the Parabolic SAR indicator. Adjust the settings to a Step of 0.01 and Maximum of 0.1 to optimize for scalping.
3. Identify Entry Points
- Enter a buy trade when the Parabolic SAR dots move below the price, signaling an uptrend.
- Enter a sell trade when the Parabolic SAR dots move above the price, signaling a downtrend.
4. Exit Your Trade
Scalping requires exiting trades as soon as the Parabolic SAR reverses its position again. The goal is to make multiple small profits rather than waiting for large market moves.
5. Set Stop Loss and Take Profit
Risk management is crucial in scalping. Most scalpers use a risk-to-reward ratio of 1:1 or 1:2, setting tight stop losses and take profits to ensure small but frequent gains.
Advanced Parabolic SAR Scalping Strategies
Parabolic SAR Breakout Strategy
The Parabolic SAR isn’t just for detecting trend continuations—it also plays a crucial role in identifying breakouts, a powerful tool for scalpers aiming to profit from sudden shifts in market direction. When the dots of the Parabolic SAR shift from one side of the price to the other, it signals a potential breakout or a trend reversal, giving scalpers an opportunity to enter or exit trades quickly.
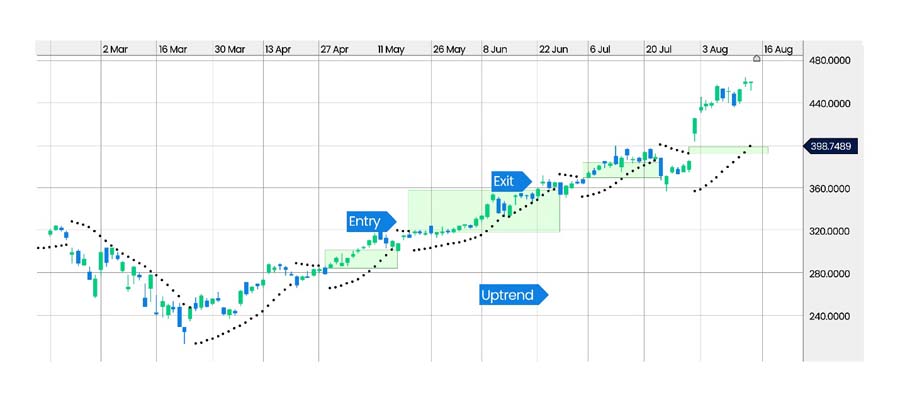
- When the dots switch from being below the price to above after a prolonged uptrend, it signals a bearish breakout. This indicates that it may be time to exit long positions or enter short ones to capitalize on the downward shift.
- Conversely, when the dots move from above the price to below it after a long downtrend, it signals a bullish breakout, an ideal time to initiate long positions and ride the upward momentum.
This simple yet powerful breakout identification technique helps scalpers react quickly to price movements and lock in profits at key market moments.
Double Parabolic SAR Strategy
The Double Parabolic SAR Strategy is a more nuanced approach that leverages two distinct timeframes to improve the accuracy of trade signals. By combining both a long-term and short-term view of the market, traders can increase their chances of success by confirming the overall trend before placing a trade.
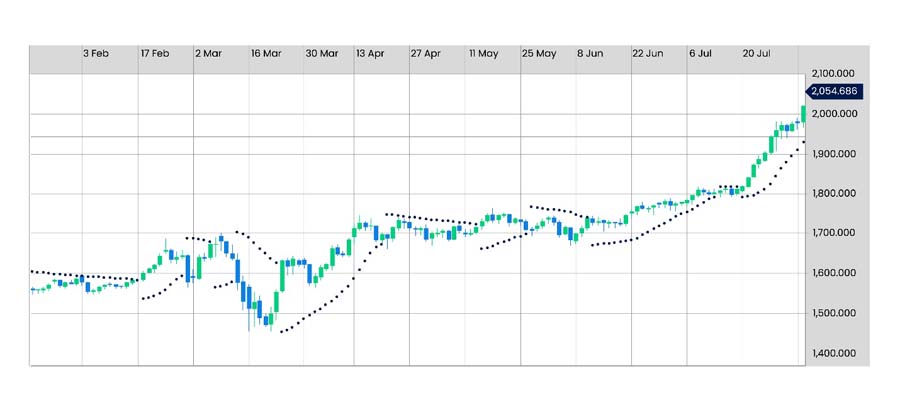
- Step 1: Analyze the longer timeframe, such as the 1-hour or daily chart, to understand the broader market trend. If the Parabolic SAR shows an upward trend on this chart, it suggests the market is likely to continue rising.
- Step 2: Move to a shorter timeframe, such as the 1-minute or 5-minute chart, to time your trades in line with the identified trend. If the short-term chart aligns with the long-term trend, place your trade accordingly.
The Double Parabolic SAR strategy reduces the risk of entering trades based on false reversals and increases the likelihood of executing successful trades by ensuring alignment across timeframes.
Read More: Best Indicator to Use with Parabolic SAR
Parabolic SAR Moving Average Strategy
Incorporating moving averages with the Parabolic SAR can serve as a powerful filter to confirm trend direction and avoid market noise. Traders often use this strategy to gain additional confirmation of a trend before entering or exiting trades.
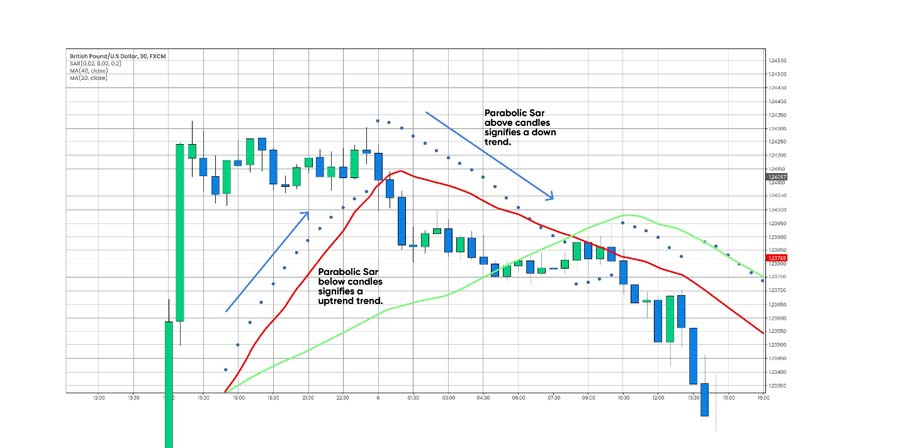
- When the short-term moving average (e.g., 20-period) crosses below the long-term moving average (e.g., 40-period), and the Parabolic SAR dots are above the price, it’s a clear signal of a strong downtrend. This provides an opportunity to open short positions or exit long ones.
- Conversely, when the short-term moving average crosses above the long-term one and the Parabolic SAR dots are below the price, it signals a strong uptrend. This gives a clear indication to enter long trades or hold onto existing positions.
This method combines the benefits of both indicators to confirm the strength of a trend and minimize false signals.
Parabolic SAR RSI Strategy
Combining the Relative Strength Index (RSI) with the Parabolic SAR gives traders a comprehensive view of market momentum. While the Parabolic SAR identifies trend reversals, the RSI highlights whether the market is in an overbought or oversold condition, adding an extra layer of confirmation to the strategy.
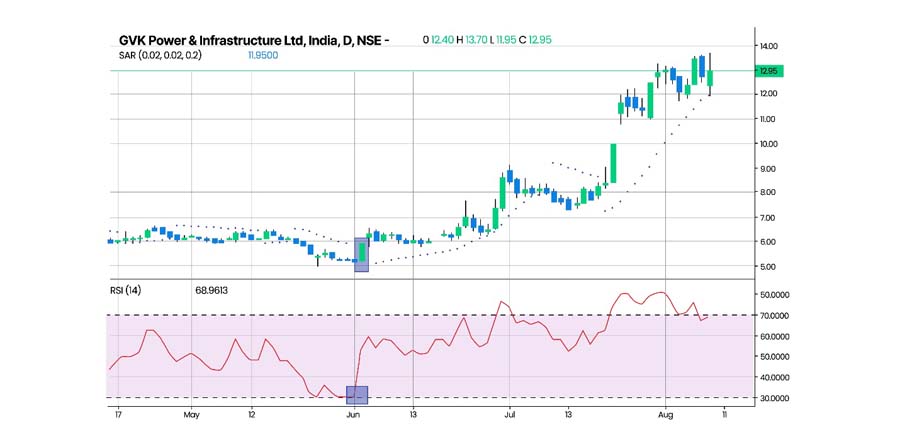
- When the current RSI value is greater than the Parabolic SAR and the previous RSI value was lower, this signals a buy opportunity. For the signal to be valid, the RSI should ideally be below 35%, indicating an oversold condition.
- On the flip side, if the RSI value is less than the Parabolic SAR and the previous RSI value was higher, this suggests a sell opportunity. For the signal to hold weight, the RSI should be above 65%, indicating an overbought condition.
This dual approach allows traders to filter out false trend reversals, giving them a higher probability of entering successful trades. By combining the strengths of both indicators, traders can make more informed decisions with a reduced likelihood of false signals.
Backtesting the Parabolic SAR Scalping Strategy

Backtesting is essential for refining the Parabolic SAR scalping strategy, as it helps traders understand its performance with historical data, identify strengths and weaknesses, and optimize the settings.
Why Backtesting Matters
Backtesting offers an objective look at how the strategy performs under specific market conditions. It allows traders to:
- Evaluate performance: See how the strategy fares in trending vs. ranging markets.
- Optimize settings: Fine-tune the Parabolic SAR settings to improve trade entries and exits.
- Manage risk: Identify potential drawdowns and adjust risk parameters accordingly.
This process helps eliminate emotional bias, allowing for more data-driven trading decisions.
Steps to Backtest the Parabolic SAR Scalping Strategy
- Select a Backtesting Platform: Platforms like MetaTrader 5, TradingView, or other forex platforms are great options for backtesting.
- Set Timeframes and Parabolic SAR Settings: Use scalping timeframes (e.g., 1-minute or 5-minute) and tweak the Parabolic SAR’s acceleration factor (AF)—higher values increase sensitivity but may generate more false signals.
- Combine Indicators: For better results, combine the Parabolic SAR with other indicators like RSI or moving averages to filter false signals.
- Analyze Key Metrics:
- Win rate: Percentage of successful trades.
- Risk-Reward Ratio: Average gain versus average loss.
- Maximum Drawdown: The largest drop in your account during the test period.
- Profit Factor: Gross profit to loss ratio (over 1 means profitable).
Example of Backtesting Results
A 5-minute EUR/USD backtest using the Parabolic SAR scalping strategy with a 0.02 AF and RSI filter might show:
- Win Rate: 65%
- Risk-Reward Ratio: 1.5:1
- Maximum Drawdown: 10%
- Profit Factor: 1.8
These results suggest a reliable strategy, but live markets can differ, so fine-tuning is key.
Final Tips for Effective Backtesting
- Test in different market conditions: Trending vs. ranging markets.
- Avoid curve fitting: Don’t over-optimize based solely on historical data.
- Factor in slippage: Real-time trading often differs from perfect backtest results.
Opofinance Services: The Ideal Broker for Parabolic SAR Scalping
As a scalper, your success depends not only on your strategy but also on the broker you choose. Opofinance, regulated by ASIC, provides the ideal environment for scalping with tight spreads, fast execution, and safe deposit and withdrawal methods.
One of the standout features of Opofinance is its social trading platform, where traders can follow and replicate the strategies of top-performing traders. For those who are new to scalping or wish to refine their strategy, this feature offers an incredible opportunity to learn and improve their performance by observing expert traders.

Additionally, Opofinance is officially listed as a MetaTrader 5 (MT5) broker, making it a top choice for scalpers who need fast, reliable trade execution. Safe and convenient deposit and withdrawal methods further enhance the trading experience, allowing you to focus on your trades without worrying about delays or additional fees.
By offering these key services, Opofinance ensures that traders have everything they need to execute their strategies efficiently and profitably.
Conclusion
The Parabolic SAR scalping strategy is an effective method for capturing small, frequent profits in fast-moving markets. Whether you’re using the basic strategy or integrating advanced techniques like the Double Parabolic SAR or combining it with RSI, this approach offers a structured way to scalp the market with minimal risk.
The success of this strategy, however, is greatly enhanced by the platform you choose. By partnering with a regulated broker like Opofinance, you can ensure that your trades are executed with speed and precision, crucial elements in scalping.
By mastering the Parabolic SAR scalping strategy and using a reliable broker, traders can significantly improve their chances of success in the dynamic world of forex trading.
How does the Parabolic SAR indicator compare to other scalping indicators?
The Parabolic SAR is often preferred for its simplicity and clear trend signals. Unlike other indicators that can be difficult to interpret, the Parabolic SAR provides visual dots above or below the price, making it easy to spot reversals. However, combining it with indicators like moving averages or RSI can offer more confirmation and reduce the risk of false signals.
Can Parabolic SAR be used on assets other than forex?
Yes, while the Parabolic SAR is popular in forex trading, it can be applied to a variety of asset classes, including stocks, commodities, and cryptocurrencies. The key is to adjust the indicator’s settings based on the volatility of the asset being traded.
How do I avoid false signals when using the Parabolic SAR?
To avoid false signals, it’s best to combine the Parabolic SAR with other indicators like RSI or moving averages. Additionally, trading in highly volatile markets and ensuring that trades are placed in line with the overarching trend can help minimize risks associated with false breakouts or reversals.


