

What is POC in trading? Simply put, the Point of Control (POC) represents the price level where the highest volume of trades occurred over a specific period. It is the market’s favorite price, a magnetic zone of high liquidity and agreement between buyers and sellers. For traders using a regulated forex trading broker, understanding POC is a game-changer for identifying true support and resistance. This article will provide a deep dive into the POC, explaining how it’s calculated and its relationship with the Volume Profile. We will explore practical strategies, advanced tips for integrating it with other tools, and common mistakes to avoid, giving you a comprehensive framework for using the POC in trading.
Key Takeaways:
- POC Defined: The Point of Control (POC) is the single price level with the most traded volume within a specific timeframe, making it a powerful magnet for price.
- Core Function: Its primary role is to identify significant support and resistance levels based on actual trading activity, not just price action.
- Market Sentiment: The location and migration of the POC offer deep insights into market sentiment, directional bias, and potential trend reversals.
- Strategic Application: Effective POC trading strategy options include trading breakouts, pullbacks to the POC for trend continuation, and reversals upon POC rejection.
- Holistic Analysis: POC is most powerful when combined with other technical indicators like VWAP, moving averages, and Fibonacci levels for confirmed trade signals.
- Dynamic Tool: The POC is not static; it evolves as new volume enters the market. Traders must adapt their analysis to its dynamic nature in both trending and ranging conditions.
Understanding the Point of Control (POC)
Before you can effectively leverage the POC in trading, it’s essential to grasp its fundamental meaning and how it comes to life on your charts. The Point of Control isn’t just another line; it’s a data-driven indicator that tells a story about market structure, participant behavior, and where institutional interest lies. Unlike traditional indicators that rely solely on price and time, the POC introduces a third, critical dimension: volume. This makes it an indispensable tool for traders seeking an edge in understanding market dynamics beyond simple price movements. It represents the price level that the market has advertised, explored, and traded most heavily, essentially marking it as the ‘fairest’ price for a given session or period.
Definition of POC and Its Origin
he Point of Control (POC) is the backbone of Volume Profile analysis. It is defined as the exact price level at which the highest amount of trading volume has been executed. Think of it as the gravitational center of the market for a specific timeframe. Its origins are tied to the concept of Market Profile, developed by trader Peter Steidlmayer in the 1980s. He sought to visualize the market’s two-way auction process, and the POC emerged as the price that was most accepted by both buyers and sellers. While Market Profile uses time price opportunities (TPOs), Volume Profile, and by extension the POC, uses actual traded volume, offering a more precise measure of market conviction. This makes what is poc in trading a question of identifying the market’s true equilibrium point.
How POC is Calculated in Trading
The calculation of the POC is straightforward in concept but computationally intensive, which is why it’s provided by modern trading platforms. The platform’s Volume Profile tool scans every transaction within a user-defined period (e.g., a single day, week, or a specific price range). It then aggregates the total volume traded at each individual price level. The price level with the largest aggregated volume is then identified and highlighted as the Point of Control. For example, if over a trading day, more shares of Apple were traded at $175.50 than any other price, then $175.50 would be that day’s POC. This calculation is dynamic; as the session progresses and new trades are made, the POC can shift, reflecting the evolving consensus of value among market participants.
POC and Volume Profile: The Core Relationship
You cannot discuss the POC without talking about the Volume Profile. The Volume Profile is a histogram displayed vertically on the price chart, showing the volume traded at each price level. The POC is simply the longest bar on this histogram, indicating the “high-volume node” (HVN) with the most activity. The relationship is symbiotic: the Volume Profile provides the full context, while the POC gives you the single most important focal point within that context. The shape of the Volume Profile around the POC offers additional clues. A well-defined, bell-shaped profile (a “D-shaped” profile) with the POC near the center suggests a balanced market in a state of consolidation. Conversely, a profile with multiple high-volume areas or a POC near the extreme highs or lows can signal an imbalanced, trending market. Understanding this relationship is fundamental to mastering the POC in trading.
Read More: 7 Steps to a Winning Volume Profile Strategy
How to Use POC in Trading
Once you understand what the POC is, the next logical step is learning how to apply it in real-world trading scenarios. Integrating the POC in trading goes beyond simply identifying a line on a chart; it involves interpreting its position and interaction with price to make informed decisions. It serves as a versatile reference point for gauging market sentiment, confirming directional bias, and planning precise entries and exits. From my experience, the POC acts as a reliable roadmap, showing you where the market has found—and is likely to find again—significant value. This section breaks down the practical methods for transforming the POC from a concept into an actionable component of your trading toolkit, covering everything from support and resistance to reversal recognition.
Using POC to Identify Support and Resistance
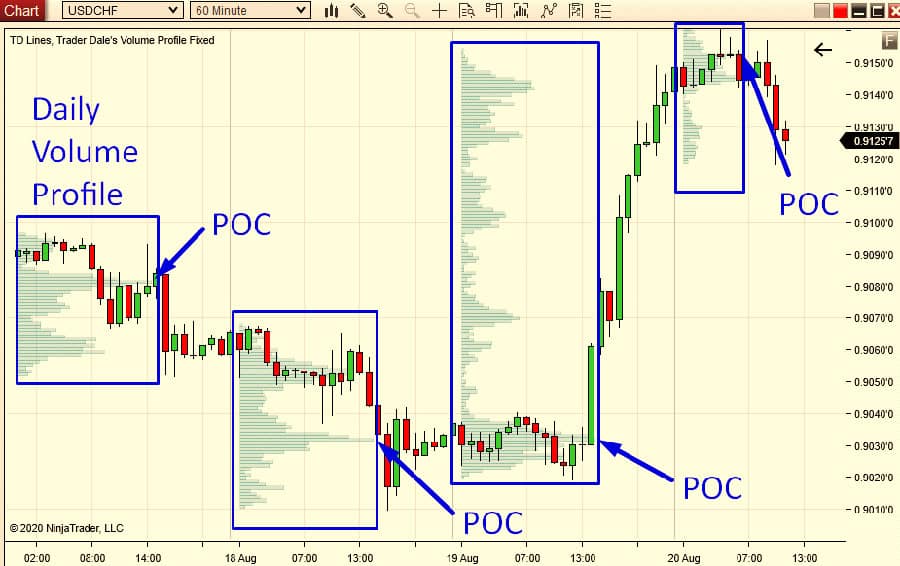
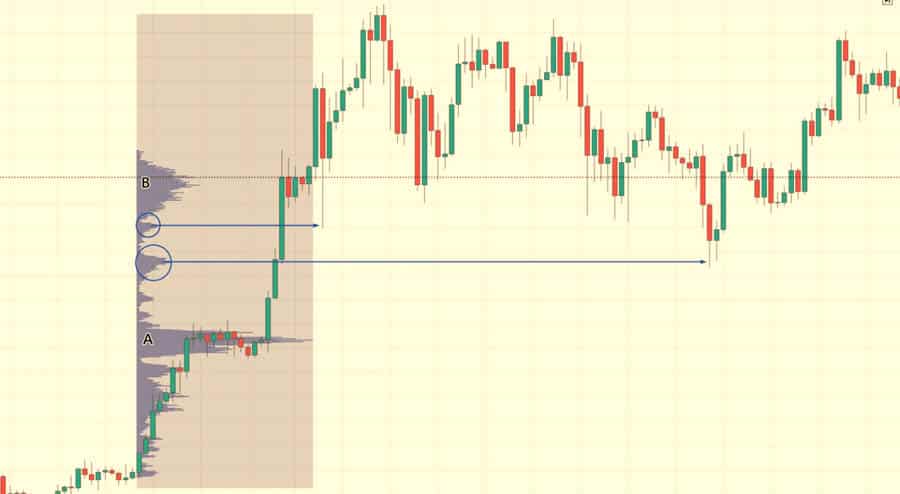
This is the most direct application of the Point of Control. Because the POC represents the area of highest traded volume, it naturally acts as a powerful level of POC support and resistance. The logic is simple: if a massive amount of volume was traded at a specific price in the past, it’s highly probable that a significant number of participants still hold positions from that level.
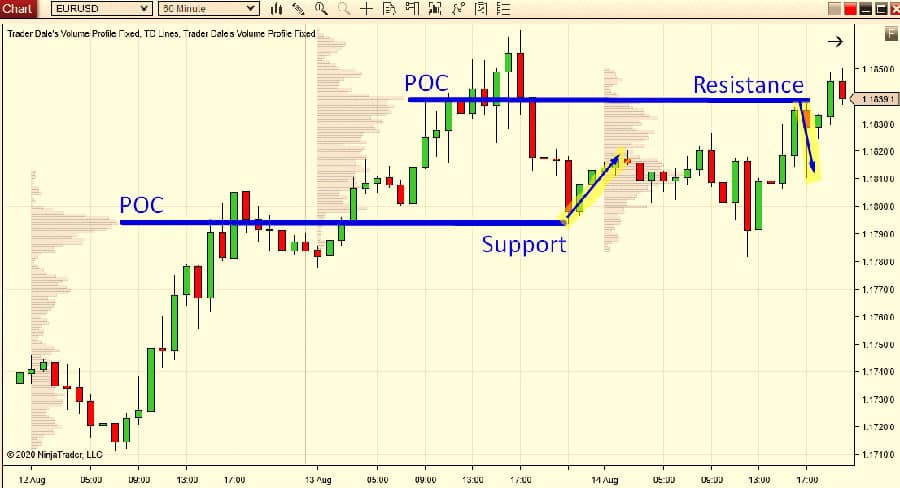
- POC as Support: When the current market price is above the POC, the POC level often acts as a strong support zone. If the price pulls back to this level, buyers who initiated positions there before may defend it, and new buyers may see it as a fair value area to enter the market. A bounce off the POC confirms its strength as support.
- POC as Resistance: Conversely, when the price is below the POC, it tends to function as a formidable resistance level. Traders who are trapped in losing long positions from that level may use a rally back to the POC as an opportunity to exit at their break-even point, creating selling pressure. Likewise, short-sellers will view it as a high-probability area to initiate new positions.
The key is to observe price action as it approaches the POC. A decisive rejection or a strong bounce provides a much clearer signal than simply placing an order at the POC level itself. This is a core tenant of any effective POC trading strategy.
POC as a Market Sentiment Indicator
The location of the POC within a trading session’s range provides invaluable clues about the underlying market sentiment and the dominant force—buyers or sellers. This is a more nuanced way to use the POC in trading.
- Acceptance vs. Rejection: If the price spends a significant amount of time trading around the POC, it signifies acceptance of that value. The market is in balance, and a range-bound environment is likely. However, if the price quickly moves away from the POC after its formation, it signals rejection, suggesting an imbalanced market and the start of a potential trend.
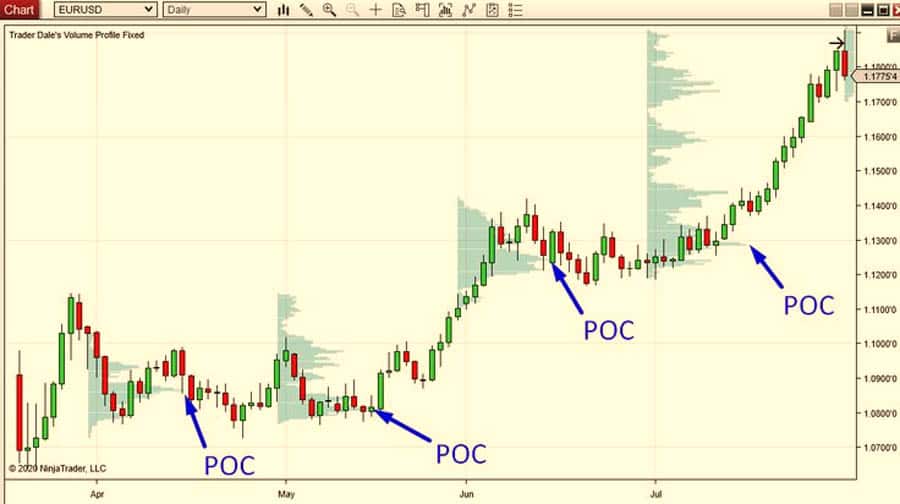
- POC Migration: This is a powerful concept. A migrating POC, which moves higher or lower from one session to the next, indicates a clear directional bias. If today’s POC forms higher than yesterday’s POC, it shows that value is rising and buyers are in control, confirming an uptrend. If the POC forms lower, it suggests value is decreasing and sellers are dominant, confirming a downtrend. Watching this day-over-day progression is like having a compass for market direction.
Recognizing Market Reversals Through POC
The POC is an excellent tool for spotting potential exhaustion and market reversals. When a strong trend has been in place, the POC will typically migrate in the direction of the trend. A reversal signal can emerge when this pattern breaks. For instance, in a steady uptrend, you would expect the daily POC to form progressively higher. If, after a strong upward move, a session ends with the POC forming near the top of the range but the next day price fails to break higher and instead starts trading significantly below that POC, it’s a red flag. This can indicate that the buyers who built the high-volume node are now trapped. If the price then breaks below the previous day’s value area, a reversal is highly likely. The failure of a POC to act as support in an uptrend (or resistance in a downtrend) is a powerful indication that the trend’s momentum is fading and a turn may be imminent.
Practical Steps to Apply POC on Your Charts
To start using the POC, you first need the right tool. Most advanced charting platforms offer a Volume Profile indicator. Here’s a simple workflow to get started:
- Select Your Tool: Add a “Volume Profile Session Volume (VSPV)” or “Volume Profile Visible Range (VPVR)” indicator to your chart. The session volume is great for day trading as it resets daily, while the visible range is useful for analyzing the current screen.
- Identify the POC: The indicator will automatically highlight the POC, usually with a distinct color like red or a bright line.
- Mark Key Levels: Mark the current and previous day’s POC levels on your chart. These are your primary reference points for support, resistance, and sentiment.
- Observe Price Interaction: Watch how the price behaves when it approaches these POC levels. Is it being accepted or rejected? Is the current price above or below the previous POC?
- Contextualize with the Trend: Always analyze the POC within the context of the broader market trend. A POC signal that aligns with the higher-timeframe trend is significantly more reliable. This is a crucial element in learning how to use POC in trading effectively.
Read More: Market Profile vs Volume Profile
Popular POC Trading Strategies
With a solid understanding of what the POC represents and how to interpret its behavior, we can now delve into specific, actionable trading strategies. A POC trading strategy is not a standalone system but a framework for identifying high-probability setups. The beauty of the POC is its objectivity; it’s based on real volume data, which removes much of the guesswork associated with traditional price action analysis. These strategies are designed to capitalize on the magnetic nature of the POC and the predictable reactions that price exhibits around this critical level. Whether you are a breakout trader, a trend follower, or a contrarian, there is a POC setup that can fit your style. From my experience, the most robust signals come from waiting for confirmation rather than anticipating a move.
Trading the POC Breakout
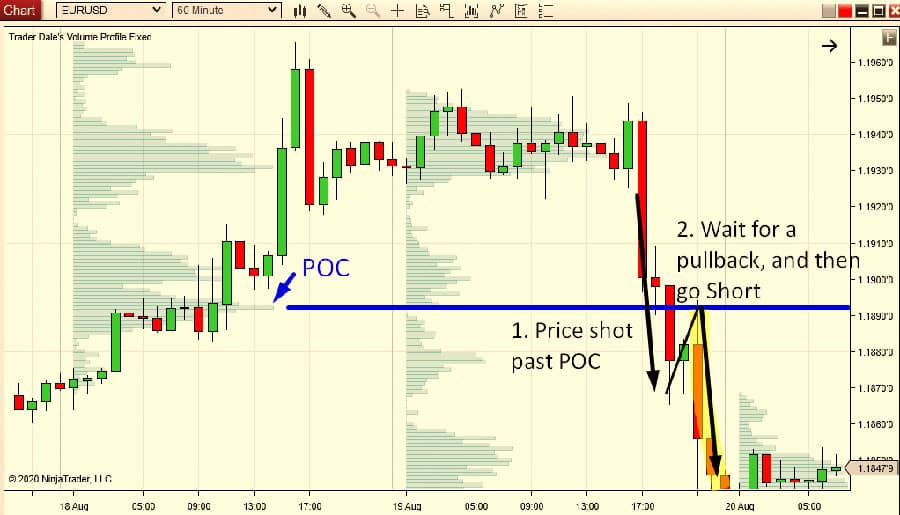
A POC breakout strategy is designed for markets transitioning from balance to imbalance—that is, from consolidation to a new trend. This setup occurs after a period of range-bound activity where a prominent POC has formed, indicating a strong consensus of value.
- The Setup: Identify a clear consolidation range with a well-defined POC near the middle. This signifies a market coiling up with energy. The breakout occurs when the price closes decisively above (for a long trade) or below (for a short trade) this consolidation range and, more importantly, away from the POC.
- Entry Signal: The entry is typically taken on the candle that breaks and closes outside the range. An aggressive entry might be on the initial break, while a more conservative approach is to wait for a retest of the breakout level or the POC itself, which should now act as support/resistance.
- Stop-Loss and Take-Profit: A logical stop-loss would be placed on the other side of the consolidation range, or just below the POC for a long trade (and above for a short). The take-profit can be targeted at a measured move of the range’s height or the next significant high-volume or low-volume node from the Volume Profile.
This strategy thrives on volatility and is a powerful way to catch the beginning of a new, sustained move.
POC Pullback Strategy for Trend Continuation
This is arguably one of the most reliable ways to use the POC in trading. It’s a trend-following strategy that aims to enter a market that is already showing a clear directional bias. The core idea is to wait for a low-risk entry during a temporary pullback in an established trend.
- The Setup: First, identify a clear uptrend or downtrend. In an uptrend, you will notice the daily POC migrating higher. The entry opportunity arises when the price, in its natural ebb and flow, pulls back to the previous day’s or a recent prominent POC. This level represents a “fair value” area where buyers (in an uptrend) are likely to step back in.
- Entry Signal: The entry is not taken simply because the price touches the POC. You must wait for confirmation. This can be a bullish candlestick pattern (like a hammer or engulfing candle) forming at the POC level, or a clear bounce with increasing volume.
- Stop-Loss and Take-Profit: Place the stop-loss just below the POC and the low of the confirmation candle. The take-profit target should be set at the recent swing high in an uptrend, or traders can trail their stop to ride the trend for as long as possible. This is an excellent POC trading strategy for its defined risk and high reward potential.
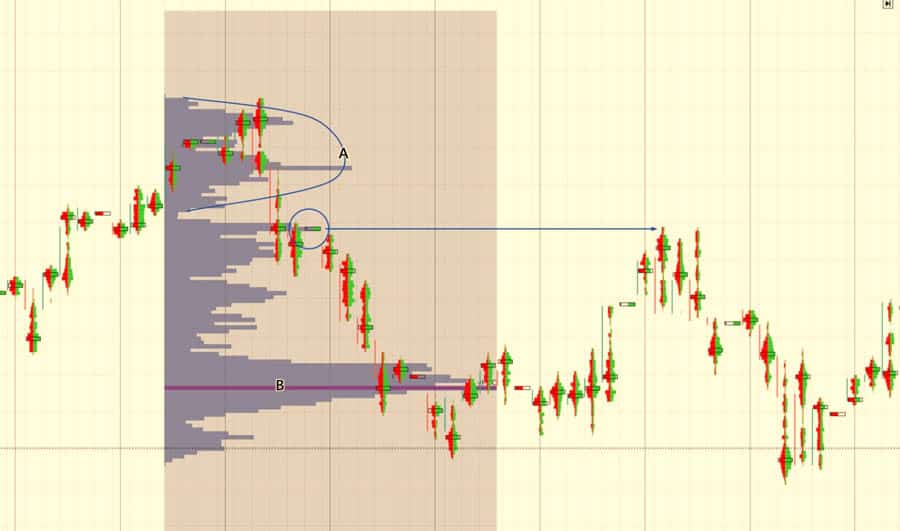
POC Rejection & Reversal Trading Setup
This is a contrarian strategy designed to fade moves and catch trend reversals. It capitalizes on the failure of a market to accept prices beyond a key POC level, often occurring at the extremes of a range or after a trend extension.
- The Setup: Look for a scenario where the price attempts to break a significant prior POC (e.g., yesterday’s POC) but fails to sustain the move. For a bearish reversal, you’d see the price rally up to a key POC level, stall, and then get pushed back down decisively. This shows that sellers are aggressively defending that value area.
- Entry Signal: The entry signal is the strong rejection candle itself—a long-wicked pin bar or a strong bearish engulfing candle at the POC level. This indicates that the attempted breakout has failed, and the opposite side has taken control.
- Stop-Loss and Take-Profit: The stop-loss should be placed just above the high of the rejection candle. Take-profit targets can be set at the next significant support level, which is often the closest low-volume node (LVN) below, as price tends to travel quickly through these thin-volume areas, or the opposite end of the day’s range.
This setup requires patience but can lead to very fast and profitable trades as trapped traders are forced to liquidate their positions.
Read More: The volume indicator in Forex tr
Advanced Insights and Tips for POC Usage
To truly elevate your trading, you need to move beyond the basic strategies and incorporate more nuanced, advanced techniques. Mastering the POC in trading involves understanding its limitations and learning how to synergize it with other analytical tools. This is where experience plays a huge role. Over time, a trader develops a feel for how the POC behaves in different market environments and across various timeframes. This section is designed to accelerate that learning curve by sharing advanced insights and practical tips. These concepts will help you build a more robust and adaptive trading framework, allowing you to refine your entries, manage risk more effectively, and avoid the common pitfalls that trap novice traders.
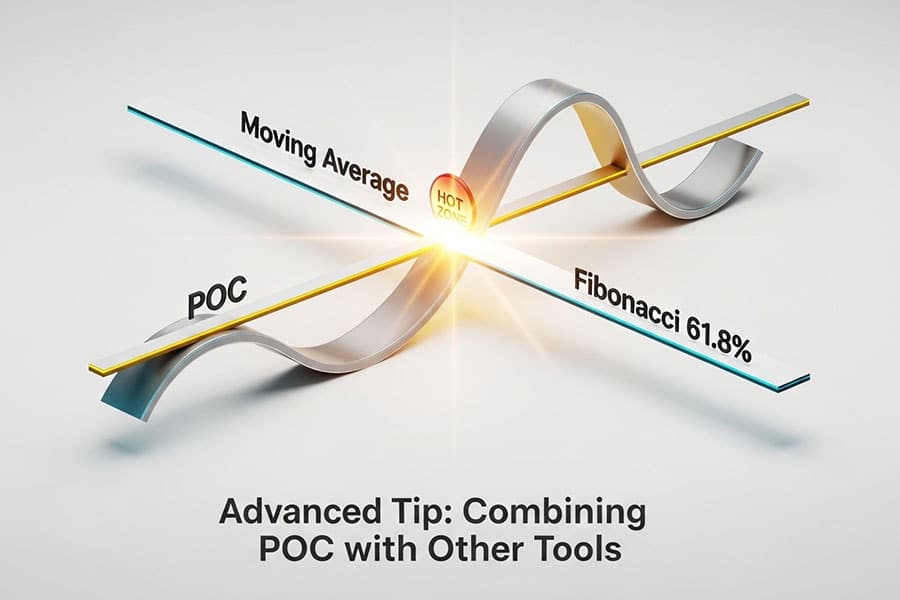
Combining POC with Other Technical Indicators
The POC is powerful, but it’s not infallible. Its predictive accuracy increases exponentially when confirmed by other, non-correlated indicators. This practice, known as confluence, is the cornerstone of high-probability trading.
- Moving Averages: If the price is in an uptrend and pulls back to a 20-period EMA that also happens to align perfectly with the daily POC, the probability of a bounce is significantly higher. The POC provides the volume-based rationale, while the moving average confirms the dynamic trend support.
- Fibonacci Levels: Combining the POC with Fibonacci retracement levels is another powerful technique. Imagine a pullback in an uptrend that stalls at the 61.8% Fibonacci level. If that level is also where the session’s POC is forming, you have a very strong case for a long entry. This shows that both price geometry and volume consensus are aligned.
- VWAP (Volume-Weighted Average Price): The VWAP is a favorite of institutional traders. When the daily POC and the VWAP are at the same or very close price levels, that zone becomes an incredibly strong area of intraday support or resistance. A rejection from this combined level is a very high-quality signal. This is a key aspect of learning how to use poc in trading like a professional.
Interpreting POC in Different Time Frames
A common mistake is analyzing the POC on only one timeframe. A multi-timeframe analysis provides crucial context and helps filter out noise.
- Higher Timeframes (Weekly/Monthly): A weekly or monthly POC acts as a major gravitational level. These long-term POCs represent significant value areas that can influence market direction for weeks or months. When the price approaches a weekly POC, expect a significant reaction. It’s a key level for swing traders and long-term investors.
- Daily Timeframe: The daily POC is the workhorse for most day and swing traders. As discussed, tracking the migration of the daily POC provides clear insight into the short-to-medium term trend and sentiment.
- Intraday Timeframes (Hourly/30-Min): On lower timeframes, you can use a “Visible Range” Volume Profile to see how the POC is developing in real-time. This is useful for scalping and fine-tuning entries. For example, if you see the POC for the current session forming and the price is holding above it, it provides short-term bullish confirmation for an entry based on a higher-timeframe signal.
The best approach is a top-down analysis: identify the major weekly/monthly POCs as your map, use the daily POC for directional bias, and use the intraday POC for precise timing.
Managing Risk Using POC Levels
Effective risk management is what separates profitable traders from the rest. The POC provides exceptionally clear and logical levels for placing stop-losses.
- Logical Stop Placement: When taking a long trade from a POC level, your stop-loss should be placed just below it. The reasoning is solid: if the price breaks and holds below the highest volume area, your trade thesis is likely invalidated. There’s no need to give the trade more room and hope for a recovery. The POC defines your “line in the sand.”
- Adjusting Risk in Different Markets: In a balanced, ranging market, the POC is typically near the center. Trades can be taken at the range extremes with the POC as a target. In a trending market, where the POC is migrating, you can use the prior session’s POC as a trailing stop to lock in profits while giving the trend room to run. If the price closes decisively below the prior day’s POC in an uptrend, it’s a signal to exit.
Using POC support and resistance for risk definition adds a layer of data-backed logic to your trade management.
Avoiding Common Mistakes When Using POC
While powerful, the POC can be misused. Here are common pitfalls to avoid:
- Using it in Isolation: Never base a trade solely on a POC level. Always seek confluence with price action, trend context, or other indicators. A POC is a point of interest, not a blind entry signal.
- Ignoring Low-Volume Nodes (LVNs): While the POC (an HVN) is important, the areas of low volume are just as critical. LVNs are areas of price rejection where the market moved quickly. Price tends to accelerate through these zones. They make excellent take-profit targets because the price is unlikely to find support or resistance there.
- Trading in Low-Liquidity Conditions: The Volume Profile and POC are less reliable in very thin or illiquid markets (e.g., during major holidays or overnight sessions for some assets). The data is most robust when participation is high.
- Static Analysis: Don’t treat yesterday’s POC as an immovable object. It’s a reference point. The market is dynamic, and you need to see how price reacts to the level in real-time to confirm its validity for the current session.
Trade with a Cutting-Edge Broker
Elevate your trading with Opofinance, an ASIC-regulated broker committed to your success. Access superior trading conditions and innovative technology designed for the modern trader.
- Advanced Trading Platforms: Choose from MT4, MT5, cTrader, and the proprietary OpoTrade platform.
- Innovative AI Tools: Leverage our AI Market Analyzer, AI Coach, and AI Support to gain a unique market edge.
- Flexible Trading Options: Explore opportunities in Social Trading and Prop Trading.
- Secure & Flexible Transactions: Enjoy safe and convenient deposits and withdrawals, including crypto payments with zero fees.
Start Trading with Opofinance Today!
Conclusion
The Point of Control is far more than a simple indicator; it is a profound lens through which to view market structure and sentiment. By shifting focus from price alone to the volume that drives it, the POC in trading offers a clear, data-driven advantage. We’ve explored what the POC is, how to use it to define potent POC support and resistance, and how to apply specific strategies for breakouts, trends, and reversals. Remember, its true power is unlocked not in isolation, but through confluence with other tools and a dynamic, multi-timeframe analysis. Integrate the POC into your trading plan not as a magic bullet, but as a logical guide to making higher-probability decisions.
References: +
Can POC be used for scalping?
Yes, scalpers can use a very short-term Volume Profile (e.g., 15-minute or 1-hour) to identify developing POCs. A common strategy is to trade bounces off the developing POC within a tight range, aiming for small, quick profits.
What does it mean if there are two POCs in one profile (bimodal)?
A bimodal Volume Profile, with two high-volume areas, indicates two distinct price regions where the market found value. This often happens after a market moves from one price range to another and consolidates. The two POCs will act as strong support/resistance, and the area between them is often a low-volume zone where price can travel quickly.
How does the POC differ from the VWAP?
The POC is the single price with the highest traded volume. The VWAP is the average price a security has traded at throughout the day, weighted by volume. While both are volume-based, the POC is a specific price level, whereas VWAP is a running average. They often act as confluence points, but they measure different things.
Is a “naked” POC a stronger signal?
A “naked” POC is a POC from a prior session that has not yet been revisited or “retested” by price. Many traders believe these levels are stronger magnets for price, as the market has “unfinished business” there. They are often key targets for future price moves.
Does POC work in cryptocurrency markets?
Absolutely. The POC in trading is extremely effective in crypto markets because they trade 24/7 and generate massive amounts of volume data. The principles of value, acceptance, and rejection are universal and apply just as well to Bitcoin or Ethereum as they do to stocks or forex.


