

The RSI and EMA cross indicator strategy is a battle-tested technical trading method that combines Exponential Moving Averages (EMAs) to define the market’s trend with the Relative Strength Index (RSI) to time high-probability entries. This isn’t just about lines crossing on a chart; it’s a systematic way to answer two of trading’s most critical questions: “Which way is the market going?” and “Is now the right time to enter?

” Many traders get caught in market “whipsaws” or enter a trend so late that the move is already over. This strategy is designed to solve those exact problems by confirming the trend first and then waiting for a momentum-based signal. This article provides a complete, practical blueprint for mastering this EMA and RSI strategy, based on real-world application and refinement. Finding a top-tier broker for forex trading is the final piece of the puzzle to execute this system effectively.
Key Takeaways
- Trend First, Entry Second: The core principle is using the EMA cross to confirm the trend’s direction before ever looking for an RSI signal. This is the non-negotiable foundation of this entire EMA and RSI strategy.
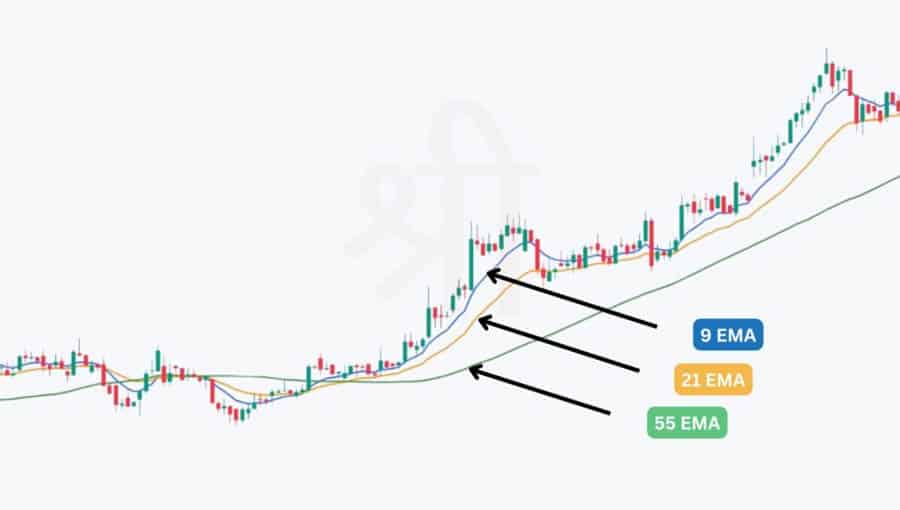
- EMAs Define the “Field”: The 9 and 21 EMAs tell you whether the bulls or bears are in control. The cross signals a power shift, and the distance between them signals the trend’s strength.
- RSI Pinpoints the “Moment”: The RSI isn’t used for simple overbought/oversold signals. It’s used to identify healthy pullbacks (to the 50-level zone) or oversold/overbought conditions within an established trend.
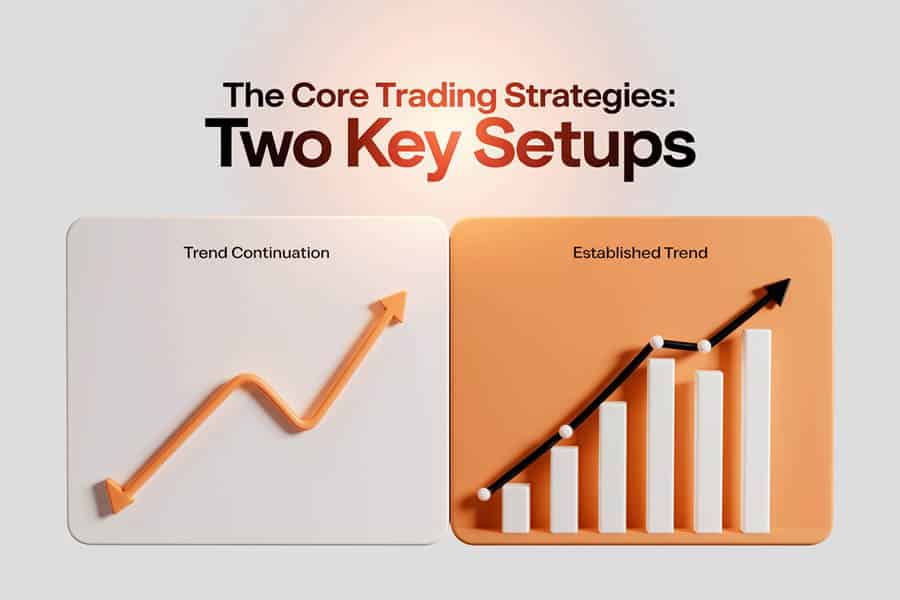
- Two Distinct Setups: The system details two specific scenarios: the “Trend Continuation Entry” (for new trends) and the “Established Trend Entry” (for mature trends), each with its own precise rules.
- Multi-Timeframe Confirmation: A key professional step is to check the trend on a higher timeframe to ensure you are not trading against a larger, more powerful market current.
- Discipline Through Checklists: A systematic, non-negotiable pre-trade checklist is crucial for preventing emotional errors and ensuring the consistent application of the RSI and EMA cross indicator.
- Avoid Choppy Markets: This is a trend-following system. Forcing it in a sideways or ranging market is the single fastest way to incur losses and frustration.
A High-Probability Indicator Strategy

In my years of trading, I’ve learned that complexity is often the enemy of profitability. The most robust systems are usually the ones built on simple, logical concepts. The beauty of the RSI and EMA cross indicator approach is its elegant logic. It stacks probabilities in your favor by ensuring you are trading with the dominant market force (the trend) and entering at a moment of temporary weakness (the pullback), just as momentum is poised to resume. It’s about understanding market psychology: the EMAs show us the ‘herd mentality’, while the RSI helps us spot moments of ‘herd exhaustion’ on pullbacks, which are often the best low-risk entry points.
Read More: What is RSI Indicator
The Power of Combining Trend & Momentum
Think of it like rowing a boat. The trend, identified by our EMAs, is the river’s current. Momentum, measured by the RSI, is how hard you are rowing. Trying to row against the current (trading against the trend) is exhausting and rarely gets you far. Waiting for the current to be strong and then rowing with it at the right moment is how you build speed and cover distance. This strategy ensures you’re always rowing with the current, making your efforts far more effective.
The EMA Cross: Defining the Trend
We use the Exponential Moving Average (EMA) because it reacts faster to recent price changes than a Simple Moving Average. When a short-term EMA (the 9-period) crosses a longer-term one (the 21-period), it’s a clear visual signal of a potential shift in underlying control. A practical tip: I always look at the angle of the cross. A sharp, steep cross suggests strong conviction and momentum behind the move. A flat, shallow cross, however, might indicate indecision and could be a warning sign of a false trend or an upcoming period of consolidation.
What the EMA Spread Tells You
Here’s a pro-tip that goes beyond the cross itself: pay attention to the distance, or “spread,” between the 9 and 21 EMAs after a cross. When the EMAs start to widen and move apart, it signifies that the trend is healthy and accelerating. Conversely, if you’re in a trend and you see the EMAs starting to converge or narrow, it’s an early warning sign that momentum is fading. This can be a signal to tighten your stop-loss or consider taking profits, even before a counter-cross occurs. This nuance is a key part of managing trades within the EMA and RSI strategy.
The RSI: Timing Your Entry
Once the EMAs have given us the green light on the trend’s direction, we use the Relative Strength Index (RSI) as our timing tool. Many traders make the mistake of blindly selling at RSI 70 and buying at RSI 30. This is a flawed approach in a strong trend. In a powerful uptrend, the RSI can stay “overbought” for a very long time.
Instead, we use it to intelligently find low-risk entry points on pullbacks. One thing to learn is the ‘character’ of the RSI on the asset you’re trading. In a very powerful bull market, for instance, the RSI might only pull back to the 55-60 level before bouncing. Recognizing this personality is an advanced skill that refines the application of the RSI and EMA cross indicator.
Setting Up Your Charts
A clean and correctly configured chart is your workspace. Let’s get the tools set up correctly. These settings are a fantastic all-around baseline, but I always encourage traders to backtest on their specific market and timeframe.
EMA Settings: The 9 & 21 EMA Cross
Add two EMAs to your chart:
- 9-period EMA (The “Fast” Line): This tracks short-term sentiment. I often color this one a bright color like electric blue.
- 21-period EMA (The “Slow” Line): This represents the medium-term trend. I usually make this a warmer color, like orange.
This 9/21 pair is a sweet spot I’ve found over time. It’s responsive enough to get you into trends early but not so sensitive that it whipsaws you in and out constantly during minor consolidation.
RSI Settings: The Standard 14-Period RSI
For the RSI, stick with the standard 14-period setting. There’s no need to over-complicate this. It’s the industry standard for a reason—it works reliably across most instruments and timeframes. Resisting the urge to endlessly tweak these settings is a mark of a disciplined trader.
Multi-Timeframe Analysis: The Pro Filter
This is a step that separates consistently profitable traders from the rest. Before taking a trade setup on your primary chart (e.g., the 4-hour), take a quick look at the timeframe above it (e.g., the Daily). Are the EMAs on the daily chart also aligned in the same direction? If you get a bullish cross on the 4-hour chart while the daily chart is in a strong downtrend, your trade is a low-probability counter-trend move. By ensuring both timeframes are aligned, you are making sure you’re trading with the “big money” flow. This single check dramatically improves the win rate of the RSI and EMA cross indicator system.
Read More: Moving Average Indicator in Forex
The Core Trading Strategies
This is the engine room of the system. I cannot stress this enough: follow these rules precisely. Every rule exists for a reason, born from testing and experience. Deviating from the plan is the number one cause of failure.
Strategy 1: The Trend Continuation Entry
This is my favorite setup. It’s designed to catch the first organized pullback after a new trend has been confirmed. It’s a high-probability trade because you are joining a newly established momentum move.
Bullish Entry Rules (Buying the Dip)
- Condition 1: The 9 EMA must cross clearly above the 21 EMA.
- Condition 2: After the cross, wait patiently for a price pullback. As price pulls back, watch for the RSI to drop into the 40-50 zone.
- Entry: Enter long (buy) at the open of the next candle after you see the RSI “hook” upwards from the 40-50 zone. A sharp, V-shaped hook is a much stronger signal than a slow, rounded turn.
- Confirmation Tip: I always look for a strong, bullish confirmation candle to close after the RSI hook. A powerful green candle shows conviction. A weak doji or spinning top might make me hesitate or wait for one more candle of confirmation.
Bearish Entry Rules (Selling the Rally)
- Condition 1: The 9 EMA must cross clearly below the 21 EMA.
- Condition 2: After the cross, wait for a relief rally. As price rallies, watch for the RSI to push up into the 50-60 zone.
- Entry: Enter short (sell) at the open of the next candle after the RSI “hooks” downwards from the 50-60 zone.
- Confirmation Tip: Look for a solid bearish candle like a bearish engulfing pattern or a shooting star. This price action confirms that sellers have rejected the higher prices and are reasserting control.
Strategy 2: The Established Trend Entry
This setup is for a trend that’s already mature and running. The EMAs are well-separated, and price is consistently respecting them. Here, the EMAs act as a dynamic zone of support or resistance.
Bullish Entry Rules (Uptrend)
- Condition 1: Price is clearly trading above both EMAs, and the EMAs are spread apart, confirming a strong uptrend.
- Condition 2: Wait for price to pull back into the “value zone” between the 9 and 21 EMAs. Simultaneously, the RSI must dip below 30 and then cross back above the 30 line.
- Entry: Enter long at the open of the next candle after the RSI crosses back above 30.
- Cautionary Note: Be wary of “catching a falling knife.” If price crashes through the EMAs aggressively and the RSI plummets to very low levels (e.g., below 20), this might be a reversal, not a pullback. A healthy pullback is orderly; a panic-driven crash is a red flag.
Bearish Entry Rules (Downtrend)
- Condition 1: Price is clearly trading below both EMAs in a confirmed downtrend.
- Condition 2: Wait for price to rally up towards the EMA value zone. The RSI must push above 70 and then cross back below the 70 line.
- Entry: Enter short at the open of the next candle after the RSI crosses back below 70. This confirms the rally’s exhaustion.
The Professional Workflow: A Trade Checklist
This isn’t just a list; it’s a ritual. I perform this check before every single trade to stay objective and disciplined. Print it out and keep it on your desk until it becomes second nature.
- Step 1: Check the Higher Timeframe. What is the dominant trend? Am I aligned with it?
- Step 2: Identify the EMA State on My Trading Chart. Is there a clear trend? Is it new (Strategy 1) or established (Strategy 2)? If it’s choppy, I close the chart. No squinting allowed.
- Step 3: Identify the RSI Signal. Am I waiting for a pullback to the 50-zone or an exit from 30/70? No signal, no trade.
- Step 4: Check Price Action Confirmation. Is there a strong confirming candlestick pattern supporting my entry?
- Step 5: Define Your Risk & Position Size. Where is my exact stop-loss? Where is my profit target? Crucially, how large is my position? My risk is always a fixed percentage (e.g., 1%) of my total account equity. This ensures no single trade can cause significant damage.
Critical Rules for Trade Management
Entries get the glory, but it’s trade management that builds an account. A great entry means nothing if you mismanage the position. This is a vital component of any successful EMA and RSI strategy.
Stop-Loss Placement: A Practical Guide
Your stop-loss is your pre-defined point of invalidation. A key lesson I’ve learned is not to place it at the *exact* swing point or EMA level. Give it a little breathing room—a few pips below the low (for a buy) or above the high (for a sell). This accounts for spreads and market “noise” and prevents you from getting wicked out of an otherwise good trade.
Setting Profit Targets & Letting Winners Run
You need an exit plan before you enter. My approach involves two steps:
- Initial Target: I identify the next major support or resistance level and set it as my first profit target. Alternatively, a fixed 1:2 risk-to-reward ratio is a solid mechanical target.
- The Art of Trailing a Stop: If the initial target is hit and the trend remains strong (EMAs widening), I often take partial profits and move my stop-loss to breakeven. Then, I trail my stop-loss just below the 21 EMA. This allows me to stay in the trade and capture a much larger move if it occurs, turning a good trade into a great one.
Read More: 20, 50 and 200 day moving average crossover
Common Mistakes & How to Avoid Them
I’ve made these mistakes, and I see countless traders fall into the same traps. Learn from our collective experience so you don’t have to.
Ignoring the EMA Cross
The cardinal sin of this system. A trader gets excited by an RSI signal and jumps in, completely ignoring that the EMAs are signaling a downtrend. The EMAs are your first, most important filter. Always respect the trend direction they provide.
Trading in a Ranging/Sideways Market
This is a trend-following strategy. Applying it in a choppy market is like trying to sail in a lake with no wind. You’ll just go in circles. Learn to identify ranging conditions (flat, intertwined EMAs) and have the professional discipline to sit on your hands and preserve your capital for clearer opportunities.
Over-Optimizing Indicator Settings
Many beginners waste months trying to find the “perfect” settings, thinking a 10/22 EMA is magically better than a 9/21. The reality is that the default settings are standard for a reason. Profitability comes from mastering the *execution* of the RSI and EMA cross indicator strategy, not from endless tweaking.
Entering Before Confirmation
Patience pays. So many traders see the RSI *approaching* the signal level and enter early out of fear of missing out (FOMO). You MUST wait for the condition to be fully met—wait for the RSI to hook, wait for the candle to close. A setup is not a setup until it is fully confirmed.
Opofinance Services
To effectively implement the RSI and EMA cross indicator strategy, your choice of broker is critical. Opofinance, an ASIC **regulated forex broker**, provides a professional-grade trading ecosystem tailored for strategy-based traders.
- Advanced Trading Platforms: Gain access to a full suite of powerful platforms including MT4, MT5, cTrader, and the user-friendly OpoTrade app. Your analysis and execution will be seamless.
- Innovative AI Tools: Leverage a true technological advantage with the AI Market Analyzer, AI Coach, and instant AI Support to refine your trading decisions.
- Social & Prop Trading: Join a network of traders with advanced Social Trading features or test your skills and trade larger capital through their Prop Trading program.
- Secure & Flexible Transactions: Fund and withdraw from your account with confidence using secure methods, including modern crypto payments. Opofinance enhances your profitability by charging zero fees on deposits and withdrawals.

Equip yourself with the tools and security necessary to trade with a professional edge.
Explore Opofinance’s Trading Platforms Today!
Conclusion: A Complete Trading System
Ultimately, the RSI and EMA cross indicator method provides a complete framework for engaging with the market. It moves you from a reactive, emotional trader to a proactive, systematic one. The synergy between the EMAs for trend and the RSI for timing in this EMA and RSI strategy creates a powerful filter against low-quality setups. No system is infallible, but I can tell you from experience that a logical plan, combined with relentless discipline and diligent backtesting, is the most reliable path toward consistency in this challenging but rewarding field. Mastering this system isn’t about learning a secret; it’s about flawlessly executing a proven edge, time and time again.
What is the best timeframe to use for the RSI and EMA cross indicator strategy?
This strategy is versatile and can be adapted to various timeframes, from 15-minute charts for day trading to 4-hour and daily charts for swing trading. The key is to remain consistent with your chosen timeframe for analysis and execution, and always use a higher timeframe for trend confirmation.
Can I use this strategy for assets other than forex, like stocks or cryptocurrencies?
Yes, absolutely. The principles of trend and momentum measured by the EMAs and RSI are universal to any market that can be charted. The strategy is effective in stocks, indices, and cryptocurrencies, though you should always backtest the specific settings and observe the RSI’s ‘character’ on your chosen asset.
What about using RSI divergence with this strategy?
RSI divergence can be a powerful addition for more advanced traders. For example, if you see a bullish EMA cross but the price makes a higher high while the RSI makes a lower high (bearish divergence), it could be a warning sign that the new trend is weak and you should be cautious or skip the trade entirely.
How can I reliably tell if the market is ranging and I should avoid this strategy?
A key visual cue is the behavior of the EMAs. In a ranging market, the 9 and 21 EMAs will appear flat and frequently intertwine, looking like tangled spaghetti. Price will chop back and forth across them with no clear direction. A trending market will show clear separation and a consistent slope in the EMAs.
Is the 9/21 EMA cross superior to other combinations like the 50/200 ‘Golden Cross’?
Neither is inherently “superior”; they serve different purposes. The 9/21 cross is for identifying short-to-intermediate term trend shifts and is ideal for the active trading strategies discussed here. The 50/200 cross (Golden/Death Cross) is a much longer-term signal used by investors to identify major, multi-month trend changes.


