

When you combine RSI and trend lines, you unlock a leading indicator for market momentum. Instead of just tracking price, you analyze the underlying strength driving it. Drawing a trend line directly on the RSI indicator reveals whether momentum is gaining or fading. A break of this line often precedes a change in the price trend, giving you a critical early warning. This guide explores exactly how to use rsi trend lines to generate powerful trading signals, manage risk effectively, and gain a tangible edge in your technical analysis, whether you are trading with a forex trading broker or in other markets.

Quick Look: Key Insights
- Predictive Power: RSI trend line breaks act as a leading indicator, frequently occurring before the price itself breaks its corresponding trend line. This gives you a head start on potential reversals.
- Momentum Blueprint: This technique provides a clear, visual map of momentum trends, allowing you to see beyond simple overbought/oversold levels and understand the market’s underlying conviction.
- Actionable Triggers: Combining divergence with an RSI trend line break provides a concrete, non-subjective entry signal for what can otherwise be a vague warning sign.
- Enhanced Confirmation: You will learn to validate these signals with price action and volume analysis, a step that dramatically increases the probability of your trades.
- Universal Framework: The principles of the RSI and trend lines strategy can be applied to any market (forex, stocks, crypto) and any timeframe, making it a truly versatile tool in your arsenal.
Fundamentals: RSI and Trend Lines Explained
Before diving into complex strategies, it’s crucial to have a rock-solid understanding of the core components. Many traders know what the RSI is and what a trend line is, but the magic happens when they are fused together on the same chart. This isn’t just another indicator; it’s a new way of seeing momentum. The combination of RSI and trend lines moves your analysis from being reactive to proactive.
What Exactly is an RSI Trend Line?
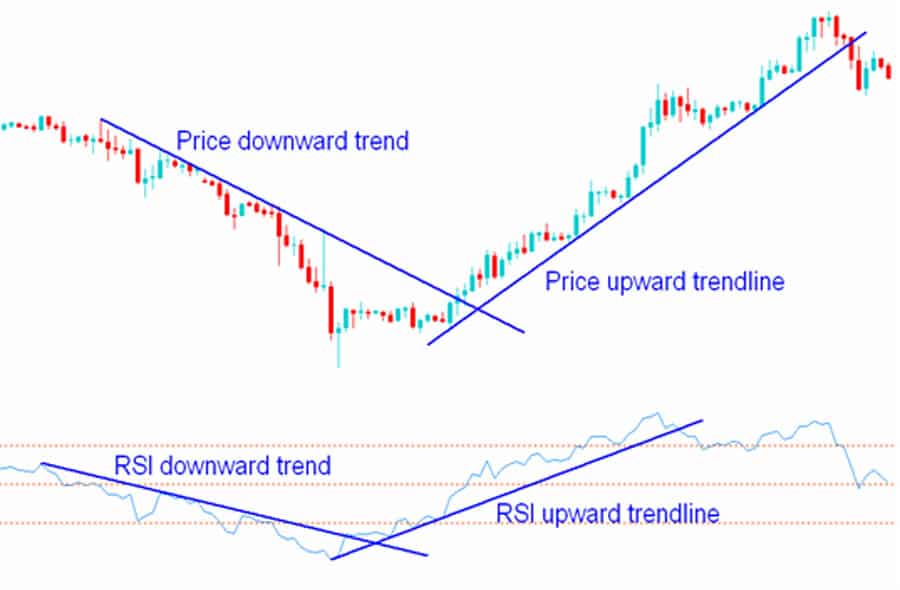
An RSI trend line is a line you draw on the RSI indicator window below your main price chart. It connects a series of descending peaks (lower highs) in a momentum downtrend or a series of ascending troughs (higher lows) in a momentum uptrend. Its function is identical to a price trend line, but its implication is far more profound. It visually represents the trend in momentum itself. From my own experience, the moment I stopped seeing the RSI as just an overbought/oversold meter and started charting its structure with trend lines, the quality of my market reads improved dramatically. You start to see the “effort” versus the “result” in the market—the RSI shows the effort (momentum), while the price shows the result.
How to Draw RSI Trend Lines with Precision
Drawing these lines correctly is a skill, and like any skill, it requires practice and a few rules. A poorly drawn line will give you false signals and erode your confidence. Here’s a practical guide on how to use rsi trend lines effectively:
- Focus on Major Pivots: Don’t try to connect every minor wiggle in the RSI. Look for the most significant, obvious turning points (peaks and troughs). These represent major shifts in momentum and will create more reliable trend lines.
- Require at Least Two Touches: A line needs at least two points. For an uptrend line, you need at least two distinct higher lows. For a downtrend line, at least two lower highs. However, a trend line with three or more touches is significantly more reliable and carries more weight when it eventually breaks.
- Mind the Angle: A trend line that is extremely steep (over 60 degrees) is often unsustainable and can break without a true reversal in momentum. Conversely, a very flat trend line shows weak momentum. The most dependable lines usually have a healthy, sustainable angle (around 30-45 degrees).
- Don’t Force It: This is the golden rule. If you have to squint or second-guess whether a line fits, it’s not a valid trend line. The best setups are the ones that jump out at you almost immediately.
Read More: Identifying Support and Resistance in Forex
The Core RSI Trend Line Breakout Strategy

The most powerful application of this concept is the RSI trend line breakout strategy. This is a reversal strategy at its heart, designed to get you into a new trend right as it’s beginning. It’s built on the premise that momentum must reverse before price can follow. This strategy is your early detection system.
Identifying a Bullish Breakout (Buy Signal)
A bullish setup occurs when the price is in a downtrend, and you’ve identified a corresponding downtrend on the RSI, marked by a trend line connecting at least two lower highs. The buy signal is triggered when the RSI decisively breaks above this descending trend line.
Practical Steps:
- Identify the Downtrend: Confirm a price downtrend (lower lows and lower highs) and draw a trend line across the corresponding lower highs on the RSI.
- Wait for the Break: Patiently watch for the RSI value to cross and, crucially, for the candle to close above the trend line. An intraday pierce that doesn’t hold is a common trap.
- Seek Confirmation: The RSI break is your alert, not your final trigger. The best trades are confirmed by price action. Look for the price to break a recent minor resistance level or form a bullish candlestick pattern (like a bullish engulfing) shortly after the RSI break. This is a vital part of a successful rsi trend line breakout strategy.
Identifying a Bearish Breakout (Sell Signal)
The bearish setup is a mirror image. The price is in an uptrend, and the RSI is forming higher lows. You draw an ascending trend line connecting these RSI troughs. The sell signal triggers when the RSI breaks below this support trend line, signaling that the bullish momentum is exhausted.
Practical Steps:
- Identify the Uptrend: Confirm a price uptrend (higher highs and higher lows) and draw a trend line connecting the corresponding higher lows on the RSI.
- Wait for the Breakdown: As with the bullish signal, wait for a candle to close after the RSI has broken below its trend line. This discipline filters out a significant number of false signals.
- Seek Confirmation: After the RSI breakdown, look for the price to break a key short-term support level or print a bearish reversal candle (like a shooting star or bearish engulfing). When both momentum and price align, your trade probability skyrockets. This confirmation step is essential for using the combination of RSI and trend lines for selling.
Read More: Trendline Scalping Strategy
The RSI Trend Line Bounce Strategy for Continuations

While breakouts are exciting, some of the most consistent profits come from trading with the trend. The RSI trend line bounce strategy is designed for just that. It helps you identify low-risk entry points within an established trend, allowing you to “buy the dip” or “sell the rally” with confidence.
In this approach, the RSI trend line acts as a dynamic level of support or resistance for momentum. When price pulls back during a trend, the RSI will also retreat to its trend line. The “bounce” is your signal that the pullback is likely over and the primary trend is ready to resume. My trading journal is filled with successful trades using this method, as it often provides a much better risk-to-reward ratio than chasing a breakout. This is a more conservative but highly effective rsi trend line strategy.
Executing the Bounce Trade
In a strong uptrend, you will have an established ascending RSI trend line. When the price has a minor correction, the RSI will fall towards this line.
- The Entry Signal: The entry is triggered when the RSI touches its trend line and then starts to turn back up. You don’t need to wait for a full candle close here, but you do want to see a decisive “rejection” from the line.
- The Ultimate Confirmation: A high-probability setup occurs when the RSI bounces off its trend line at the exact same time the price is testing a significant support level on the price chart. This could be a horizontal support level, a key moving average (like the 50 EMA), or a Fibonacci retracement level. This “confluence” of signals is what professional traders look for.
The same logic applies in reverse for a downtrend, where you’d look for the RSI to bounce off a descending resistance trend line as an opportunity to enter a short position.
Confirmation is Key: Integrating Volume and Price Action
A signal from the RSI and trend lines is powerful, but it’s never foolproof. A mistake I made frequently early in my career was trading these signals in a vacuum. True mastery comes from learning to confirm these momentum signals with other data points, primarily price action and volume. Confirmation turns a good setup into a great one.
Using Volume to Validate Breakouts
Volume measures the conviction behind a price move. It’s the fuel in the market’s engine. When you get an RSI trend line breakout, you must immediately check the volume.
- For a Bullish Breakout: You want to see a noticeable increase in volume on the price candle that corresponds with the RSI breakout. High volume confirms that there is real buying pressure and conviction behind the momentum shift. An RSI breakout on low or declining volume is a major red flag and should be viewed with extreme suspicion.
- For a Bearish Breakdown: Similarly, a breakdown of the RSI’s support trend line should ideally be accompanied by a spike in selling volume. This tells you that sellers are stepping in aggressively, validating the signal that bullish momentum has failed.
Reading Candlesticks for Entry Timing
Candlestick patterns are the language of price action. They show the story of the battle between buyers and sellers within a specific period. After an RSI signal, look for a confirming candlestick pattern to time your entry perfectly.
- After a Bullish RSI Breakout: Look for a strong bullish candle like a Bullish Engulfing, a Hammer, or a Morning Star pattern to form on the price chart. This provides immediate confirmation that buyers have taken control of the price.
- After a Bearish RSI Breakdown: Look for a bearish pattern like a Bearish Engulfing, a Shooting Star, or an Evening Star. Entering after one of these patterns appears, rather than just on the RSI signal alone, can significantly improve your entry price and timing.
Read More: What is RSI Indicator
Advanced Use: Divergence and Trend Line Breaks
This is where the analysis of RSI and trend lines becomes truly surgical. RSI divergence is a famous reversal signal, but it often lacks a precise entry trigger. By combining it with an RSI trend line break, you create a complete, actionable trading system.
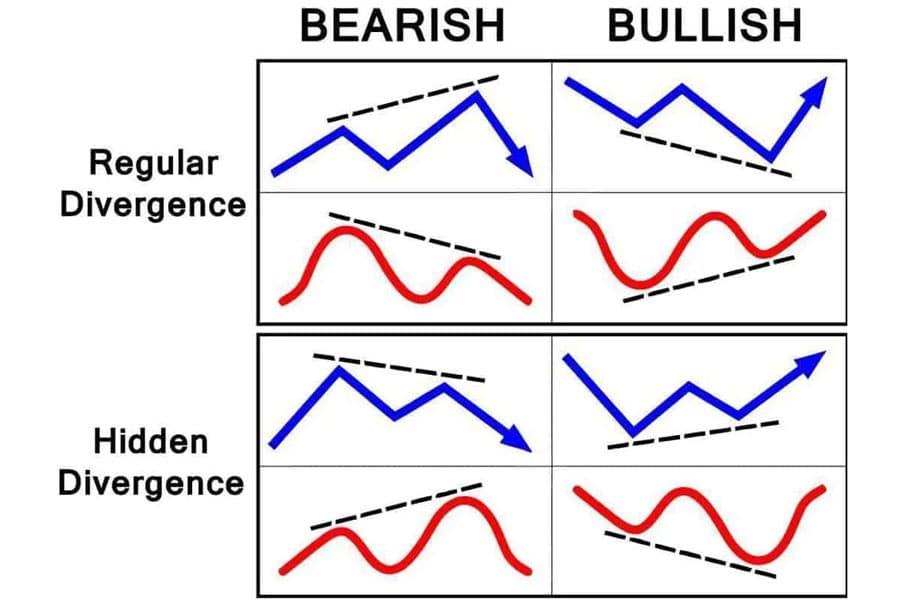
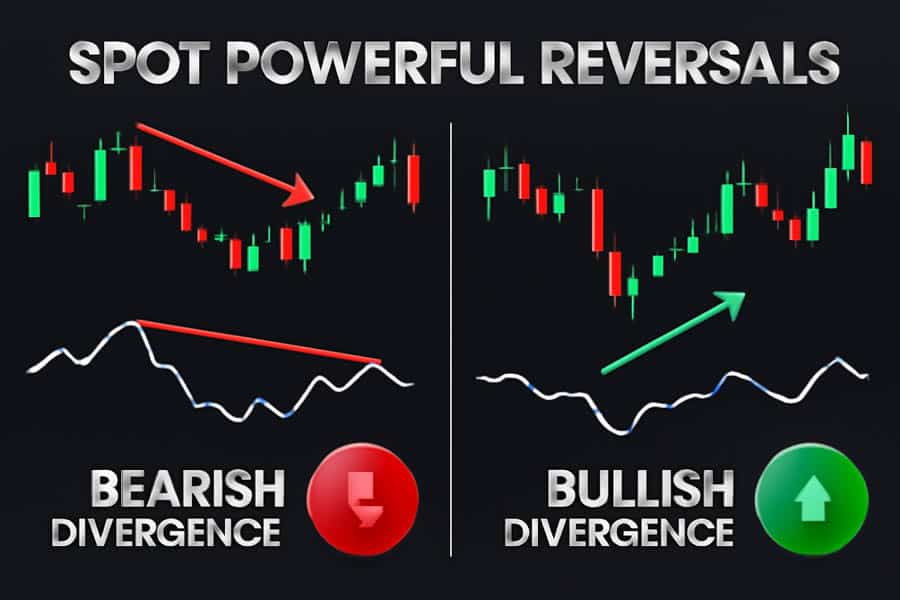
A divergence signals a disagreement between price and momentum. A bullish divergence (price makes a lower low, but RSI makes a higher low) warns that the downtrend is losing power. A bearish divergence (price makes a higher high, but RSI makes a lower high) warns that the uptrend is running out of steam.
The problem? A divergence can build for a long time before the price actually reverses. How do you know when to act? This is where the RSI trend line comes in.
- Triggering a Bearish Divergence Trade: You spot a bearish divergence. Instead of shorting immediately, you draw a mini trend line connecting the most recent RSI troughs (the higher lows). The moment the RSI breaks decisively below this short-term support trend line is your trigger. You have now confirmed that the weakening momentum has officially transitioned into a new bearish momentum thrust.
- Triggering a Bullish Divergence Trade: You spot a bullish divergence. You then draw a trend line across the recent RSI peaks (the lower highs). Your entry signal is the moment the RSI breaks above this resistance line, confirming the momentum has shifted from bearish to bullish. This is a highly effective way of using an rsi trend line strategy to confirm one of the most powerful signals in technical analysis.
Opofinance Services
To effectively implement advanced strategies involving RSI and trend lines, your choice of broker is critical. Opofinance, an ASIC-regulated broker, provides a robust and technologically advanced environment tailored for serious traders who demand precision and reliability.
- Advanced Trading Platforms: Access the market through a suite of industry-leading platforms, including the popular MetaTrader 4 and MetaTrader 5, the sophisticated cTrader, and the proprietary OpoTrade platform.
- Innovative AI Tools: Gain a unique competitive edge with cutting-edge artificial intelligence. Utilize the AI Market Analyzer for deep insights, the AI Coach to refine your trading strategies, and AI Support for immediate, intelligent assistance.
- Social & Prop Trading: Engage with a global community through dynamic social trading features or explore proprietary trading opportunities to leverage your skills with institutional capital, a path for dedicated traders to accelerate their growth.
- Secure & Flexible Transactions: Trade with confidence thanks to secure, segregated client funds and convenient deposit and withdrawal methods. Opofinance embraces modern finance by including crypto payments and ensures your transactions are seamless with zero fees charged from their side.

Explore Opofinance’s Advanced Trading Tools
Final Thoughts on Mastering RSI and Trend Lines
Ultimately, learning how to use rsi trend lines is about more than just drawing lines on a chart. It’s about learning to read the market’s underlying story of strength and weakness. The fusion of RSI and trend lines provides a leading view into momentum shifts, giving you a distinct advantage. From the core rsi trend line breakout strategy to advanced divergence confirmation, this technique provides a clear, repeatable framework for identifying high-probability trading opportunities. But remember, no tool works in isolation. The most successful traders combine these signals with rigorous confirmation, disciplined risk management, and a constant dedication to learning.
What is the most common mistake when using an RSI trend line strategy?
The most common mistake is acting on an RSI trend line break without waiting for confirmation from price action. The RSI signal is a leading one, meaning it should alert you to a potential trade, not be the sole reason for entry. Always wait for a confirming candle or a break of a price structure.
How does the RSI period setting affect the trend lines?
A shorter RSI period (e.g., 7 or 9) will result in a more volatile RSI line, leading to more frequent but potentially less reliable trend line breaks. A longer period (e.g., 21 or 25) will smooth the RSI, creating fewer but more significant trend lines. The standard 14 is a balanced starting point.
Can I use the RSI trend line breakout strategy in a ranging market?
It’s not recommended. This strategy is designed for trending or reversing markets. In a sideways or ranging market, the RSI tends to oscillate between 40 and 60 without forming clear trends, making it very difficult to draw meaningful trend lines and leading to many false signals.
What if the RSI breaks its trend line but the price doesn’t follow?
This is a “failed signal” and is valuable information. It indicates that while momentum shifted briefly, the price structure was too strong to be reversed. This often means the existing trend is very strong and may continue. No signal has a 100% success rate, which is why risk management is crucial.
Should I redraw my RSI trend line after it is broken?
Yes, absolutely. Once a trend line is decisively broken, it is no longer valid. You should then wait for the RSI to form new pivot points to draw the next potential trend line that reflects the new market momentum conditions.


