Are you tired of guessing when to buy or sell? Do you crave a clearer picture of market momentum, a secret weapon to anticipate price swings before they happen? Imagine having a tool that whispers potential turning points, helping you navigate the complexities of trading with greater confidence. This isn’t just a dream; it’s the reality offered by the Relative Strength Index (RSI) indicator. This comprehensive guide will demystify what is RSI indicator in trading, providing you with an in-depth understanding of its mechanics, interpretation, and strategic application across diverse markets. Whether you’re navigating the volatile world of forex, where selecting the right forex trading broker is paramount, or analyzing stock charts, mastering the RSI can significantly enhance your trading prowess. We’ll explore what is RSI indicator in the stock market, delve into what is RSI indicator in technical analysis, and equip you with the knowledge to confidently integrate this powerful tool into your trading arsenal.

Intro to RSI: Spotting Momentum
The RSI indicator serves as an invaluable guide, helping traders decipher the often-complex language of market movements. Think of it as a specialized lens, focusing on the velocity and magnitude of price changes. It’s a momentum oscillator, meaning it quantifies the speed at which prices are rising or falling.
Definition and Purpose of the RSI Indicator: At its core, the RSI indicator, or Relative Strength Index, is a momentum indicator employed in technical analysis. Its primary function is to gauge the magnitude of recent price fluctuations to determine if a stock or other asset is potentially overbought or oversold. By identifying these conditions, the RSI aims to signal potential shifts in the prevailing trend. It helps traders anticipate when a price might be poised for a reversal, offering a crucial edge in timing entries and exits.
Who Developed It and When: The brainchild of J. Welles Wilder Jr., a highly respected figure in technical analysis, the RSI indicator was first introduced to the trading world in his groundbreaking 1978 book, “New Concepts in Technical Trading Systems.” Wilder’s innovative work laid the groundwork for numerous technical indicators that remain fundamental tools for traders today. His insights into market dynamics continue to influence how traders analyze price action.
Read More: Most Effective Forex Trading Indicators
How RSI Indicator Works: Unveiling the Calculation
To effectively utilize the RSI indicator, understanding its underlying mechanics is crucial. It’s more than just a number on a chart; it represents a calculated assessment of buying and selling pressure.
Explanation of the RSI Formula: While the RSI formula might initially appear complex, the fundamental principle behind it is quite intuitive. It compares the average gains during periods when the price went up with the average losses during periods when the price went down, over a specified look-back period. The standard period is 14, but traders can adjust this based on their trading style and the asset being analyzed.
The precise RSI formula is:
RSI = 100 – [100 / (1 + RS)]
Where:
- RS (Relative Strength) = Average Gain of Up Periods / Average Loss of Down Periods
It’s important to remember that your trading platform will automatically perform this calculation for you. The key takeaway is that the RSI essentially represents the ratio of upward price movement to downward price movement within the chosen timeframe. A higher ratio indicates stronger upward momentum, while a lower ratio suggests stronger downward momentum.
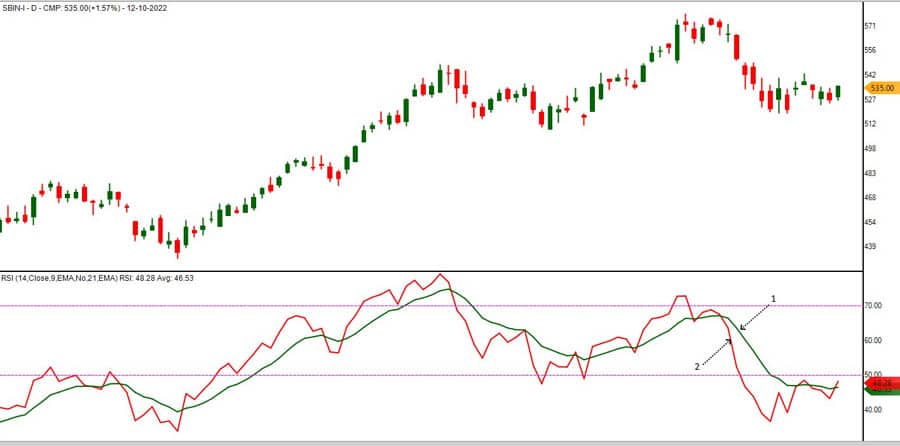
Understanding Overbought and Oversold Levels: The RSI indicator oscillates within a bounded range, from 0 to 100. The most commonly recognized and utilized thresholds are 30 and 70. These levels serve as critical benchmarks for identifying potential turning points in the market.
- Overbought (Above 70): When the RSI indicator climbs above the 70 level, it suggests that the asset has experienced significant buying pressure and might be overvalued in the short term. This doesn’t automatically mean the price will immediately plummet, but it signals a heightened probability of a pullback, consolidation, or even a trend reversal. Think of it like stretching an elastic band too far – it becomes increasingly likely to snap back. Sellers might start to see this as an opportune time to take profits, potentially leading to a decrease in price.
- Oversold (Below 30): Conversely, when the RSI indicator drops below the 30 level, it indicates that the asset has faced substantial selling pressure and might be undervalued. Similar to the overbought condition, this doesn’t guarantee an immediate price surge. However, it suggests a potential for a bounce, recovery, or even a trend reversal to the upside. Buyers might view this as an attractive entry point, potentially leading to increased demand and a subsequent price increase.
Pro Tip: While the 30 and 70 levels are widely accepted as standard, experienced traders often fine-tune these thresholds based on the specific characteristics of the asset they are trading and the prevailing market conditions. For instance, in a market exhibiting a strong and persistent uptrend, you might consider adjusting the overbought level to 80 and the oversold level to 20 to better align with the prevailing momentum. This helps to avoid premature selling or buying signals in strongly trending environments.
Reading RSI: Interpreting the Signals
The RSI indicator offers more than just simple overbought and oversold signals. Learning to interpret the nuances of its movements and its relationship with price action can significantly enhance the accuracy of your trading decisions.
How to Read RSI Signals: Beyond simply observing whether the RSI is above 70 or below 30, pay close attention to the direction of the RSI line itself and how it interacts with the price chart.
- Rising RSI: A consistently rising RSI indicator generally confirms the presence of an upward price trend. This indicates increasing buying pressure as more participants are willing to buy the asset, driving the price higher. It suggests that the bullish momentum is strong and likely to continue.
- Falling RSI: Conversely, a consistently falling RSI indicator typically confirms a downward price trend. This suggests increasing selling pressure as more participants are looking to sell the asset, pushing the price lower. It indicates that the bearish momentum is strong and likely to persist.
- Crossing the Centerline (50): Many traders consider the 50 level as a crucial demarcation point. A move by the RSI indicator above 50 is often interpreted as a bullish signal, suggesting that gains are outpacing losses and that positive momentum is building. Conversely, a move below 50 can be seen as a bearish signal, indicating that losses are exceeding gains and that negative momentum is gaining strength. This centerline crossover can provide valuable insights into the shifting balance of power between buyers and sellers.
Common RSI Thresholds (e.g., 30 and 70): As previously discussed, the 30 and 70 levels are the primary thresholds to monitor for potential reversals. However, it’s absolutely essential to remember that these are not infallible signals. An asset’s price can remain in overbought or oversold territory for extended periods, particularly in markets characterized by strong and sustained trends. Treat these levels as potential warning signs rather than definitive buy or sell triggers. Confirmation from other indicators or price action analysis is often recommended before acting solely on these signals.
Read More: bollinger bands and rsi strategy
RSI in Trading: Practical Strategies

The true power of the RSI indicator lies in its practical application within various trading strategies. Its versatility allows traders to utilize it in multiple ways to identify potential trading opportunities and refine their decision-making process.
Using RSI for Buy and Sell Signals:
- Buy Signal: A potential buy signal can emerge when the RSI indicator dips below the 30 level (oversold), suggesting the asset may be undervalued, and then subsequently crosses back above the 30 level. This upward crossover from oversold territory can indicate that the selling pressure is likely diminishing, and a potential price increase is on the horizon as buyers begin to step in.
- Sell Signal: Conversely, a potential sell signal can arise when the RSI indicator rises above the 70 level (overbought), suggesting the asset may be overvalued, and then subsequently crosses back below the 70 level. This downward crossover from overbought territory can indicate that the buying pressure is likely weakening, and a potential price decrease is possible as sellers begin to take control.
Divergence and Convergence Concepts: Divergence is a particularly powerful signal that can often foreshadow potential trend reversals with a higher degree of accuracy. Recognizing these patterns can provide traders with a significant advantage.
- Bullish Divergence: Bullish divergence occurs when the price of an asset is making lower lows, indicating continued selling pressure, but simultaneously, the RSI indicator is making higher lows. This discrepancy suggests that while the price is still declining, the selling momentum is actually weakening. This divergence can be an early warning sign of a potential upward reversal, as the underlying strength of the selling pressure is diminishing.
- Bearish Divergence: Bearish divergence, on the other hand, occurs when the price of an asset is making higher highs, suggesting continued buying pressure, but the RSI indicator is making lower highs. This divergence indicates that despite the price continuing to rise, the buying momentum is actually weakening. This can be an early indication of a potential downward reversal, as the underlying strength of the buying pressure is waning.
Convergence, in contrast to divergence, acts as a confirmation of the prevailing trend. If the price is making higher highs and the RSI indicator is also making higher highs, it strengthens the bullish outlook, suggesting that the upward trend is likely to continue. Similarly, if the price is making lower lows and the RSI is also making lower lows, it reinforces the bearish outlook.
RSI Across Markets: Adapting Your Approach

The RSI indicator is not confined to a single market; its adaptability makes it a valuable tool for traders across various asset classes.
Application in Stock Market, Forex, and Crypto:
- Stock Market: In the stock market, the RSI indicator is widely utilized to pinpoint potential entry and exit points for individual stocks. It helps traders capitalize on both short-term price fluctuations and identify potential shifts in longer-term trends. By identifying overbought or oversold conditions, traders can make more informed decisions about when to buy or sell stocks.
- Forex: Within the dynamic and fast-paced realm of forex trading, the RSI indicator proves to be an invaluable asset for identifying potential reversals in currency pairs. The ability to anticipate these turning points can be crucial for maximizing profits and minimizing losses in the highly leveraged forex market. Selecting a reputable and reliable broker for forex is also a critical factor for successful trading.
- Crypto: Given the inherent volatility of cryptocurrencies, the RSI indicator is particularly useful for identifying potentially overextended price movements. The extreme price swings often seen in the crypto market can lead to pronounced overbought and oversold conditions, making the RSI a valuable tool for gauging potential reversals.
Differences in Usage Across Markets: While the fundamental principles of the RSI indicator remain consistent across different markets, some adjustments to its application might be necessary depending on the specific characteristics of the asset being traded. For instance, in markets known for their high volatility, such as the cryptocurrency market, traders might consider employing wider overbought and oversold ranges, such as 80 and 20, to filter out some of the inherent noise and reduce the likelihood of acting on false signals. Understanding the typical volatility of a market is key to effectively utilizing the RSI.
Read More: divergence in trading
RSI Advantages: Why Traders Rely on It
The enduring popularity of the RSI indicator among traders stems from its numerous advantages and its proven track record in helping to improve trading outcomes.
Benefits of Using RSI in Technical Analysis:
- Identifies Potential Reversals: One of the primary strengths of the RSI indicator is its ability to highlight potential trend reversals by identifying overbought and oversold conditions. This allows traders to anticipate potential shifts in price direction and position themselves accordingly.
- Confirms Trends: Beyond identifying reversals, the RSI indicator can also be used to confirm the strength of an existing trend. A consistently rising RSI above 50, for example, can reinforce the bullish outlook of an upward trend.
- Generates Divergence Signals: The ability of the RSI to generate divergence signals is a significant advantage. These patterns can provide early warnings of potential trend changes that might not be immediately apparent from price action alone, offering traders a valuable head start.
- Versatile Application: The RSI indicator is remarkably versatile and can be applied across a wide range of markets, from stocks and forex to commodities and cryptocurrencies. It can also be used effectively across different trading timeframes, from short-term day trading to long-term investing.
Simplicity and Effectiveness: Despite the mathematical calculations involved in its construction, the RSI indicator is relatively straightforward to understand and interpret, making it accessible to traders with varying levels of experience. Its effectiveness in identifying potential trading opportunities has been demonstrated over many years, contributing to its widespread adoption within the trading community.
RSI Limitations: Knowing the Downsides
While the RSI indicator offers numerous benefits, it’s crucial to acknowledge its limitations. No single indicator is perfect, and understanding the potential drawbacks of the RSI is essential for avoiding potential pitfalls and using it effectively.
Potential Drawbacks and False Signals:
- Whipsaws: In market conditions characterized by choppy or sideways price action, the RSI indicator can generate frequent overbought and oversold signals that do not result in actual price reversals. These “whipsaws” can lead to premature entries or exits, potentially resulting in losses if traders act solely on these signals without further confirmation.
- Lagging Indicator: Like all momentum indicators, the RSI indicator is inherently a lagging indicator. This means that it confirms price action that has already occurred rather than predicting future price movements. Consequently, it may not always provide the most timely signals for entering or exiting trades, particularly at the very beginning or end of a trend.
- Not a Standalone Tool: Relying solely on the RSI indicator for making trading decisions is generally considered a risky approach. It’s most effective when used in conjunction with other technical analysis tools, such as trendlines, chart patterns, and other indicators, as well as fundamental analysis, to provide a more comprehensive view of the market.
Situations Where RSI May Not Be Effective: The RSI indicator may be less effective in markets exhibiting strong and sustained trends. In such scenarios, prices can remain in overbought or oversold territory for extended periods without a significant reversal. In these situations, waiting for confirmation from other indicators or observing price action for signs of a genuine reversal is particularly important to avoid being prematurely stopped out of a profitable trade.
Combining RSI with Other Indicators
To mitigate the inherent limitations of the RSI indicator and enhance the robustness of trading strategies, many traders combine it with other technical indicators. This synergistic approach can lead to more reliable signals and improved trading outcomes.
Combining RSI with Moving Averages, MACD, etc.:
- Moving Averages: Incorporating moving averages into your analysis can help to identify the prevailing trend. For example, if the price is trading consistently above its 200-day moving average, indicating a long-term uptrend, you might give more weight to oversold RSI signals as potential buying opportunities within the context of the larger trend.
- MACD (Moving Average Convergence Divergence): The MACD is another popular momentum indicator that can effectively complement the RSI indicator. Looking for confluence, or agreement, between signals from both indicators can significantly increase the probability of a successful trade. For instance, if the RSI is showing bullish divergence, suggesting a potential upward reversal, and the MACD is simultaneously poised to cross above its signal line, it strengthens the buy signal and provides greater confidence in the potential trade.
Enhancing Trading Strategies with Multiple Indicators: The key to effectively combining indicators is to select tools that complement each other and address each other’s weaknesses. For example, using a trend-following indicator like moving averages alongside the RSI indicator, which is an oscillator, can help to filter out false signals that might occur in ranging or sideways markets. By using a combination of indicators, traders can gain a more holistic and nuanced understanding of market dynamics, leading to more informed and potentially more profitable trading decisions.
Opofinance Services: Empowering Your Trading Journey
Are you seeking a trustworthy and regulated online forex broker to implement your trading strategies, perhaps even those incorporating the powerful RSI indicator? Consider Opofinance, a reputable ASIC-regulated broker dedicated to providing a secure and efficient trading environment for its clients.

- ASIC Regulated: Trade with the assurance that Opofinance adheres to the rigorous regulatory standards set forth by the Australian Securities and Investments Commission (ASIC), a leading financial regulator.
- Featured on MT5 Brokers List: Gain access to the widely acclaimed MetaTrader 5 platform, a favorite among both novice and experienced traders globally, where Opofinance is officially recognized and listed.
- Safe and Convenient Deposits and Withdrawals: Enjoy a seamless trading experience with a variety of secure and user-friendly deposit and withdrawal methods, ensuring the safety and accessibility of your funds.
- Social Trading: Leverage the knowledge and experience of seasoned traders through Opofinance’s social trading features. This can be a valuable learning tool, allowing you to observe how others utilize technical indicators like the RSI in live trading scenarios, and potentially even mirror their trades.
Ready to take your trading to the next level? Visit opofinance.com today to explore their offerings and embark on your trading journey with a trusted partner.
Conclusion: Mastering RSI for Trading Success
The RSI indicator stands as a powerful and versatile tool in the toolkit of any trader. By diligently understanding its underlying principles, mastering its interpretation, and acknowledging its limitations, you can significantly enhance your ability to identify potential trading opportunities and make more informed trading decisions. Remember that the RSI is most effective when integrated with other forms of analysis and a robust risk management framework. Embrace continuous learning, consistent practice, and a disciplined approach, and you’ll be well-equipped to harness the power of the RSI and achieve your trading objectives.
Key Takeaways: Essential RSI Insights
- The RSI indicator measures the velocity and magnitude of price movements, oscillating within a range of 0 to 100.
- Readings above the 70 threshold typically suggest overbought conditions, while readings below the 30 threshold indicate oversold conditions.
- Divergence between price action and the RSI indicator can serve as a potent signal of potential trend reversals.
- The RSI indicator is adaptable and can be effectively applied across various financial markets, including stocks, forex, and cryptocurrencies.
- Combining the RSI indicator with other technical analysis tools, such as moving averages and the MACD, can improve the accuracy and reliability of trading signals.
- It’s crucial to be aware of the limitations of the RSI indicator, such as the potential for false signals in ranging markets, to avoid making suboptimal trading decisions.
Q1: Can the RSI indicator be used on all timeframes?
Yes, the RSI indicator can be applied to any timeframe, from intraday charts like 1-minute or 5-minute charts to longer-term charts like daily or weekly charts. However, the interpretation of the signals might vary slightly depending on the timeframe. Shorter timeframes might generate more frequent signals, while longer timeframes tend to produce more significant and reliable signals.
How can I adjust the RSI settings for different assets?
While the default setting of 14 periods is widely used, you can adjust the look-back period of the RSI indicator to suit the specific characteristics of the asset you are trading. For more volatile assets, a shorter period might be more responsive to price changes, while for less volatile assets, a longer period might provide smoother and more reliable signals. Experimentation and backtesting can help you determine the optimal settings for different assets.
Is RSI a leading or lagging indicator?
The RSI indicator is generally considered a lagging indicator because it confirms price action that has already occurred. However, the divergence signals generated by the RSI can sometimes provide early warnings of potential trend reversals, giving it a slightly leading characteristic in those specific instances.


