

The stochastic and macd strategy is a powerful trading method that combines two popular technical indicators to generate more reliable buy and sell signals. It works by using the MACD to identify the overall trend direction and momentum, while the Stochastic Oscillator pinpoints potential reversal points by identifying overbought or oversold conditions. By requiring a confirmation from both tools, traders can filter out false signals and improve their entry timing. This article will explore everything from the basic crossover approach to advanced techniques, helping you master this dynamic duo with the help of a trusted online forex broker.

Key Takeaways
- Dual Confirmation: The core strength of the strategy is using MACD for trend and momentum, and the Stochastic for overbought/oversold entry triggers. This reduces false signals.
- Versatility: This strategy can be adapted for trending, ranging, and counter-trend market conditions across various timeframes and assets like forex, stocks, and commodities.
- Clear Entry/Exit Signals: The combination provides distinct crossover signals for entering and exiting trades, removing much of the guesswork.
- Risk Management is Crucial: Like any strategy, it is not foolproof. Success depends heavily on proper risk management, including setting stop-losses and appropriate position sizing.
- Customization is Key: While standard settings work, experienced traders often tweak indicator parameters to better suit their specific trading style and the volatility of the asset being traded.
Stochastic Oscillator: Key Concepts & Signals
The Stochastic Oscillator is a momentum indicator that compares a particular closing price of an asset to its price range over a specific period. Developed by George C. Lane in the 1950s, its primary purpose isn’t to follow the trend, but to gauge the speed or momentum of price. It operates on the principle that as a price trends upward, the closing prices will tend to cluster near the high of the recent range. Conversely, in a downtrend, closing prices tend to be near the low. The indicator oscillates between 0 and 100, providing clear visual cues about market conditions.
Stochastic Definition and Calculation
The Stochastic Oscillator is a momentum indicator that compares a security’s closing price to its price range over a specified period. It consists of two lines:
- %K line (the fast/main line)
- %D line (the signal/smoothed line)
%K Line Formula
%K=(HN−LN)(C−LN)×100
Where:
- CC = Most recent closing price
- LNLN = Lowest low over the past N periods
- HNHN = Highest high over the past N periods
- NN = Number of periods (commonly 14)
%D Line Formula
The %D line is a simple moving average (SMA) of the %K line, typically calculated over 3 periods:
%D=SMA3(%K)
This means %D is the 3-period simple moving average of the %K values. The %D line acts as a signal line, smoothing out the %K line and helping to identify potential buy or sell signals.
How to Interpret the Stochastic Oscillator
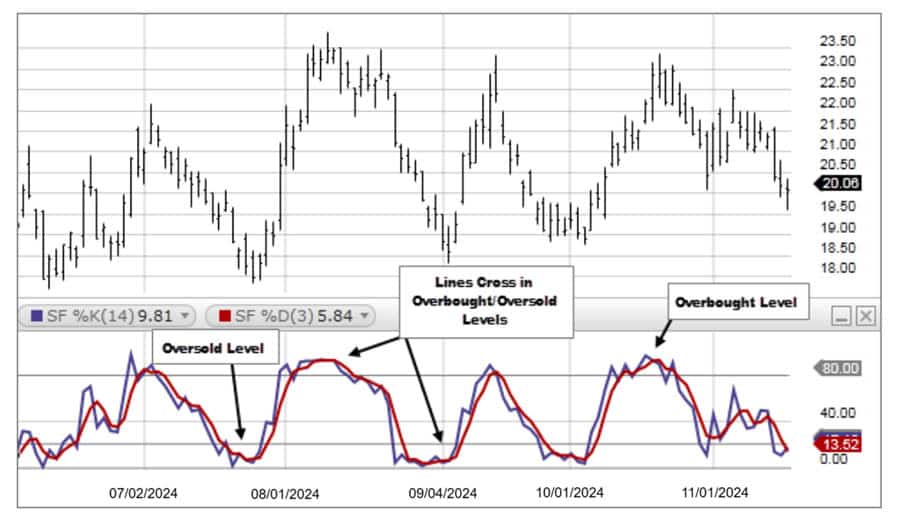
- Overbought and Oversold Levels: The most common interpretation involves the 80 and 20 levels. A reading above 80 suggests the asset is “overbought” and may be due for a pullback. A reading below 20 suggests it is “oversold” and could be poised for a rebound.
- Crossovers: A buy signal is often generated when the faster %K line crosses above the slower %D line, especially when this occurs in the oversold region (below 20). A sell signal is generated when the %K line crosses below the %D line, particularly in the overbought region (above 80).
- Divergence: Bullish divergence occurs when the price makes a new lower low, but the Stochastic forms a higher low. This indicates weakening downward momentum and a potential upside reversal. Bearish divergence happens when the price prints a higher high, but the Stochastic makes a lower high, signaling a potential move down.
Read More: Stochastic oscillator for scalping
MACD Indicator: Trend and Momentum Insights

The Moving Average Convergence Divergence (MACD), developed by Gerald Appel, is one of the most versatile and widely used technical indicators. It’s a trend-following momentum indicator that shows the relationship between two exponential moving averages (EMAs) of an asset’s price. Unlike the Stochastic, the MACD is unbounded, meaning it doesn’t oscillate within a fixed range like 0-100. Its strength lies in its ability to highlight both the direction and the strength of a market trend.
MACD Definition and Calculation
The MACD has three main components:
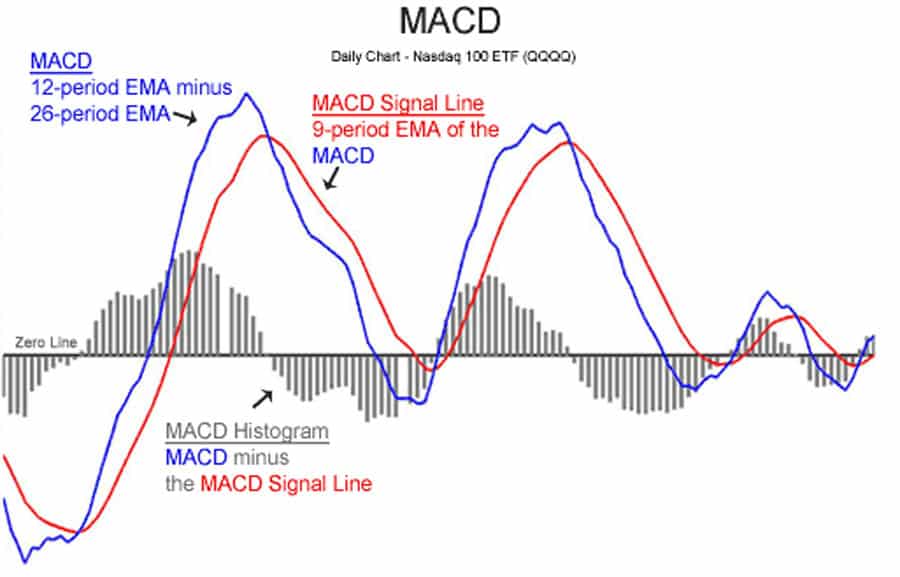
- The MACD Line: This is calculated by subtracting the 26-period EMA from the 12-period EMA. $$ MACD \ Line = 12-period \ EMA – 26-period \ EMA $$
- The Signal Line: This is a 9-period EMA of the MACD Line itself. It is plotted on top of the MACD line and serves as a trigger for buy and sell signals.
- The Histogram: This represents the difference between the MACD Line and the Signal Line. The histogram gives a visual representation of the momentum. When the histogram is above the zero line and growing, bullish momentum is increasing. When it’s below zero and falling, bearish momentum is building.
How to Interpret the MACD
- Crossovers: The most common signal is the crossover. A bullish crossover occurs when the MACD Line crosses above the Signal Line, suggesting a potential buying opportunity. A bearish crossover happens when the MACD Line crosses below the Signal Line, indicating a potential selling opportunity.
- Zero Line Crossover: When the MACD Line crosses above the zero line, it signifies that the 12-period EMA has crossed above the 26-period EMA, a general confirmation of an uptrend. Conversely, a cross below the zero line suggests a downtrend.
- Divergence: Similar to the Stochastic, divergence is a powerful signal. Bullish divergence occurs when price makes a lower low, but the MACD forms a higher low, signaling a potential trend reversal to the upside. Bearish divergence is the opposite.
Read More: MACD Indicator in Forex Trading
Why Combine Stochastic and MACD?
Combining the Stochastic Oscillator and the MACD into a single stochastic and macd strategy is a classic technique for a reason: they complement each other exceptionally well. While each indicator is useful on its own, they have inherent weaknesses that the other can help mitigate. Using them together creates a system of checks and balances, leading to a more robust trading approach. The MACD acts as the trend and momentum filter, while the Stochastic acts as the precise entry trigger.
The logic is to first use the MACD to determine the dominant market direction. For example, if you’re looking for a buy signal, you’d ideally want the MACD to show bullish momentum (e.g., being above the zero line or having a recent bullish crossover). Once the broader trend is confirmed, you then turn to the Stochastic Oscillator to time your entry. You would wait for the Stochastic to signal an oversold condition and a bullish crossover, confirming that a short-term dip is likely ending and the price is ready to resume its upward journey. This double confirmation is the heart of the stochastic and macd trading strategy.
Stochastic vs. MACD vs. Combined Strategy
| Feature | Stochastic Oscillator | MACD Indicator | Combined Stochastic and MACD Strategy |
|---|---|---|---|
| Primary Function | Measures price momentum and identifies overbought/oversold levels. | Identifies trend direction and momentum. | Uses MACD to filter trend and Stochastic to time entries. |
| Indicator Type | Leading Oscillator (Bounded: 0-100) | Lagging/Trend-Following (Unbounded) | A hybrid system combining leading and lagging elements. |
| Best For | Identifying turning points in ranging markets. | Confirming the strength and direction of trends. | Filtering false signals and improving entry/exit accuracy in most market conditions. |
| Common Weakness | Can give many false signals in strong trending markets. | Lags behind price, which can lead to late entries. | Can still be prone to whipsaws in very low-volatility or choppy markets. Signals might be less frequent. |
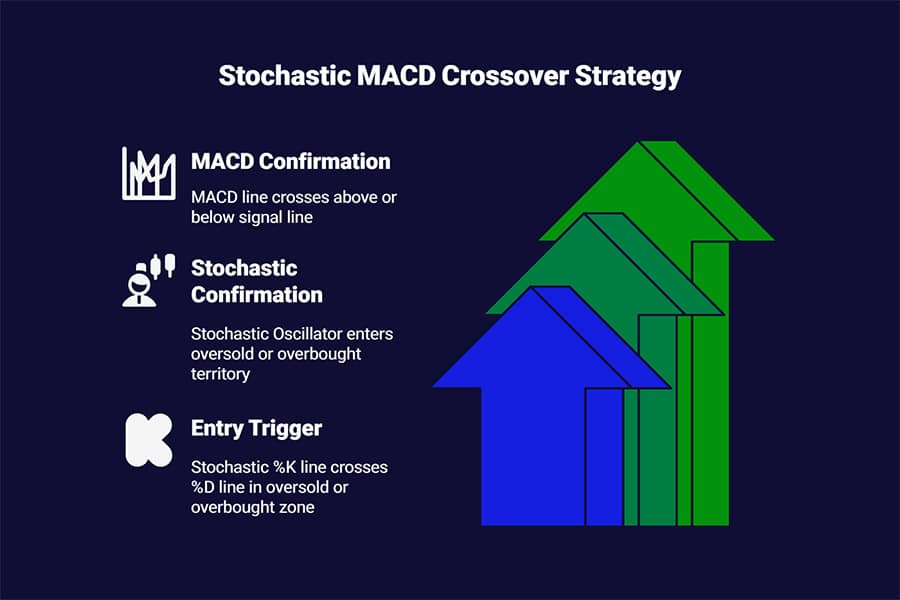
Stochastic MACD Crossover Strategy: Step-by-Step
The most straightforward application of this powerful combination is the stochastic macd crossover strategy. This approach provides clear, rule-based signals for entering and exiting trades. The goal is to wait for both indicators to align in the same direction before committing to a position. From my experience, sticking to the rules rigidly is what separates profitable execution from frustrating losses.
Best Settings for Stochastic and MACD
While settings can be adjusted, the standard parameters are a great starting point and are widely used for a reason. They provide a good balance between responsiveness and signal reliability.
- Stochastic Oscillator: The most common setting is (14, 3, 3). This means the %K line uses a 14-period lookback, and the %D line is a 3-period moving average of %K. The final ‘3’ refers to a smoothing factor that slows the indicator down slightly to reduce noise.
- MACD: The default setting is (12, 26, 9). This uses a 12-period and a 26-period EMA to create the MACD line, with a 9-period EMA serving as the signal line.
For day trading or more volatile assets, some traders prefer faster settings (e.g., Stochastic (5, 3, 3) and MACD (5, 13, 5)), but this will generate more signals, including more false ones. It’s always best to backtest any changes.
Identifying Bullish and Bearish Setups
The beauty of this strategy lies in its clear, step-by-step logic. Here’s how to identify high-probability trade setups.
Bullish Entry (Buy Signal)
- MACD Confirmation: Look for the MACD line to cross above the signal line. For a stronger signal, this crossover should ideally happen below the zero line, indicating a potential shift from bearish to bullish momentum. Alternatively, if the MACD is already above the zero line, a crossover confirms the continuation of an uptrend.
- Stochastic Confirmation: Wait for the Stochastic Oscillator to be in the oversold territory (below the 20 level).
- Entry Trigger: The final trigger to enter a long position is when the Stochastic’s %K line crosses above its %D line while in the oversold zone.
Example: Imagine a 4-hour chart of EUR/USD. The price has been in a downtrend. First, you notice the MACD lines, which were well below the zero line, begin to converge and the MACD line crosses above the signal line. At the same time, the Stochastic indicator drops below the 20 level. A few candles later, the Stochastic %K line crosses up through the %D line. This confluence of signals is your cue to enter a buy trade.
Bearish Entry (Sell Signal)
- MACD Confirmation: Look for the MACD line to cross below the signal line. A high-quality signal often occurs when this crossover happens above the zero line, signaling a potential reversal from bullish to bearish momentum.
- Stochastic Confirmation: Wait for the Stochastic Oscillator to be in the overbought territory (above the 80 level).
- Entry Trigger: The trigger to enter a short position is when the Stochastic’s %K line crosses below its %D line while in the overbought zone.
Example: Consider a daily chart of Apple Inc. (AAPL). The stock has been in a strong uptrend. You observe the MACD line, high above the zero line, crossing below its signal line. Simultaneously, the Stochastic indicator pushes above the 80 level. The entry signal is confirmed when the Stochastic %K line then crosses down through the %D line. This is a strong indication to initiate a sell trade or exit a long position.
Read More:Stochastic Oscillator in Forex
Advanced Stochastic MACD Double Cross Techniques
Once you are comfortable with the basic crossover, you can explore more advanced variations. These techniques are designed to further improve signal quality and adapt the stochastic and macd strategy to specific market behaviors. The goal is to add more layers of confirmation without creating “analysis paralysis.”
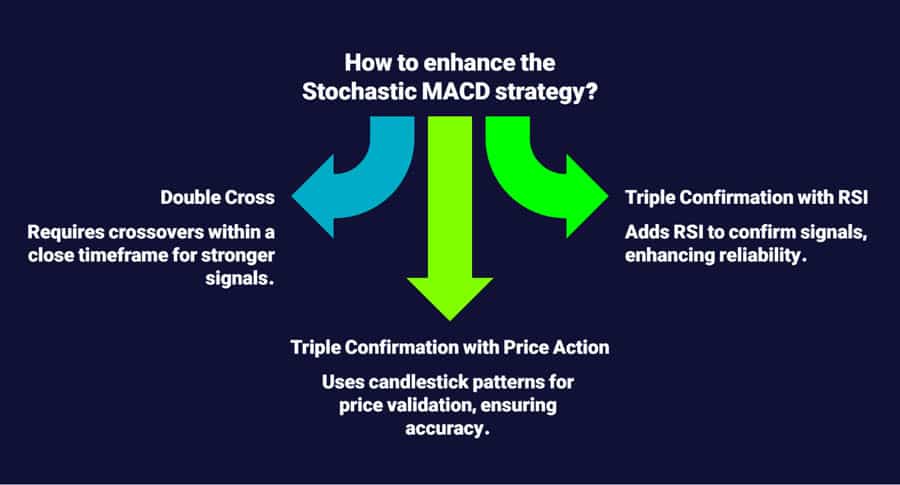
Stochastic MACD Double Cross Strategy Explained
The stochastic macd double cross strategy is a more stringent version of the standard crossover. It requires the crossovers on both indicators to occur within a very close timeframe, typically within a few price bars of each other. This synchronization suggests a more powerful and immediate shift in market sentiment.
- Bullish Double Cross: The MACD line crosses above its signal line, and almost simultaneously (e.g., within 1-3 candles), the Stochastic %K line crosses above its %D line from below the 50 level (some traders are even stricter, requiring it to be below 20). This near-perfect alignment suggests that both long-term and short-term momentum are shifting bullish at the same time.
- Bearish Double Cross: The MACD line crosses below its signal line, and concurrently, the Stochastic %K line crosses below its %D line from above the 50 level (or preferably, above 80). This indicates a synchronized push to the downside.
From personal trading experience, this “double cross” reduces the number of trades taken, but the win rate on those trades is often higher because the market conviction is stronger.
Triple Confirmation: Adding RSI or Price Action
For the highest level of confirmation, you can add a third element to your analysis. This could be another indicator or, even better, pure price action.
- Adding the RSI: The Relative Strength Index (RSI) is another momentum oscillator similar to the Stochastic. You could require the RSI to also confirm the signal (e.g., for a buy signal, the RSI should be coming out of its oversold 30 level).
- Adding Price Action: This is my preferred method. After getting a bullish crossover signal from your stochastic and macd strategy, look for a bullish candlestick pattern like a hammer, a bullish engulfing pattern, or a breakout above a small resistance level to confirm your entry. This ensures that the price itself is validating what the indicators are telling you.
Backtesting Stochastic and MACD Strategies: Results
No strategy should be traded blindly without an understanding of its potential performance. While past results are not indicative of future returns, backtesting provides invaluable insights into a strategy’s strengths and weaknesses. Various studies and my own tests on the stochastic and macd strategy reveal a nuanced picture. A widely cited backtest performed over 100 trades showed a win rate of around 53%. While that number might seem low, it was profitable because the strategy employed a 1.5:1 reward-to-risk ratio, meaning winning trades were significantly larger than losing ones.
Other tests have shown that the strategy’s performance can vary greatly depending on market conditions. It tends to perform exceptionally well in ranging or moderately trending markets where prices oscillate predictably. However, in a very strong, sustained trend, the Stochastic can remain in the overbought/oversold territory for a long time, giving premature exit signals or filtering out good continuation trades. This is a key reason why many traders add a longer-term moving average (like the 200 EMA) to only take trades in the direction of the dominant, long-term trend.
Risk Management for Stochastic MACD Trading
Even the most effective trading strategy will fail without disciplined risk management. The stochastic and macd trading strategy provides clear entry signals, but managing the trade after entry is what ultimately determines profitability. A single large loss can wipe out a series of small wins.
Position Sizing and Stop-Loss Placement
Before entering any trade, you must know two things: where you will get out if you’re wrong (stop-loss) and how much you will risk (position size).
- Stop-Loss Placement: A logical place to put your stop-loss is just beyond the most recent market structure. For a buy signal, the stop-loss can be placed a few pips below the recent swing low that formed before the entry. For a sell signal, place it just above the recent swing high. Avoid placing stops based on an arbitrary number of pips; let the market dictate the level.
- Position Sizing: Never risk more than a small percentage of your trading capital on a single trade. A professional standard is 1-2%. Once you know your entry price and your stop-loss price, you can calculate the exact position size that corresponds to your chosen risk percentage.
Avoiding Common Pitfalls
Traders using the stochastic and macd strategy often fall into a few common traps. Being aware of them is half the battle.
- Ignoring the Broader Trend: Taking a buy signal in a strong, confirmed downtrend is a low-probability trade. Always have a sense of the higher timeframe trend.
- Trading During Major News Events: High-impact news releases can throw technical signals completely out the window. It’s often wise to stay flat around major events like central bank announcements or employment reports.
- Over-Optimization (Overfitting): Constantly tweaking indicator settings to perfectly fit past data is a recipe for disaster. The standard settings have worked for decades for a reason. Stick with them or make only minor, well-tested adjustments.
Pro Tips for Adapting the Strategy in 2025
Markets evolve, and a trader’s strategy must evolve with them. While the core principles of the stochastic and macd strategy remain timeless, its application in the dynamic markets of 2025 requires some adaptability. Volatility patterns change, and being able to adjust is crucial for long-term success.
Adapting to Changing Market Conditions
Today’s markets can switch from low-volatility ranges to high-momentum trends very quickly. Pay attention to volatility indicators like the Average True Range (ATR). If ATR is high, it means volatility is increasing. You might consider widening your stop-loss and take-profit targets to accommodate the larger price swings. Conversely, in a low ATR environment, the market is likely ranging, which is often a sweet spot for the standard macd and stochastic strategy, looking for overbought and oversold signals between clear support and resistance levels.
When to Avoid Using the Strategy
Knowing when not to trade is as important as knowing when to trade. I’ve learned to be extremely cautious with this strategy during periods of very low liquidity, such as major holidays or the “summer doldrums.” In these conditions, price action can be erratic and indicators produce unreliable signals. Furthermore, if a market is in an extremely powerful, parabolic trend, fighting it with counter-trend signals from the Stochastic is a high-risk endeavor. In these cases, it’s better to wait for the trend to show clear signs of exhaustion before looking for reversal signals.
Opofinance Services
To effectively implement strategies like the stochastic and macd strategy, your choice of broker is paramount. Opofinance, a reputable ASIC-regulated broker, provides the tools and environment necessary for modern traders to succeed.
- Advanced Trading Platforms: Execute your trades flawlessly on industry-leading platforms including MT4, MT5, cTrader, and the proprietary OpoTrade.
- Innovative AI Tools: Gain a competitive edge by utilizing the AI Market Analyzer, AI Coach, and AI Support to refine your trading decisions.
- Flexible Trading Options: Explore diverse opportunities with Social Trading and Prop Trading programs.
- Secure & Convenient Transactions: Benefit from safe and convenient deposit and withdrawal methods, including crypto payments, with zero fees charged by Opofinance.
Elevate your trading experience by partnering with a broker that invests in your success. Discover the Opofinance advantage today!
Final Thoughts: Maximizing Success with Stochastic & MACD
The stochastic and macd strategy offers a robust framework for identifying high-probability trading opportunities. By leveraging the MACD’s trend-following capabilities and the Stochastic’s momentum-based entry signals, traders can create a balanced system that filters out noise and improves timing. However, its success is not automatic. It requires practice, discipline in execution, and a steadfast commitment to risk management. Whether you’re using the basic crossover or the advanced double-cross technique, remember that these indicators are tools to guide your decisions, not infallible crystal balls. Combine them with sound analysis and a patient mindset to unlock their full potential.
What is the best timeframe for the stochastic and macd strategy?
There is no single “best” timeframe; it depends on your trading style. Day traders often use it on 15-minute to 1-hour charts, while swing traders apply it to 4-hour and daily charts. The key is consistency: perform your analysis and execute your trades on the same timeframe.
Can this strategy be used for scalping?
Yes, but with caution. For scalping on 1-minute or 5-minute charts, you may need to use faster indicator settings (e.g., MACD (5, 10, 5)). Be aware that on lower timeframes, signals are more frequent, and so are false signals. Transaction costs also become more significant.
What happens if MACD gives a buy signal but Stochastic is overbought?
This is a conflicting signal, and the safest action is to do nothing. It indicates that while the broader momentum may be turning bullish (MACD), the short-term price action is extended and could be due for a pullback (Stochastic). Waiting for both indicators to align reduces risk.
Is this strategy effective for cryptocurrency trading?
Yes, the principles of the stochastic and macd strategy apply to any freely traded market, including cryptocurrencies. However, due to the high volatility of crypto, you may want to confirm signals with volume analysis and be particularly diligent with stop-loss placement.
How do I know if a crossover is a false signal?
You can never know with 100% certainty, but you can look for clues. A false signal often occurs with low volume and against the primary trend. For example, a bullish crossover on the 1-hour chart while the daily chart is in a strong downtrend is more likely to fail. This is why multi-timeframe analysis is crucial.


