The stochastic oscillator in forex trading is a widely-used momentum indicator that helps traders identify overbought and oversold conditions in the market. Developed by George Lane in the 1950s, it compares a currency pair’s closing price to its price range over a specific period, typically 14 periods. Traders often use it in combination with other tools to time entry and exit points more precisely. By recognizing momentum shifts, you can enhance your trading precision and overall strategy.
In this comprehensive guide, we’ll explain how to use the stochastic indicator in forex trading, including its mechanics, practical applications, and limitations. Whether you are trading through a regulated forex broker or exploring strategies on your own, mastering this tool will help you improve your trading decisions and align your trades with market trends.
Introduction to the Stochastic Oscillator
Definition and Purpose of the Stochastic Oscillator in Forex Trading
The stochastic oscillator is a momentum indicator that measures the location of the closing price relative to the high-low range over a set number of periods, typically 14. It operates on the principle that in an upward-trending market, prices tend to close near their high, and in a downward-trending market, prices tend to close near their low. By quantifying this relationship, the oscillator helps traders identify potential reversal points by signaling when a currency pair is overbought or oversold.
The primary purposes of the stochastic oscillator in forex trading are:
- Identifying Overbought and Oversold Conditions: Highlighting when a currency pair may be due for a correction or reversal.
- Signaling Potential Trend Reversals: Providing early warnings of possible shifts in market direction.
- Complementing Other Technical Analysis Tools: Enhancing the effectiveness of trading strategies when used alongside other indicators.
Historical Background and Development by George Lane
George Lane, a pioneer in technical analysis, developed the stochastic oscillator in the late 1950s. His extensive study of price movements led him to discover that momentum often changes direction before price. This observation became the foundation of the stochastic oscillator. Lane introduced this indicator as a way to compare a security’s closing price to its price range over a certain period, providing insights into potential price reversals.
His work laid the groundwork for many modern technical indicators, and the stochastic oscillator remains one of the most widely used tools in forex trading today. Lane emphasized the importance of understanding the oscillator’s signals in the context of the overall market trend, a principle that continues to guide traders.
Read More: Best Indicator for Gold Scalping
Understanding the Mechanics
How the Stochastic Oscillator Works
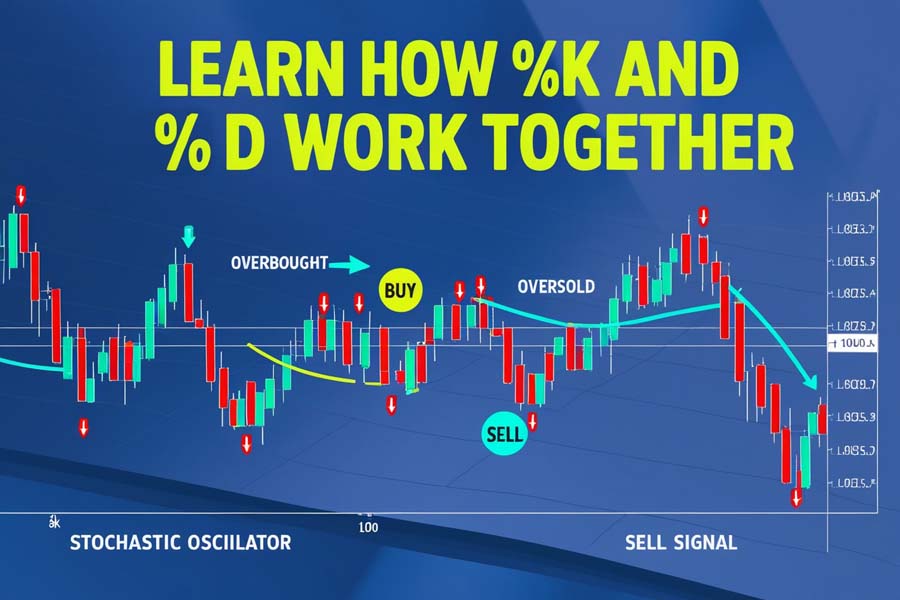
The stochastic oscillator operates by analyzing price momentum. It consists of two lines, %K and %D, which oscillate between 0 and 100, providing a visual representation of the currency pair’s momentum.
- Oscillation Range: The oscillator moves within a fixed range, allowing traders to easily identify extreme values.
- Momentum Measurement: By comparing the closing price to the high-low range over a specified period, the oscillator gauges the speed and direction of price movements.
- Signal Generation: Crossovers between the %K and %D lines, as well as movements into overbought and oversold zones, generate trading signals.
The most important aspect of the stochastic oscillator is its ability to reveal overbought and oversold conditions, providing traders with actionable signals.
Description of the Two Lines: %K and %D
The stochastic oscillator consists of two lines that work in tandem:
- %K Line:
- Definition: Represents the current closing price relative to the high-low range over a specified period.
- Characteristics: The more sensitive line that reacts quickly to price changes.
- Calculation: Derived directly from the price data.
- %D Line:
- Definition: A moving average of the %K line, typically over three periods.
- Characteristics: The slower line that smooths out fluctuations, providing a clearer signal.
- Role: Used to identify crossovers and confirm signals.
The interaction between these two lines is crucial. When the %K line crosses above the %D line, it may indicate a bullish signal, suggesting that momentum is shifting upward. Conversely, when the %K line crosses below the %D line, it may signal a bearish trend.
Calculation of the Stochastic Oscillator
Detailed Formula for Calculating %K and %D
Understanding the calculation of the stochastic oscillator provides deeper insight into how the indicator functions.
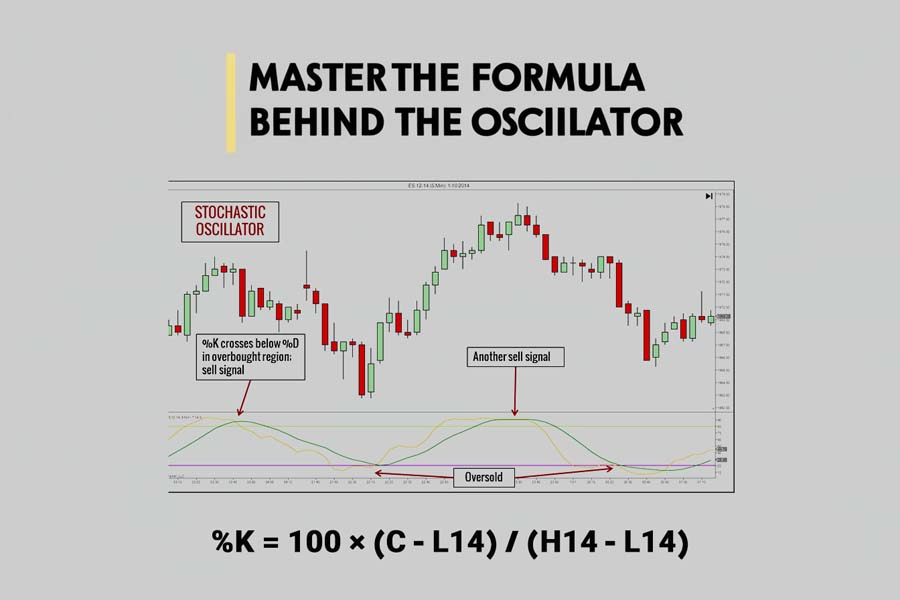
%K = 100 × (C – L14) / (H14 – L14)
Where:
- C = Most recent closing price
- L14 = Lowest price over the past 14 periods
- H14 = Highest price over the past 14 periods
The formula calculates the position of the closing price within the range of the high and low over the specified period.
%D is the 3-period simple moving average (SMA) of %K:
%D = SMA3 of %K
This moving average smooths out the %K line, making it easier to identify crossovers and potential signals.
Explanation of Variables
- Current Closing Price (C): The last price at which the currency pair traded during the period.
- Lowest Price (L14): The minimum price observed over the past 14 periods.
- Highest Price (H14): The maximum price observed over the past 14 periods.
By comparing the current closing price to the recent price range, the oscillator gauges where the price stands relative to its historical performance.
Importance of Time Periods in Calculations
The default setting for the stochastic oscillator is 14 periods, but traders often adjust this based on their trading style and the specific currency pair.
- Shorter Periods (e.g., 5 or 9):
- Pros: More responsive to recent price changes.
- Cons: Can generate more false signals due to increased sensitivity.
- Longer Periods (e.g., 21 or 28):
- Pros: Smoother lines, fewer false signals.
- Cons: May lag and miss early entry points.
Selecting the appropriate time frame is essential for aligning the oscillator with your trading strategy and risk tolerance.
Read More: Zigzag Indicator in Forex
Interpreting the Indicator
Overbought and Oversold Levels
The stochastic oscillator helps identify overbought and oversold conditions by signaling when the %K and %D lines move into extreme zones.
- Overbought Conditions (Levels Above 80):
- Interpretation: The currency pair may be overvalued, and a price correction or reversal could be imminent.
- Action: Traders may look for selling opportunities or tighten stop-loss orders.
- Oversold Conditions (Levels Below 20):
- Interpretation: The currency pair may be undervalued, indicating a potential upward price movement.
- Action: Traders may consider buying opportunities or preparing for a trend reversal.
Recognizing overbought and oversold levels is crucial for timing entry and exit points in forex trading.
The Significance of Divergence Signals in Trend Analysis
Divergence occurs when the price movement of a currency pair and the stochastic oscillator move in opposite directions, signaling a potential trend reversal.
- Bullish Divergence:
- Scenario: Prices make lower lows, but the oscillator makes higher lows.
- Interpretation: Downward momentum is weakening, suggesting a potential upward reversal.
- Action: Traders may consider entering long positions.
- Bearish Divergence:
- Scenario: Prices make higher highs, but the oscillator makes lower highs.
- Interpretation: Upward momentum is waning, indicating a possible downward reversal.
- Action: Traders may look to enter short positions.
Understanding divergence helps traders anticipate changes in market trends before they become apparent in price action.
Trading Strategies Using the Stochastic Oscillator
Overbought and Oversold Strategy
This is one of the simplest strategies utilizing the stochastic oscillator.
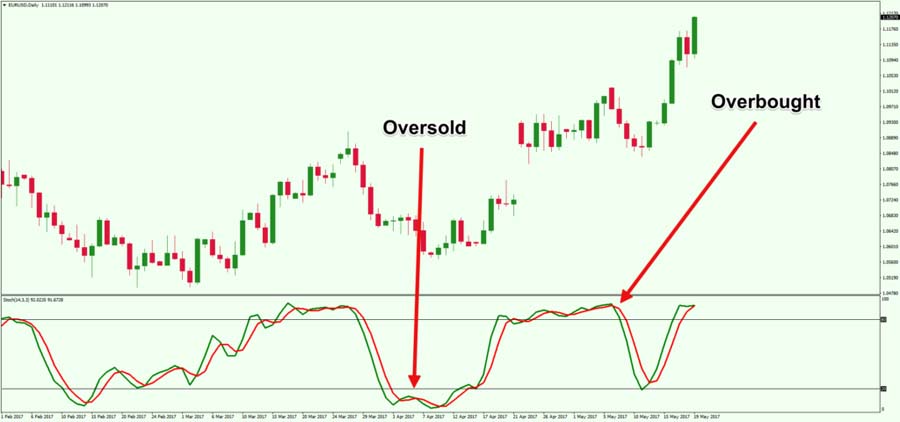
- Identifying Overbought Conditions:
- Signal: Oscillator moves above 80 and then crosses back below.
- Action: Consider selling or closing long positions.
- Identifying Oversold Conditions:
- Signal: Oscillator moves below 20 and then crosses back above.
- Action: Consider buying or closing short positions.
Example: If the EUR/USD oscillator moves above 80 and then crosses back below, a trader might interpret this as a signal to sell, anticipating a price decline.
Read More: ADX Indicator in Forex
Divergence Strategy
By identifying divergences between the price and the oscillator, traders can anticipate potential trend reversals.
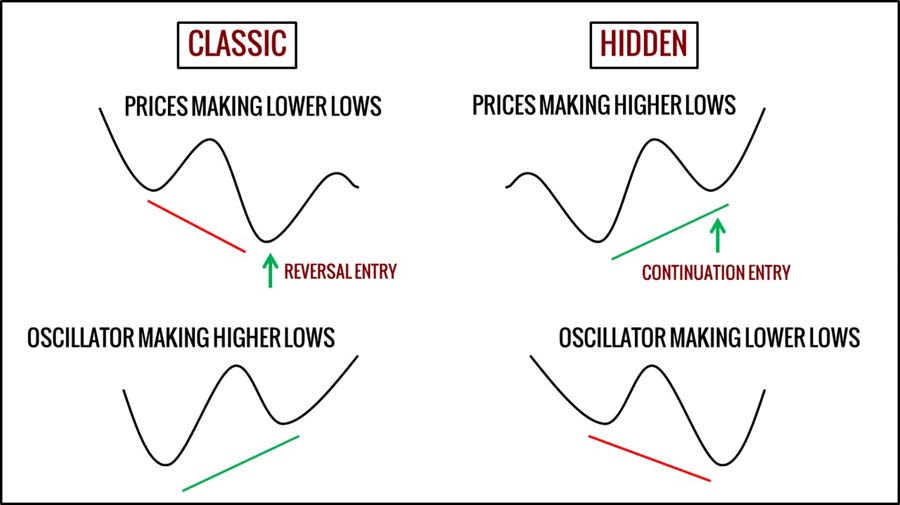
- Bullish Divergence Example:
- Scenario: The GBP/USD price makes lower lows, but the stochastic oscillator makes higher lows.
- Interpretation: Downward momentum is decreasing; an upward reversal may occur.
- Action: Consider entering a long position.
- Bearish Divergence Example:
- Scenario: The USD/JPY price makes higher highs, but the oscillator makes lower highs.
- Interpretation: Upward momentum is weakening; a downward reversal may be imminent.
- Action: Consider entering a short position.
This strategy requires careful observation and may be more effective when combined with other indicators.
Swing Trading Strategy Incorporating Other Indicators
Swing trading involves capturing short to medium-term gains over a period of days or weeks.
- Combining with Simple Moving Averages (SMA):
- Usage: Use the SMA to identify the overall trend.
- Action: Only take oscillator signals that align with the trend indicated by the SMA.
- Incorporating the Relative Strength Index (RSI):
- Usage: Confirm oscillator signals with RSI readings.
- Action: For example, if both the oscillator and RSI indicate oversold conditions, it strengthens the buy signal.
By integrating multiple indicators, traders can increase the reliability of their trading signals and reduce the risk of false entries.
Limitations and Common Mistakes
Limitations of the Stochastic Oscillator
While the stochastic oscillator is a valuable tool, it’s important to be aware of its limitations to use it effectively.
False Signals
- In Strong Trends: During strong upward or downward trends, the oscillator can remain in overbought or oversold territories for extended periods, generating false signals.
- Market Volatility: High volatility can cause frequent fluctuations in the oscillator, leading to misleading signals.
Relying solely on the stochastic oscillator without considering market conditions can result in poor trading decisions.
Lagging Indicator
- Delayed Signals: The oscillator may lag during rapid market movements, causing traders to miss optimal entry or exit points.
- Reaction Time: In fast-moving markets, the oscillator might not react quickly enough to sudden price changes.
Common Mistakes to Avoid
Over-Reliance on One Indicator
- Lack of Confirmation: Using the stochastic oscillator in isolation without confirming signals with other indicators can lead to erroneous trades.
- Diverse Tools: Incorporate additional technical analysis tools, such as moving averages or trend lines, to validate signals.
Ignoring the Overall Trend
- Contradictory Signals: Trading against the prevailing market trend increases the risk of losses.
- Trend Alignment: Ensure that oscillator signals are aligned with the overall trend direction for higher probability trades.
Understanding the broader market context is essential for interpreting oscillator signals correctly.
Best Practices and Tips
Recommendations for Using the Stochastic Oscillator Effectively
- Align with the Trend: Use the oscillator in the direction of the prevailing market trend to improve success rates.
- Adjust Sensitivity: Modify the time periods to suit the volatility of the currency pair you are trading.
- Use Stop-Loss Orders: Protect your positions by setting appropriate stop-loss levels.
- Monitor Economic Calendars: Be aware of major economic events that could impact currency prices.
Combining multiple analysis tools can significantly enhance the reliability of your trading signals.
Importance of Combining with Other Technical Analysis Tools to Avoid False Signals
Relying solely on the stochastic oscillator can lead to false signals, especially in volatile or strongly trending markets.
- Use Trend Lines: Confirm oscillator signals with trend lines to identify true trend reversals.
- Apply Volume Indicators: High trading volume can validate oscillator signals.
- Check Support and Resistance Levels: Oscillator signals near key support or resistance levels may carry more weight.
By incorporating additional tools, traders can filter out noise and make more informed decisions.
Opofinance Services
Opofinance is an ASIC-regulated forex trading broker that offers a secure and user-friendly platform for traders at all levels. Being featured on the MT5 brokers list, Opofinance provides advanced trading tools and access to a wide range of currency pairs.

- Social Trading Service:
- Feature: Allows traders to follow and replicate the strategies of experienced professionals.
- Benefit: Ideal for beginners looking to learn from seasoned traders or for those who prefer a more hands-off approach.
- Functionality: Browse through top-performing traders, analyze their strategies, and automatically copy their trades.
- Safe and Convenient Deposits and Withdrawals:
- Security Measures: Utilizes advanced encryption and secure payment gateways.
- Payment Options: Offers multiple methods, including bank transfers, credit cards, and e-wallets.
- Efficiency: Quick processing times ensure that funds are available when you need them.
- Educational Resources:
- Webinars and Tutorials: Provides learning materials to help traders improve their skills.
- Market Analysis: Regular updates on market trends and economic events.
Choosing a reliable online forex broker like Opofinance can make a significant difference in your trading success.
Conclusion
Understanding the stochastic oscillator in forex trading is essential for identifying potential market turning points and making informed trading decisions. By mastering this indicator and incorporating it into your trading strategy—alongside other technical analysis tools—you can enhance your ability to navigate the forex market effectively.
Key Takeaways:
- The stochastic oscillator helps identify overbought and oversold conditions.
- It’s important to consider limitations and avoid common mistakes, such as over-reliance on the indicator and ignoring the overall trend.
- Combining the oscillator with other indicators and aligning with the market trend increases the effectiveness of your trading strategy.
To further enhance your trading skills, consider practicing with demo accounts, studying advanced trading strategies, and staying updated on market developments.
Encourage Further Learning:
- Explore Educational Resources: Utilize webinars, tutorials, and articles to deepen your understanding of technical analysis.
- Join Trading Communities: Engage with other traders to share insights and learn from collective experiences.
- Stay Informed: Regularly monitor financial news and economic indicators that impact the forex market.
By combining knowledge, practice, and the right tools, you can improve your trading performance and achieve your financial goals.
Can the stochastic oscillator be used in conjunction with fundamental analysis?
Yes, combining the stochastic oscillator with fundamental analysis can provide a more comprehensive view of the market. While the oscillator helps identify technical entry and exit points, fundamental analysis offers insights into the underlying economic factors affecting currency prices. By considering both technical and fundamental aspects, traders can make more informed decisions.
What is the difference between the stochastic oscillator and RSI?
Both are momentum indicators, but they measure different aspects:
Stochastic Oscillator: Focus: Compares closing prices to price ranges over a period.
Best Used For: Identifying overbought and oversold conditions in range-bound markets.
Relative Strength Index (RSI): Focus: Measures the speed and change of price movements.
Best Used For: Determining the strength of price movements and identifying potential reversal points.
Traders often use them together to confirm signals and enhance the accuracy of their analysis.
Is the stochastic oscillator effective in all market conditions?
The stochastic oscillator is most effective in range-bound markets where prices fluctuate between support and resistance levels. In strongly trending markets, it may produce false signals as the oscillator can remain in overbought or oversold zones for extended periods. To mitigate this, traders should:
Use Trend Indicators: Combine the oscillator with trend-following indicators like moving averages.
Adjust Settings: Modify the oscillator’s time periods to suit the market conditions.
Exercise Caution: Be wary of relying solely on the oscillator in trending markets.


