

Are you navigating the choppy waters of short-term trading, seeking a reliable compass to guide your decisions? In the relentless pace of the 15-minute chart, identifying fleeting opportunities requires precision and a keen understanding of momentum. The stochastic oscillator, a powerful tool for gauging market momentum, can be your strategic advantage. However, its effectiveness hinges on selecting the best stochastic settings for 15 minute trading. This article provides a comprehensive guide to optimizing your stochastic oscillator for the 15-minute timeframe, helping you pinpoint optimal entry and exit points and enhance your short-term trading performance. Choosing the right online forex broker is also a critical step in executing your trading strategies effectively.
Introduction to Stochastic Oscillator
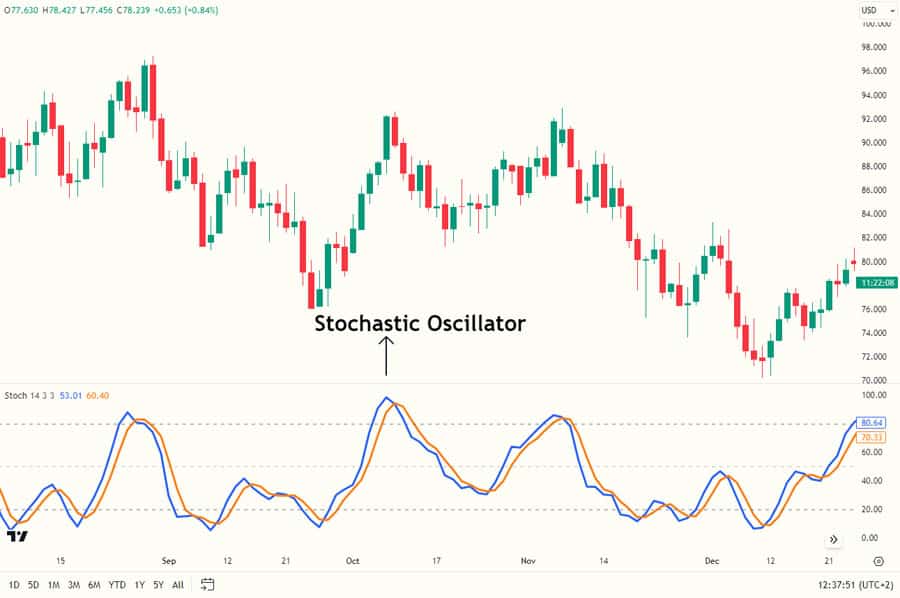
The stochastic oscillator is a cornerstone of technical analysis, providing insights into the momentum behind price movements. Understanding its core principles is crucial before diving into specific settings for the 15-minute chart. It helps traders identify potential overbought and oversold conditions, signaling possible shifts in price direction.
What is the Stochastic Oscillator?
Developed by George Lane, the stochastic oscillator is a momentum indicator that compares the closing price of an asset to its price range over a specific period. It operates on the principle that in an upward trending market, closing prices tend to close near the high of the range, and conversely, in a downtrend, they tend to close near the low. The oscillator is typically displayed as two lines oscillating between 0 and 100, offering a visual representation of momentum shifts.
Importance of Stochastic Settings in Trading
The settings you apply to the stochastic oscillator directly influence its sensitivity and the signals it generates. Incorrect settings can lead to a barrage of false signals, causing confusion and potential losses. Conversely, well-optimized settings can filter out noise and highlight high-probability trading opportunities. Finding the right stochastic oscillator settings for 15 minute timeframe is paramount for capturing timely signals.
Why Focus on the 15-Minute Chart?
The 15-minute chart strikes a balance for many traders, offering more trading opportunities than longer timeframes while mitigating some of the excessive noise found on shorter durations. It allows for the identification of intraday trends and potential reversals, making it a popular choice for day traders and scalpers. However, the rapid price fluctuations on this timeframe necessitate carefully considered best stochastic settings for 15 minute chart analysis.
Read More: Best 15 minute forex trading strategy
Understanding Stochastic Oscillator Components
To effectively leverage the stochastic oscillator, a thorough understanding of its individual components is essential. Each element contributes to the overall interpretation of the indicator and its signals.
%K and %D Lines Explained
The stochastic oscillator is composed of two primary lines: %K and %D. These lines work in tandem to provide insights into momentum and potential trading signals.
The %K line, often referred to as the fast stochastic line, is calculated using the following formula:
%K = (Current Close – Lowest Low over N periods) / (Highest High over N periods – Lowest Low over N periods) * 100
Where ‘N’ represents the lookback period, a key setting you’ll adjust. A shorter ‘N’ makes the %K line more sensitive to recent price changes.
The %D line, known as the slow stochastic line, is a smoothed version of the %K line. It’s typically calculated as a 3-period simple moving average (SMA) of the %K values:
%D = SMA of %K over M periods
Where ‘M’ is the smoothing period. The %D line reacts more slowly to price changes than the %K line, providing a smoother representation of momentum.
Overbought and Oversold Levels (80 and 20)
The stochastic oscillator operates within a bounded range of 0 to 100. Traditional interpretation designates levels above 80 as overbought, suggesting the asset may be overvalued and prone to a price decrease. Conversely, levels below 20 are considered oversold, indicating the asset might be undervalued and poised for a potential price increase. However, these levels should not be treated as absolute buy or sell signals in isolation. Prices can remain in overbought or oversold territories for extended periods, particularly in strong trending markets. Confirmation from other indicators or price action is often necessary.
Fast vs. Slow Stochastic
The distinction between fast and slow stochastic lies in how the %D line is calculated. The fast stochastic uses a simple moving average for the %D line, making it more reactive to price fluctuations and generating more frequent signals. This can be beneficial for capturing short-term moves but may also lead to more false signals. The slow stochastic, which is the default on most platforms, applies an additional smoothing to the %D line, typically another SMA. This results in a smoother line with fewer, potentially more reliable signals. When determining the optimal stochastic settings for 15 minute trading, consider whether the fast or slow version aligns better with your trading style and risk tolerance.
Read More: Stochastic Oscillator in Forex
Best Stochastic Settings for 15-Minute Chart
Identifying the best stochastic settings for 15 minute chart trading requires careful consideration of the timeframe’s characteristics and your individual trading objectives. There’s no universally perfect setting, as the optimal parameters can vary depending on market conditions and personal preferences.
Default Settings (14, 3, 3) and Their Effectiveness
The default settings for the stochastic oscillator are typically (14, 3, 3). This signifies a 14-period lookback for the %K calculation, a 3-period SMA for the %D line, and a 3-period smoothing of the %K before calculating the %D (in the case of the slow stochastic). While these default settings provide a general overview of momentum, they might not be ideally suited for the rapid price action of the 15-minute chart. The 14-period lookback can be somewhat slow to react to short-term price swings, potentially leading to delayed signals or missed opportunities in the fast-paced environment of intraday trading.
Alternative Settings for Enhanced Sensitivity (e.g., 9, 3, 3)
For the 15-minute timeframe, many traders find that reducing the lookback period for the %K line enhances the indicator’s sensitivity and responsiveness. A popular alternative setting is (9, 3, 3). This shorter lookback period makes the %K line more attuned to recent price movements, potentially providing earlier and more actionable signals. This increased sensitivity can be particularly advantageous in volatile markets where swift reactions are crucial for capitalizing on short-term opportunities. However, it’s important to note that increased sensitivity can also lead to a higher frequency of signals, some of which may be false. Therefore, combining these settings with other forms of analysis is recommended.
Adjusting Settings for Volatile vs. Stable Markets
Market volatility plays a crucial role in determining the optimal stochastic settings for 15 minute trading. Adapting your settings to the prevailing market conditions can significantly improve the indicator’s effectiveness.
In volatile markets, characterized by rapid and significant price fluctuations, a shorter lookback period for %K (e.g., 7, 3, 3 or even 5, 3, 3) might be more appropriate. This heightened sensitivity allows the stochastic oscillator to react more quickly to the dynamic price action, potentially capturing short-term opportunities that might be missed with slower settings. However, be aware that this increased sensitivity can also lead to a greater number of false signals, requiring careful confirmation from other indicators or price action analysis.
In stable or ranging markets, where price movements are less erratic, the default settings (14, 3, 3) or slightly adjusted settings like (12, 3, 3) might perform better. These settings provide a smoother reading of momentum and can help filter out some of the noise inherent in less volatile conditions, potentially leading to more reliable signals. The longer lookback period helps to smooth out short-term fluctuations, focusing on more significant momentum shifts.
How to Optimize Stochastic Settings for 15-Minute Trading
Finding the best stochastic settings for 15 minute trading is an iterative process that involves experimentation, analysis, and a deep understanding of your trading style and the assets you trade. It’s not a matter of finding a magic number but rather a process of refinement.

Importance of Backtesting
Backtesting is an indispensable tool for optimizing your stochastic settings. By applying different settings to historical price data, you can simulate how the indicator would have performed in the past. This allows you to evaluate the effectiveness of various settings and identify which ones would have generated the most profitable trades while minimizing losses. Most trading platforms offer backtesting capabilities, enabling you to analyze the historical performance of your chosen settings and refine them based on empirical data. Remember that while past performance is not a guarantee of future results, backtesting provides valuable insights into the potential of different settings under various market conditions.
Combining Stochastic with Other Indicators (e.g., Moving Averages, RSI)
Relying solely on the stochastic oscillator can be limiting. Combining it with other technical indicators can significantly enhance the reliability of your trading signals and filter out false positives. This confluence of evidence can lead to more confident trading decisions.
Moving Averages: Using moving averages to identify the prevailing trend can help you align your stochastic signals with the overall market direction. For example, you might only consider long positions when the price is trading above a key moving average and the stochastic oscillator is indicating an oversold condition. This approach increases the probability of success by trading in the direction of the dominant trend.
Relative Strength Index (RSI): The RSI is another popular momentum indicator that can complement the stochastic oscillator. Looking for confirmation between overbought/oversold signals on both indicators can provide stronger conviction in a potential trade setup. For instance, if both the stochastic and RSI are signaling oversold conditions, it can strengthen the bullish signal.
Read More: Best EMA Settings for 15 Minute Chart
Risk Management Techniques for 15-Minute Trading
Regardless of your chosen stochastic settings, implementing robust risk management techniques is absolutely crucial, especially when trading on the fast-paced 15-minute chart. The potential for rapid price fluctuations necessitates a disciplined approach to protecting your capital.
Setting Stop-Loss Orders: Always use stop-loss orders to limit your potential losses on each trade. Determine an appropriate level based on your risk tolerance and the volatility of the asset. A well-placed stop-loss order can prevent significant losses from unexpected price swings.
Position Sizing: Carefully calculate your position size based on your risk tolerance and account balance. Avoid risking too much capital on any single trade. A common guideline is to risk no more than 1-2% of your trading capital on any individual trade.
Profit Targets: Have clear profit targets in mind before entering a trade. This helps you to define your potential reward and stick to your trading plan. Using techniques like setting price targets based on support and resistance levels or using risk-reward ratios can be beneficial.
Step-by-Step Guide to Applying Stochastic Settings on Trading Platforms
Applying your chosen best stochastic settings for 15 minute trading is a straightforward process on most popular trading platforms. Here’s a guide for some common platforms.

MetaTrader 4/5 Settings
- Insert Indicator: Navigate to the “Insert” menu, then select “Indicators,” then “Oscillators,” and finally choose “Stochastic Oscillator.”
- Customize Settings: In the settings window that appears, you’ll find fields to adjust the “%K period,” “%D period,” and “Slowing” (which determines whether it’s a fast or slow stochastic). Enter your desired values, such as 9 for the %K period, 3 for the %D period, and 3 for slowing.
- Levels: You can also customize the overbought and oversold levels, which are typically set at 80 and 20 by default. Adjust these if your strategy requires different thresholds.
- Click “OK”: Once you’ve entered your desired settings, click “OK” to apply the stochastic oscillator to your chart with your custom parameters.
TradingView Settings
- Indicators: Click on the “Indicators” button located at the top of your TradingView chart.
- Search for Stochastic: In the search bar, type “Stochastic” and select either the “Stochastic RSI” or the standard “Stochastic” indicator.
- Settings/Inputs: Once the indicator is added to your chart, hover over its name in the top-left corner and click on the “Settings” (gear) icon.
- Adjust Inputs: In the settings window, you can modify the “K length,” “D length,” and “Smooth” values to match your desired settings.
- Style: You can also customize the visual appearance of the lines and the overbought/oversold levels under the “Style” tab.
- Click “OK”: After making your adjustments, click “OK” to apply the customized stochastic oscillator to your chart.
Customizing Stochastic for Different Trading Styles
Your individual trading style should significantly influence your choice of the best stochastic settings for 15 minute trading. Different approaches to the market require varying levels of sensitivity and signal frequency.
Scalpers, who aim to profit from very small price movements over short periods, might prefer more sensitive settings like (7, 3, 3) or even lower. This increased sensitivity allows them to capture quick, fleeting opportunities. However, they must also be prepared for a higher number of potential false signals.
Day Traders, who typically hold positions for several hours within a single trading day, might find settings like (9, 3, 3) or (12, 3, 3) to be a good balance between sensitivity and reliability. These settings provide enough responsiveness to capture intraday trends while filtering out some of the extreme noise.
Swing Traders who utilize the 15-minute chart primarily for identifying precise entry points within a larger timeframe trend might opt for slightly slower settings like the default (14, 3, 3) or even higher. This provides more confirmation and reduces the likelihood of entering a trade based on a short-term fluctuation that contradicts the overall trend.
Common Mistakes to Avoid When Using Stochastic on 15-Minute Charts
While the stochastic oscillator is a valuable tool, certain common mistakes can significantly hinder its effectiveness, particularly on the fast-paced 15-minute chart.
Over-Reliance on Default Settings
A frequent mistake is sticking solely to the default (14, 3, 3) settings without considering the specific characteristics of the asset being traded or the prevailing market conditions. As discussed earlier, these default settings might not be optimal for the rapid price action of the 15-minute timeframe. Experimentation and optimization are crucial for finding settings that align with your trading style and the assets you trade.
Ignoring Market Context and Trends
The stochastic oscillator works most effectively when used in conjunction with an understanding of the overall market context and trend. Taking long positions solely based on an oversold stochastic reading in a strong downtrend, or vice versa, is a common pitfall. Always consider the broader market picture, including the prevailing trend and key support and resistance levels, before acting on stochastic signals. Using tools like trendlines and moving averages can help establish the overall market context.
Misinterpreting Overbought/Oversold Signals
Treating overbought and oversold levels as absolute buy or sell signals is a common misinterpretation. Prices can remain in overbought or oversold territories for extended periods, especially in strong trending markets. Waiting for confirmation from other indicators or price action before acting on these signals is crucial. For instance, instead of immediately shorting when the stochastic enters overbought territory, wait for the %K line to cross back below the 80 level or for other bearish confirmation signals.
Advanced Strategies for 15-Minute Stochastic Trading
Once you have a solid understanding of the basics, you can explore more advanced strategies that leverage the nuances of the stochastic oscillator on the 15-minute chart.
Divergence Trading with Stochastic
Divergence occurs when the price action of an asset moves in the opposite direction of the stochastic oscillator. This can be a powerful signal of a potential trend reversal.
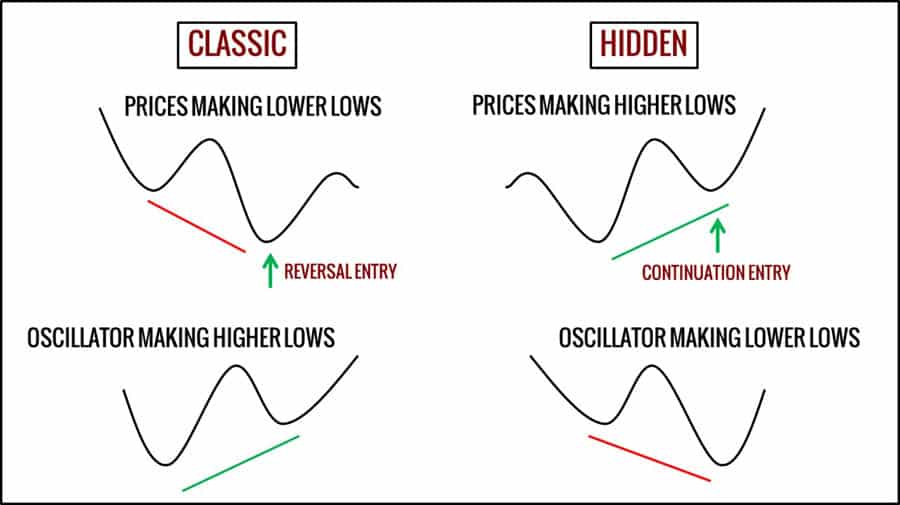
Bullish Divergence: This occurs when the price makes lower lows, but the stochastic oscillator makes higher lows. This divergence suggests that the selling pressure is weakening, and a potential bullish reversal might be imminent. Traders often look for the stochastic to then break above its signal line (%D) for confirmation.
Bearish Divergence: This occurs when the price makes higher highs, but the stochastic oscillator makes lower highs. This divergence indicates that the buying pressure is waning, and a potential bearish reversal could be on the horizon. Confirmation is often sought when the stochastic breaks below its signal line.
Divergence trading can be a high-probability strategy, but it’s crucial to wait for confirmation before entering a trade, as divergence can sometimes be a false signal.
Crossover Strategies for Entry and Exit Points
Crossovers of the %K and %D lines are fundamental signals generated by the stochastic oscillator and can be used to identify potential entry and exit points.
Bullish Crossover: When the %K line crosses above the %D line, it suggests that upward momentum is increasing and can be interpreted as a potential buy signal.
Bearish Crossover: When the %K line crosses below the %D line, it indicates that downward momentum is increasing and can be seen as a potential sell signal.
Combining these crossovers with overbought/oversold levels can increase the probability of success. For example, a bullish crossover occurring in the oversold zone can be a strong buy signal, while a bearish crossover in the overbought zone can be a strong sell signal.
Using Stochastic in Trending vs. Range-Bound Markets
The effectiveness of different best stochastic settings for 15 minute trading and strategies can vary depending on whether the market is in a trending or range-bound phase.
Trending Markets: In strongly trending markets, it’s generally more effective to focus on taking stochastic signals that align with the direction of the trend. For example, in an uptrend, look for oversold stochastic readings for potential buying opportunities when the oscillator suggests a temporary pullback. Avoid taking sell signals based on overbought conditions in a strong uptrend, as the trend is likely to continue.
Range-Bound Markets: In ranging markets, where the price oscillates between defined support and resistance levels, overbought and oversold signals from the stochastic oscillator can be more reliable for identifying potential reversals at the boundaries of the range. Buy when the stochastic is oversold near the support level and sell when it’s overbought near the resistance level.
Opofinance Services
For traders seeking a dependable and regulated broker for forex to implement their 15-minute stochastic trading strategies, Opofinance offers a robust platform and a commitment to a secure trading environment.
- ASIC Regulated: Trade with confidence knowing that Opofinance is regulated by the Australian Securities and Investments Commission (ASIC), ensuring adherence to strict financial standards.
- Social Trading: Benefit from the insights and strategies of experienced traders through Opofinance’s social trading features. This allows you to learn from others and potentially replicate their trades.
- MT5 Platform: Opofinance provides access to the powerful MetaTrader 5 (MT5) platform, a leading platform known for its advanced charting tools, technical indicators, and automated trading capabilities.
- Safe and Convenient Deposits and Withdrawals: Enjoy secure and efficient deposit and withdrawal methods, providing peace of mind when managing your trading funds.

Ready to optimize your 15-minute trading? Explore the advantages of trading with Opofinance. Visit opofinance.com to discover more and open an account today.
Conclusion
Mastering the stochastic oscillator for 15-minute chart trading is an ongoing process of learning and refinement. While the default settings provide a starting point, identifying the best stochastic settings for 15 minute trading often involves adjusting parameters to enhance sensitivity and align with prevailing market conditions. Remember the importance of combining the stochastic oscillator with other technical analysis tools, practicing diligent risk management, and continuously evaluating and adapting your approach. By embracing these principles, you can harness the power of the stochastic oscillator to gain a significant advantage in the dynamic realm of short-term trading.
Key Takeaways
- The best stochastic settings for 15 minute chart trading often require adjustments from the default (14, 3, 3) for increased responsiveness.
- Alternative settings like (9, 3, 3) can be more effective for capturing short-term price fluctuations.
- Market volatility is a key factor in determining the optimal stochastic settings.
- Backtesting is essential for identifying the most effective settings for your specific trading style and assets.
- Combining the stochastic oscillator with other indicators improves the reliability of trading signals.
- Robust risk management is paramount for protecting capital when trading on the 15-minute timeframe.
- Avoid over-reliance on default settings and always consider the broader market context.
Will the same stochastic settings work effectively across all currency pairs on the 15-minute chart?
While certain settings might exhibit good performance across multiple currency pairs, it’s generally advisable to optimize settings for individual pairs due to their unique volatility characteristics and typical trading ranges. Thorough backtesting on specific currency pairs is crucial for fine-tuning your approach and maximizing its effectiveness for each pair.
How frequently should I re-evaluate and potentially adjust my stochastic settings for the 15-minute chart?
It’s prudent to periodically review the performance of your chosen stochastic settings. Significant shifts in overall market volatility or changes in the typical behavior of the assets you trade might necessitate adjustments to your stochastic parameters. Consider re-optimizing your settings on a regular basis, perhaps monthly or quarterly, to ensure they remain aligned with current market conditions.
Can the stochastic oscillator be a reliable tool for trading on the 15-minute chart during major economic news releases?
Trading during high-impact economic news releases is generally considered a high-risk endeavor due to the potential for increased volatility and unpredictable, rapid price swings. While the stochastic oscillator might still generate signals during these periods, their reliability can be significantly diminished. Exercise extreme caution and consider avoiding trading during major news events or employing wider stop-loss orders if you choose to trade through them.


