

Feeling lost trying to make sense of market charts? It’s common. Prices swing, trends shift, and figuring out the next move can feel like guesswork, often leading to hesitation or bad calls. But imagine having a clearer way to read the market’s mood, a visual language developed over centuries to spot potential turning points. Learning about the strongest candlestick patterns gives traders, including those using a reliable broker for forex, a real advantage, helping to cut through the noise and trade with more confidence. This guide dives into identifying and using these powerful signals, exploring some of the strongest candlestick patterns available.
What are Candlestick Charts?
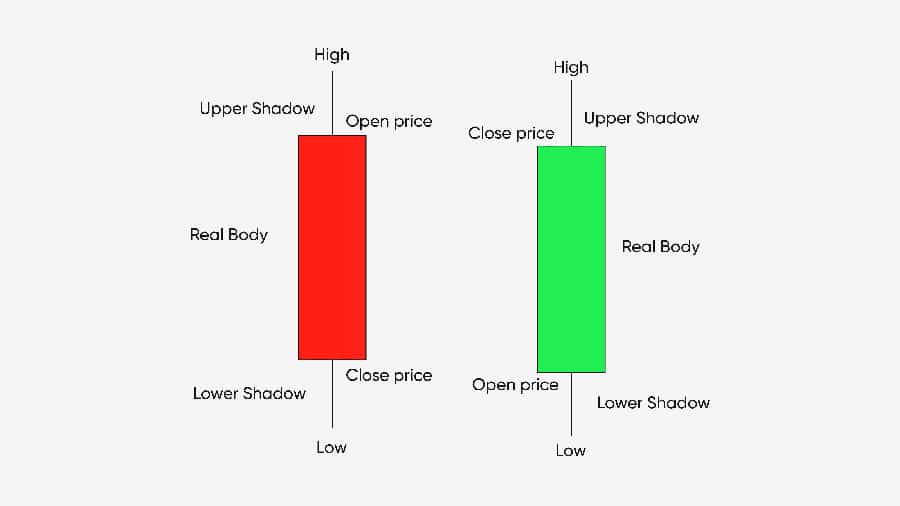
Think of candlestick charts as a visual story of price action. Originating from Japanese rice traders, each “candle” shows four key price points for a time period: the open, high, low, and close (OHLC). The main “body” spans the open-to-close range. Thin “wicks” or “shadows” show the high and low extremes. The body’s color (often green/white for up, red/black for down) tells you if the price closed higher or lower than it opened.
Why Candlestick Patterns Matter
Candlesticks offer snapshots of market psychology. Patterns formed by several candles can signal potential trend shifts, continuations, or pauses. Technical analysts use them to visualize the buyer-seller battle and anticipate moves. Recognizing formations, especially the strongest candlestick patterns, is a valuable skill.
What Makes a Pattern “Strong” or “Powerful”?
The strongest candlestick patterns are those with a historically higher reliability in predicting price moves. Their “strength” comes from statistical significance – a better probability of the expected outcome. Candle size, position in the trend, and volume contribute to a pattern’s perceived power. These powerful candlestick patterns serve as high-probability alerts.
Importance of Context
Crucially, never trade patterns in isolation. Context is essential. A pattern’s significance increases based on where and when it appears. Even the strongest candlestick patterns need context. Always consider:
- Trend: Is it forming at the end of a clear uptrend or downtrend? Reversal patterns are more potent then.
- Volume: Did volume increase during the pattern? High volume confirms conviction.
- Support/Resistance: Does it align with key price levels? This confluence adds significant weight.
Read More: Doji Candlestick Pattern
Foundational Concepts for Reading Candlesticks
Grasping individual candle components is key before analyzing complex patterns. Each part tells a story, forming the basis for identifying the strongest candlestick patterns.
Interpreting Candle Body Size
The body’s length reflects momentum.
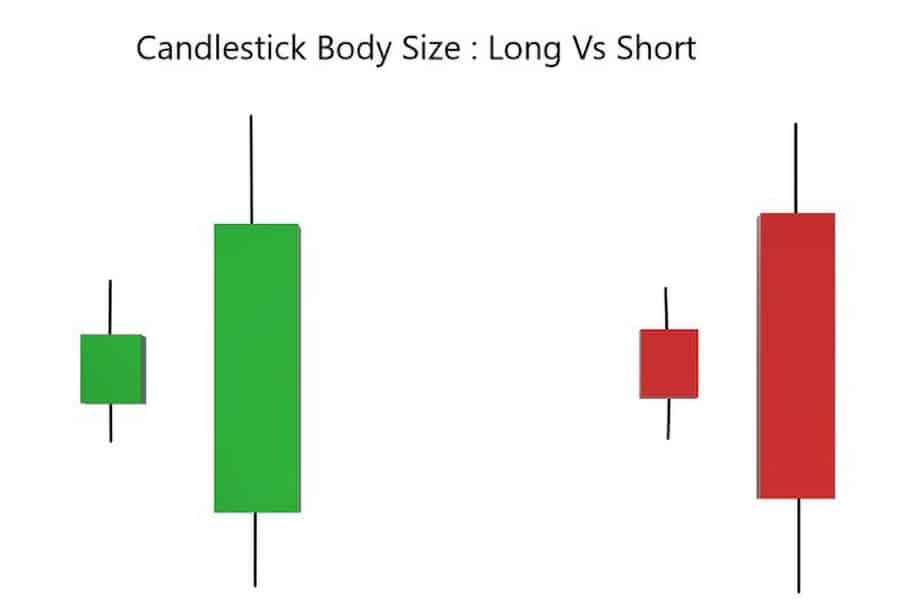
- Long Body: Indicates strong buying (green/white) or selling (red/black) pressure and decisive movement.
- Short Body: Suggests limited movement, consolidation, or indecision.
Understanding Wicks/Shadows
Wicks show price extremes that were rejected before the close.
- Long Upper Wick: Signals rejection of higher prices; sellers pushed back.
- Long Lower Wick: Signals rejection of lower prices; buyers stepped in.
- Short Wicks: Indicates trading was mostly contained within the open-close range.
Significance of Color
Color simply shows the net direction from open to close.
- Green/White (Bullish): Close higher than open; buyers won.
- Red/Black (Bearish): Close lower than open; sellers won.
The Strongest Bullish Reversal Patterns
When a market has been falling, certain patterns can signal a potential turnaround. These bullish reversal patterns suggest a downtrend might be ending, offering potential buying opportunities. Spotting these powerful candlestick patterns, especially after a significant drop, is key. They are often considered some of the strongest candlestick patterns for predicting upward moves.
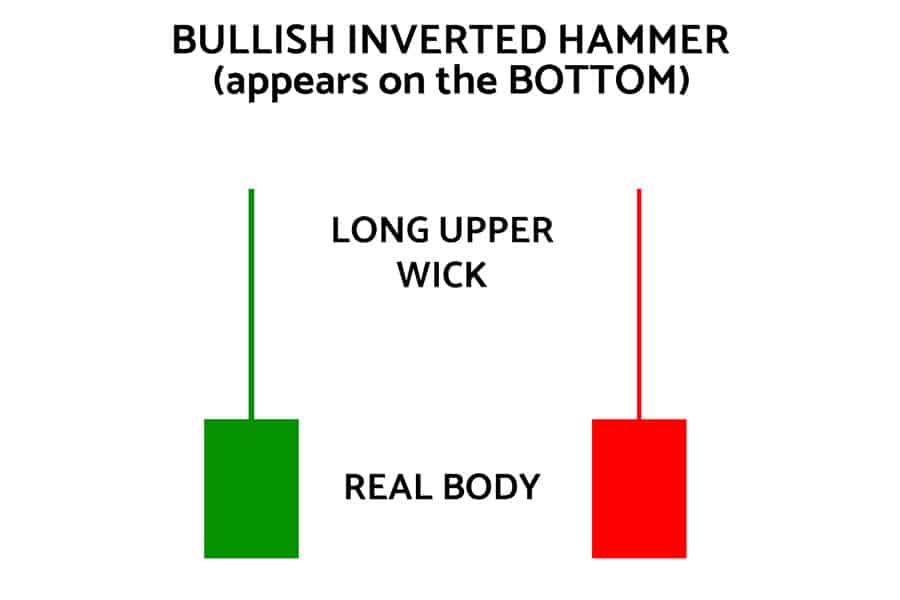
Hammer / Bullish Pin Bar
A classic single-candle signal of potential seller exhaustion and buyer resurgence. It’s frequently cited among the strongest candlestick patterns for bottoming signals.
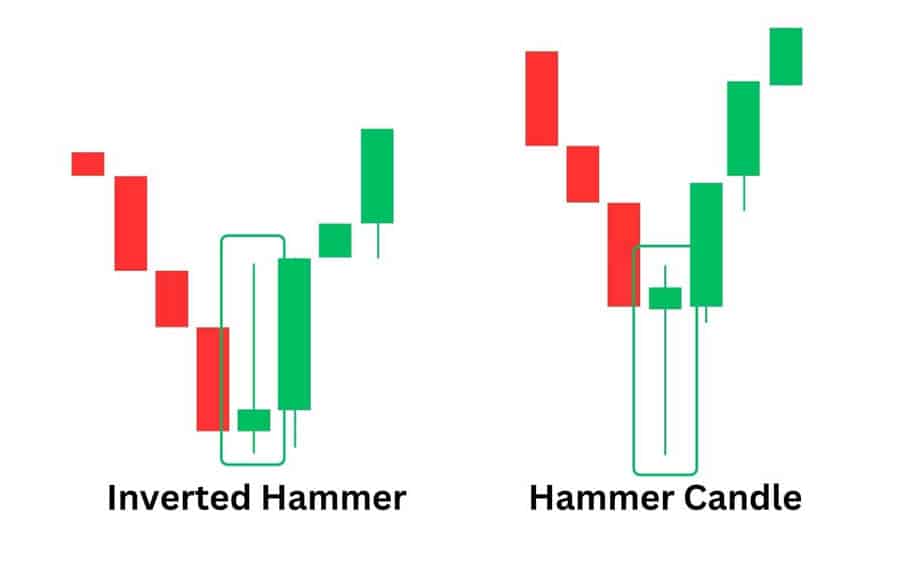
- Identification: Appears in a downtrend. Small body near the top, long lower wick (at least 2x body), little/no upper wick.
- Psychology: Sellers pushed price down significantly, but buyers drove it back up to close near the open, rejecting lower prices.
- Strength: The long lower wick visually confirms buyers absorbed selling and regained control.
- Trading: Consider entry above Hammer’s high. Stop loss below Hammer’s low.
Bullish Engulfing
A potent two-candle pattern indicating a dramatic shift to buying momentum.
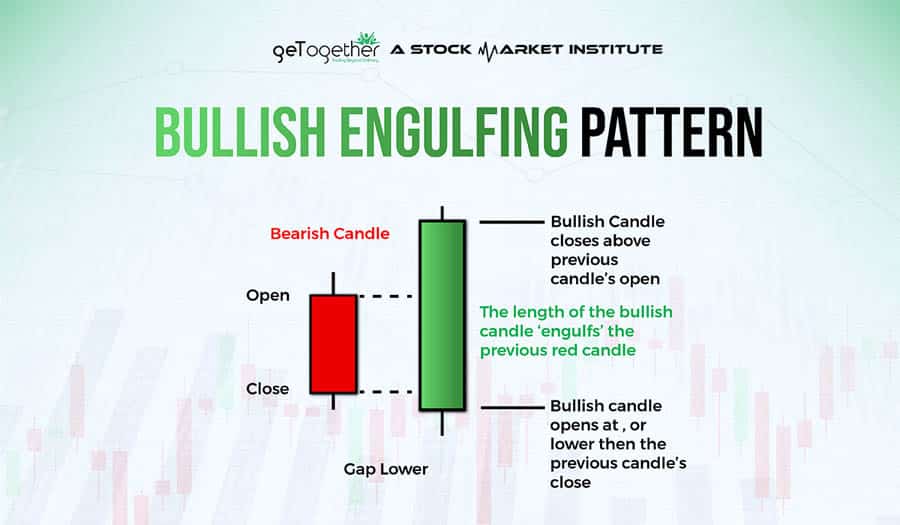
- Identification: In a downtrend, a bearish candle followed by a larger bullish candle whose body completely engulfs the first candle’s body.
- Psychology: Buyers overwhelmingly reverse the prior period’s selling pressure and close significantly higher, showing a forceful shift.
- Strength: The size dominance of the bullish candle demonstrates a decisive buyer takeover, making it one of the strongest candlestick patterns for bullish reversals.
- Trading: Entry above engulfing candle’s high. Stop loss below the pattern’s low.
Morning Star
A hopeful three-candle formation signaling a potential bottom after a downtrend.
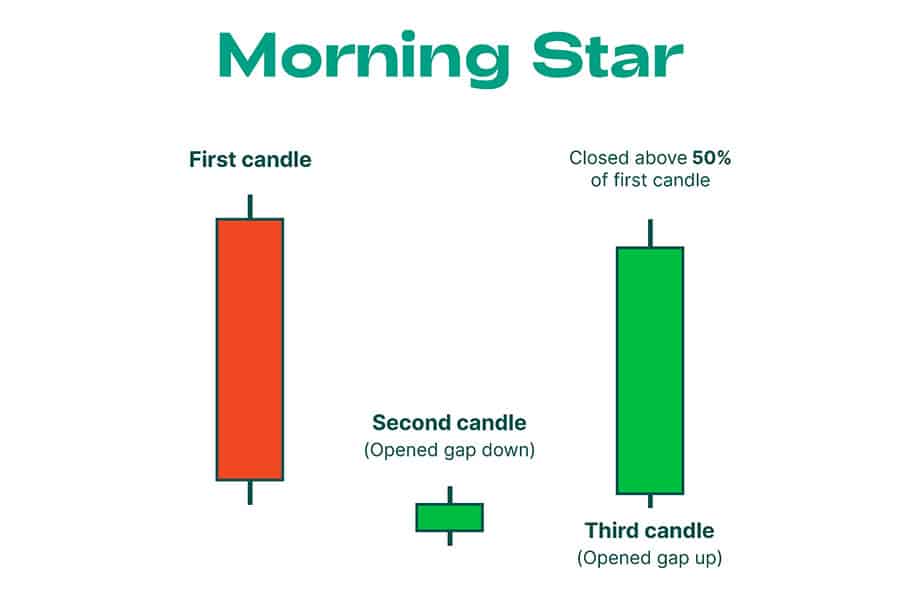
- Identification: 1. Long bearish candle. 2. Small-bodied candle (or Doji) that gaps down (ideally). 3. Long bullish candle closing well into the first candle’s body.
- Psychology: Strong selling fades into indecision, then strong buying confirms the reversal.
- Strength: Provides three-stage confirmation of a reversal. A Doji middle candle (Morning Doji Star) is often seen as stronger, contributing to the list of strongest candlestick patterns.
- Trading: Entry above the third candle’s high. Stop loss below the second candle’s low.
Three White Soldiers
A clear display of steady, confident buying emerging after a decline.
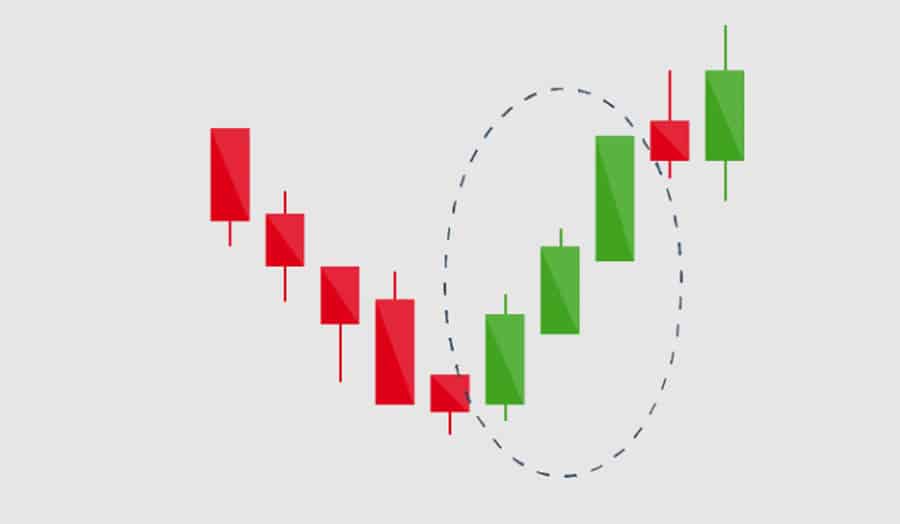
- Identification: Three consecutive long bullish candles in a downtrend, each opening within the prior body and closing progressively higher near its high.
- Psychology: Shows sustained buying pressure over three periods, signaling a strong sentiment shift.
- Strength: Consistent buying strength makes it a high-probability reversal signal. A visually obvious powerful candlestick pattern.
- Trading: Consider entry during or after the third soldier. Stop loss below the low of the second or first soldier.
Piercing Line
A two-candle bullish pattern where buyers assertively step in during a downtrend.
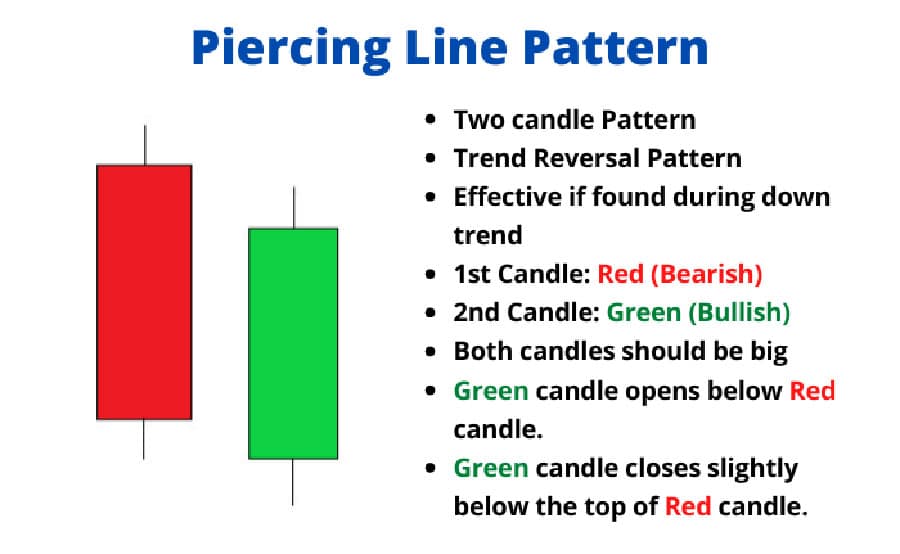
- Identification: Downtrend. 1. Strong bearish candle. 2. Bullish candle opens below the first candle’s low but closes above the midpoint of the first candle’s body.
- Psychology: Initial gap down fails as buyers rally strongly, recovering significant prior losses.
- Strength: The intraday recovery after the gap down shows significant emerging buying interest.
- Trading: Entry above the second candle’s high. Stop loss below the second candle’s low. Confirmation advised.
Tweezer Bottom
A two-candle pattern suggesting strong support is being tested and holding.
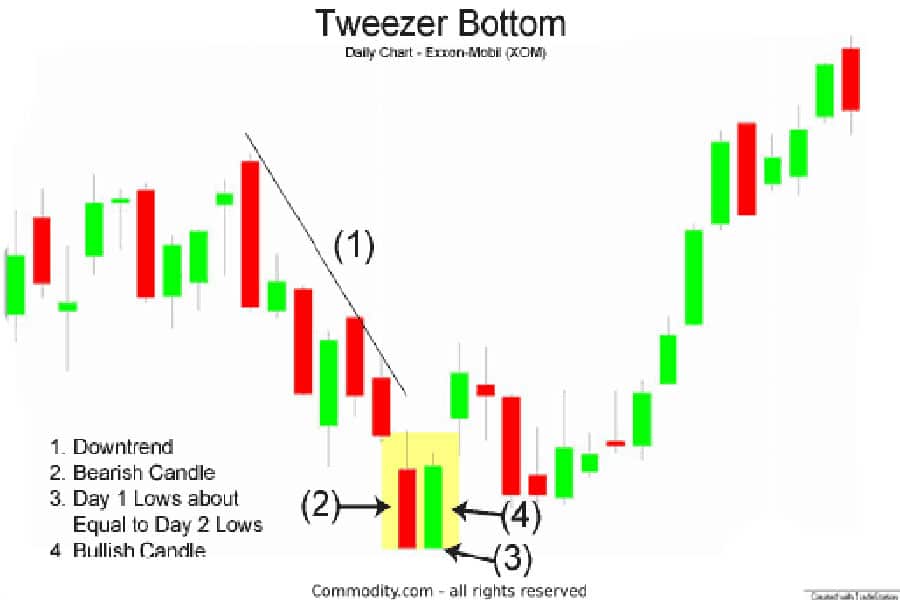
- Identification: Forms at downtrend lows. Two or more candles with matching (or very close) lows.
- Psychology: Market fails to break lower at the same level twice, indicating strong support defended by buyers.
- Strength: Double rejection of a low provides strong evidence of support holding. This confirmation elevates it among useful, sometimes considered strongest candlestick patterns for support checks.
- Trading: Consider entry after the second candle confirms the matching low, often above the pattern’s high. Stop loss just below the matching lows.
Read More: Three Inside Up Candlestick Pattern
The Strongest Bearish Reversal Patterns
Conversely, some patterns warn of potential market tops. Bearish reversal patterns suggest an uptrend may be losing steam. Identifying these powerful candlestick patterns can help time exits from long positions or signal potential short entries. When found after a strong rally, these are often viewed as the strongest candlestick patterns signaling a likely downturn.
Shooting Star / Bearish Pin Bar
The bearish counterpart to the Hammer, signaling potential buyer exhaustion at a peak.
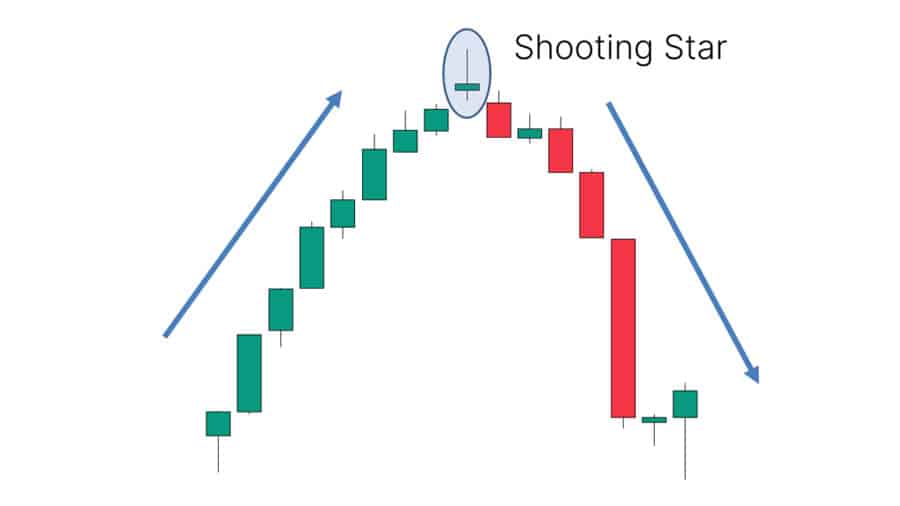
- Identification: Appears in an uptrend. Small body near the bottom, long upper wick (at least 2x body), little/no lower wick.
- Psychology: Buyers pushed price up significantly, but sellers drove it back down to close near the open, rejecting higher prices.
- Strength: The long upper wick visually confirms sellers overwhelmed buyers near the high. A strong warning sign, making it one of the strongest candlestick patterns for identifying tops.
- Trading: Consider short entry below Shooting Star’s low. Stop loss above the wick’s high.
Bearish Engulfing
A highly compelling two-candle pattern indicating a sudden shift to selling pressure.
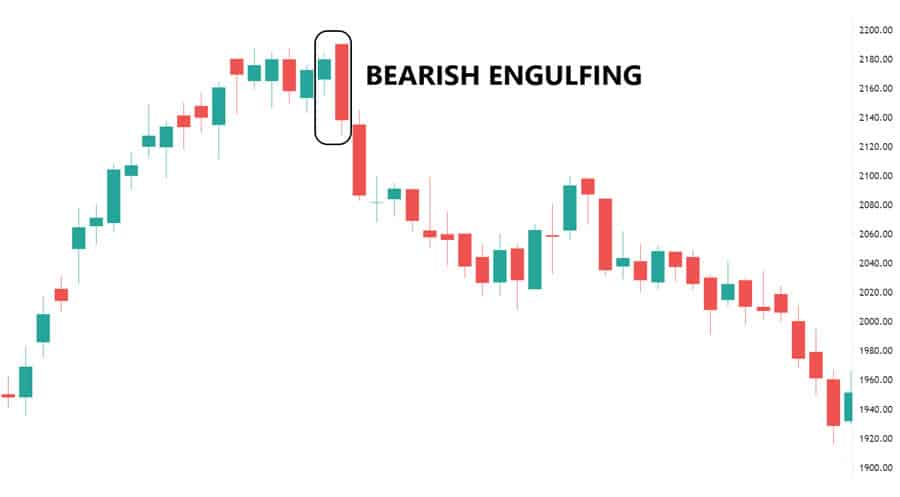
- Identification: In an uptrend, a bullish candle followed by a larger bearish candle whose body completely engulfs the first candle’s body.
- Psychology: Sellers overwhelmingly reverse the prior period’s gains and close significantly lower, showing a forceful change in control.
- Strength: The size dominance of the bearish candle shows a decisive seller takeover, ranking it among the strongest candlestick patterns for bearish reversals.
- Trading: Entry below engulfing candle’s low. Stop loss above the pattern’s high.
Evening Star
The bearish counterpart to the Morning Star, signaling potential trouble after a rally.
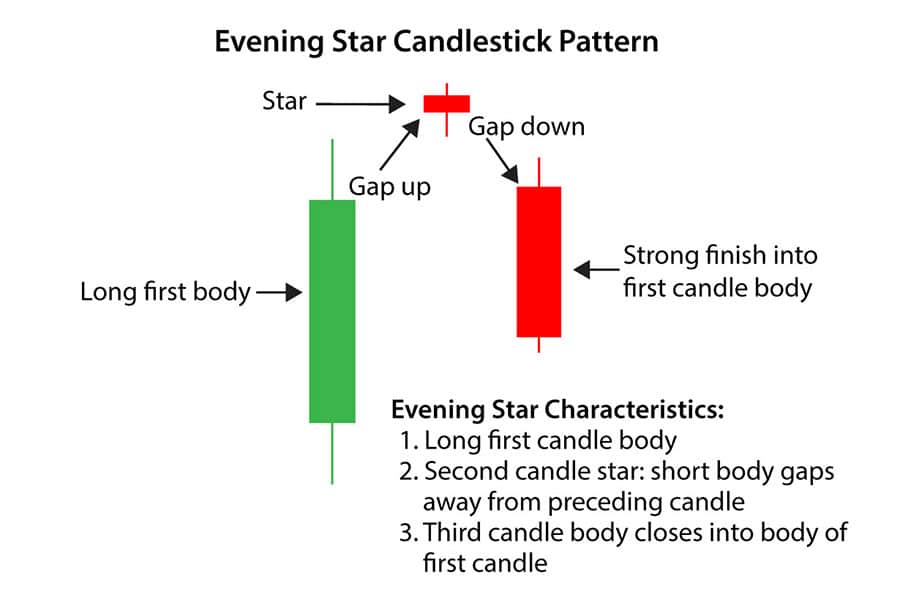
- Identification: 1. Long bullish candle. 2. Small-bodied candle (or Doji) that gaps up (ideally). 3. Long bearish candle closing well into the first candle’s body.
- Psychology: Strong buying fades into indecision, then strong selling confirms the reversal.
- Strength: Provides three-stage confirmation of a potential top. An Evening Doji Star is often considered particularly potent and ranks among the strongest candlestick patterns for bearish signals.
- Trading: Entry below the third candle’s low. Stop loss above the second candle’s high.
Three Black Crows
An ominous pattern suggesting sustained selling pressure and a potential downtrend start.
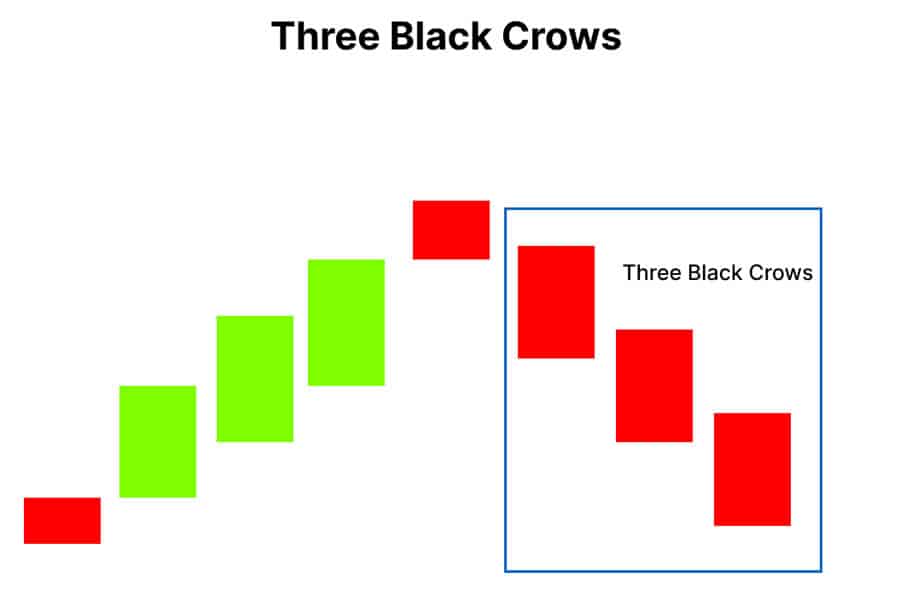
- Identification: Three consecutive long bearish candles in an uptrend, each opening within the prior body and closing progressively lower near its low.
- Psychology: Depicts relentless selling over three periods, signaling a confident reversal.
- Strength: Persistent selling makes it a high-conviction signal of a sentiment shift. A visually striking powerful candlestick pattern indicating weakness.
- Trading: Consider entry during or after the third crow. Stop loss above the high of the second or first crow.
Hanging Man
Looks like a Hammer but appears in an uptrend, acting as a warning sign.
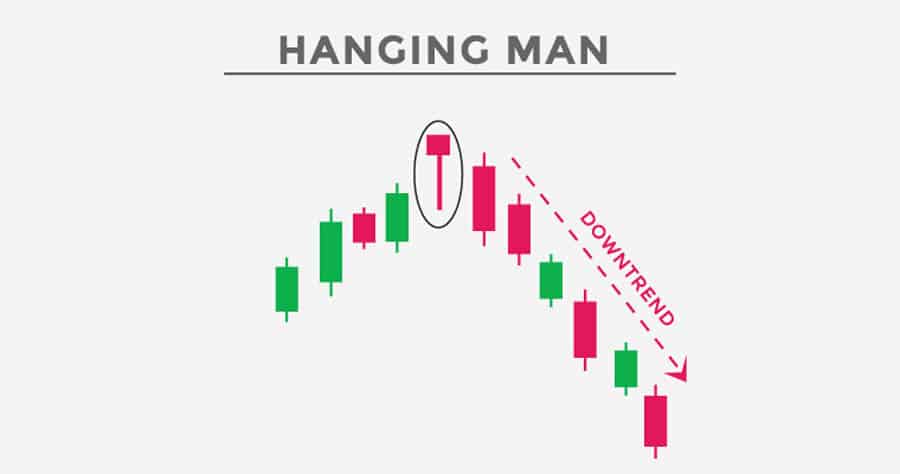
- Identification: Forms during an uptrend. Small body near the top, long lower wick, little/no upper wick. Location is key.
- Psychology: Despite closing near the high, significant selling occurred during the session (long lower wick), hinting buyers might be losing control.
- Strength (as a warning): Not definitive alone, but a significant warning in an uptrend. Needs bearish confirmation. It acts as a preliminary signal among potentially stronger patterns.
- Trading: Requires bearish confirmation (next candle closes lower). Entry might follow confirmation. Stop loss above Hanging Man’s high.
Dark Cloud Cover
A two-candle bearish pattern showing sellers making a strong comeback after an initial gap up.
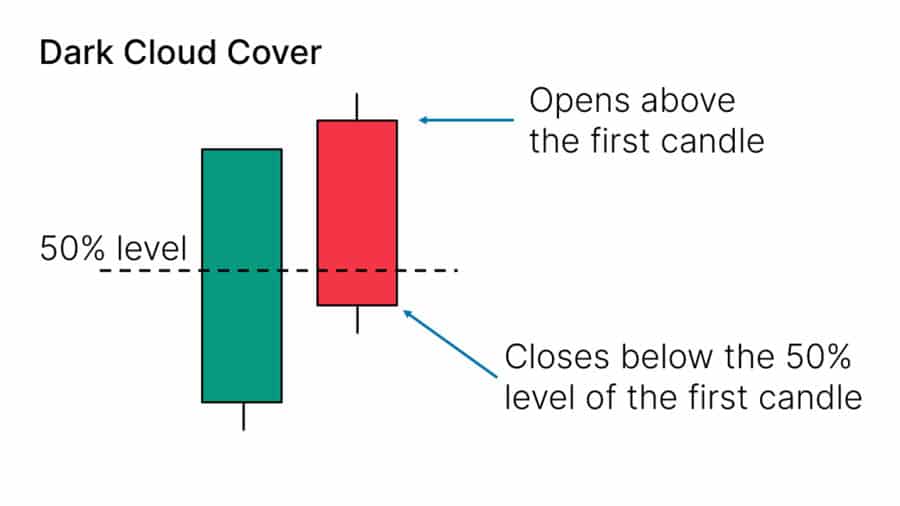
- Identification: Uptrend. 1. Strong bullish candle. 2. Bearish candle opens above the first candle’s high but closes below the midpoint of the first candle’s body.
- Psychology: Initial bullish gap fails as sellers take control, erasing more than half the prior gain.
- Strength: Failure to hold the gap up plus the deep retracement signals significant selling pressure. Many consider this one of the strongest candlestick patterns for indicating intraday reversals.
- Trading: Entry below the second candle’s low. Stop loss above the second candle’s high. Confirmation often useful.
Tweezer Top
This two-candle pattern suggests strong resistance is being hit and holding.
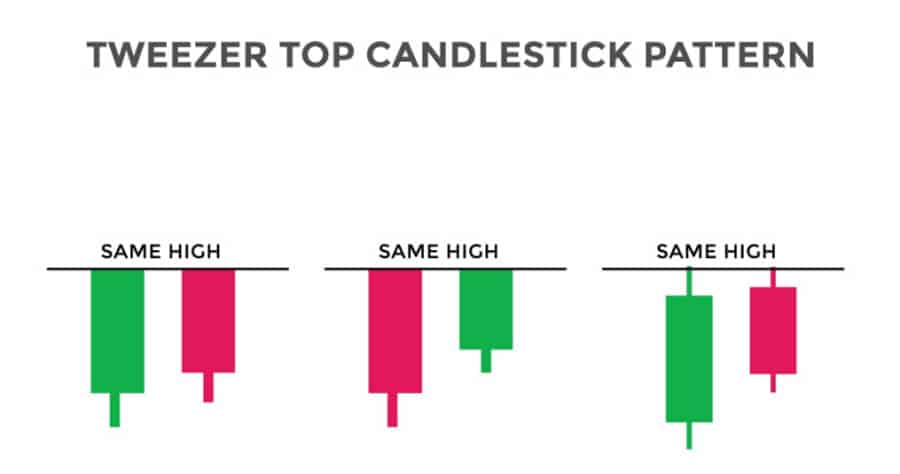
- Identification: Forms at uptrend highs. Two or more candles with matching (or very close) highs.
- Psychology: Market fails to break higher at the same level twice, indicating strong resistance defended by sellers.
- Strength: Double rejection of a high provides strong evidence of resistance. It’s a key pattern among the strongest candlestick patterns for pinpointing resistance zones.
- Trading: Consider entry after the second candle confirms the matching high, often below the pattern’s low. Stop loss just above the matching highs.
Read More: Marubozu candlestick pattern – Reviewed
Powerful Indecision / Potential Reversal Patterns
Some patterns signal a pause or balance rather than a strong reversal. These can be powerful markers, especially after trends or at key levels. Dojis exemplify this, providing context for the strongest candlestick patterns.
Doji Variations
A Doji’s defining feature is an open and close that are virtually identical, creating a cross or plus sign.
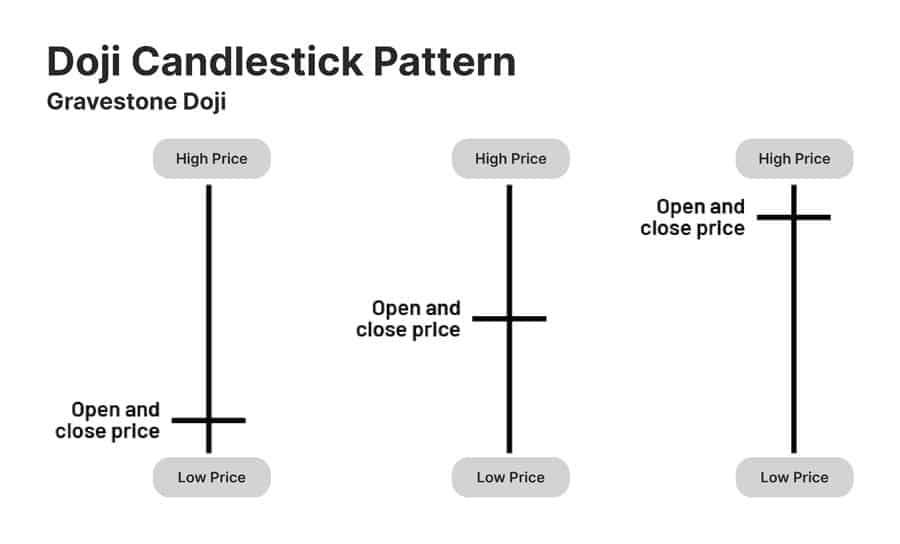
- Identification:
- Standard Doji: Cross shape, pure indecision.
- Long-Legged Doji: Long upper/lower wicks, high volatility but indecisive close.
- Dragonfly Doji: ‘T’ shape, long lower wick, rejects lows, potentially bullish at bottoms.
- Gravestone Doji: Inverted ‘T’, long upper wick, rejects highs, potentially bearish at tops.
- Psychology: Represents equilibrium; neither buyers nor sellers could dominate by the close.
- Power: Signify hesitation. After a strong trend or at support/resistance, they suggest the dominant force may be weakening, potentially preceding a reversal. They act as powerful candlestick patterns for highlighting pivot points.
- Trading: Usually require confirmation from the next candle (bullish close after Doji in downtrend, bearish close after Doji in uptrend). Trade breaks of the Doji’s range.
Factors Influencing Pattern Strength
Spotting a pattern is step one. Several factors influence the reliability of any signal, including the historically strongest candlestick patterns.
Location within the Trend
Where a pattern appears matters. Reversal patterns (Hammers, Engulfings) are more convincing after a clear, extended trend than within choppy sideways markets. Context defines the impact of even the strongest candlestick patterns.
Confirmation from Volume
High volume during pattern formation, especially on key candles, adds conviction. Low volume suggests the pattern might be less significant noise. Volume confirms the message of the strongest candlestick patterns.
Proximity to Support and Resistance
Patterns aligning with key support or resistance levels gain significant strength. This confluence (pattern + level) is a core technical analysis principle and amplifies the strongest candlestick patterns.
Confirmation from Other Indicators
Using candlesticks with other indicators (RSI, MACD, Moving Averages) filters noise and increases confidence. E.g., a bullish pattern at RSI oversold levels is stronger. Combining indicators helps validate the strongest candlestick patterns.
Timeframe Considerations
Patterns on longer timeframes (daily, weekly) generally carry more weight than those on shorter timeframes (intraday). A weekly pattern represents a more significant sentiment shift. The strongest candlestick patterns often have greater implications on higher timeframes.
How to Trade Using Strong Candlestick Patterns
Knowing the strongest candlestick patterns requires a trading plan: clear rules for entry, stop-loss placement, and profit targets.
Developing Entry Rules
Define your entry precisely. Common tactics:
- Enter on the break of the pattern’s high (bullish) or low (bearish) on the next candle (confirmation).
- Enter near the close of the pattern’s final candle.
- Wait for a minor pullback after the pattern for potentially better risk/reward.
Consistency is key when trading the strongest candlestick patterns.
Setting Stop Losses
Essential for risk management. Place stops where the pattern’s signal is invalidated:
- Below the low of a bullish pattern.
- Above the high of a bearish pattern.
- Allow slight buffer room to avoid noise-based stop-outs.
Proper stops are crucial even with the strongest candlestick patterns.
Identifying Potential Profit Targets
Determine where to exit with profit:
- Target next significant support/resistance levels.
- Use Fibonacci retracement/extension levels.
- Employ a fixed risk/reward ratio (e.g., 2:1 or 3:1).
- Use trailing stops to capture more of a trend.
Importance of Risk Management
Fundamental to survival. Never risk more than a small percentage (e.g., 1-2%) of capital per trade. Calculate position size based on stop distance and risk tolerance, even when trading the strongest candlestick patterns.
Limitations and Risks
Candlesticks are useful tools but have limitations, even the strongest candlestick patterns.
Not Foolproof: False Signals
Even reliable patterns can fail. Market conditions override technical signals. False signals are inevitable; manage risk accordingly.
Subjectivity in Identification
Applying definitions to real charts involves some interpretation. Experience helps, but borderline cases exist, even for the strongest candlestick patterns.
Importance of Not Trading in Isolation
Relying solely on candlesticks is risky. Always seek confirmation from context (trend, levels, volume, indicators). Confluence strengthens signals, making the strongest candlestick patterns more reliable.
Opofinance: Enhance Your Candlestick Trading
Using candlestick insights effectively needs a solid platform and good tools. Opofinance, regulated by ASIC, offers a secure and advanced trading environment ideal for technical analysts looking to trade the strongest candlestick patterns.
- Advanced Trading Platforms: Access top platforms like MT4, MT5, cTrader, and the user-friendly OpoTrade. All feature sophisticated charting needed to spot candlestick patterns easily.
- Innovative AI Tools: Leverage unique AI tools like the AI Market Analyzer, AI Coach, and AI Support to supplement your pattern analysis and trading strategy.
- Diverse Trading Options: Explore Social Trading to follow experienced traders or test your skills with Prop Trading programs.
- Secure & Flexible Transactions: Enjoy peace of mind with secure deposits and withdrawals, including convenient crypto payment options. Plus, Opofinance charges zero fees on these transactions.

Ready to trade the strongest candlestick patterns with a trusted broker? Check out Opofinance today!
Conclusion: Harnessing Strong Patterns
Candlestick patterns offer a visual language for market sentiment. Recognizing the strongest candlestick patterns—like Engulfings, Hammers/Shooting Stars, Morning/Evening Stars—provides high-probability clues for trend changes. Their true edge comes from smart application: analyzing within context, seeking confirmation, and embedding them in a disciplined, risk-managed strategy. Mastering these powerful candlestick patterns can significantly sharpen your ability to read the market and improve timing when seeking out the strongest candlestick patterns.
Key Takeaways
- Candlesticks show OHLC data, visually representing market psychology.
- The strongest candlestick patterns (e.g., Engulfing, Hammer/Shooting Star, Morning/Evening Star) offer historically reliable reversal signals.
- Context (trend, volume, S/R levels) is crucial for validating patterns.
- Key Bullish Reversals: Hammer, Bullish Engulfing, Morning Star, Three White Soldiers, Piercing Line, Tweezer Bottom.
- Key Bearish Reversals: Shooting Star, Bearish Engulfing, Evening Star, Three Black Crows, Hanging Man, Dark Cloud Cover, Tweezer Top.
- Dojis signal indecision, powerful near key levels or after trends.
- Always confirm patterns and manage risk strictly (stops, position sizing).
- No pattern is foolproof; expect false signals.
What is the difference between a Hammer and a Hanging Man?
They look identical (small body, long lower wick, little upper wick), but their location dictates their meaning. A Hammer forms after a downtrend and signals a potential bullish reversal. A Hanging Man forms after an uptrend and serves as a bearish warning sign, suggesting the rally might be weak.
Can candlestick patterns predict the exact price target?
Not really. Candlestick patterns primarily indicate potential shifts in direction or market indecision. They don’t usually offer specific price targets by themselves. Traders typically use other tools like established support/resistance, Fibonacci analysis, or measured moves from other chart patterns to estimate potential profit objectives after a candlestick signal appears.
How important is the ‘gap’ in patterns like the Morning/Evening Star or Piercing Line/Dark Cloud Cover?
Gaps often amplify the psychological impact. In a Morning Star, the gap down emphasizes the prior selling before the pause. In Dark Cloud Cover, the gap up highlights the initial bullish attempt that failed. While these patterns can sometimes form without clear gaps (especially in 24-hour markets like Forex where true gaps are rarer), the presence of a gap generally makes the pattern’s message more dramatic and potentially stronger.


