

Identifying support and resistance in forex trading is a crucial skill that can significantly enhance your trading performance. These key levels act as invisible barriers, influencing price movements and providing valuable insights for making informed trading decisions. In this comprehensive guide, we’ll explore effective strategies for identifying support and resistance in forex, helping you navigate the complex world of currency trading with confidence. If you’re seeking a reliable broker for forex trading, choosing the right partner can further improve your trading experience and success.

Support and resistance levels are price points where the market tends to pause or reverse direction. Support acts as a floor, preventing prices from falling further, while resistance acts as a ceiling, restraining upward price movements. By learning how to identify strong support and resistance levels, traders can better anticipate potential trend reversals, breakouts, and optimal entry and exit points.
Throughout this article, we’ll delve into various techniques for identifying resistance and support levels, equipping you with the knowledge to enhance your forex trading strategy. Whether you’re a novice trader or looking to refine your skills, mastering the art of support and resistance analysis will undoubtedly give you an edge in the competitive forex market.
1. Price Action Analysis: The Foundation of Support and Resistance
Price action analysis forms the bedrock of identifying support and resistance levels in forex trading. This technique involves studying historical price movements to pinpoint areas where the market has repeatedly reversed or stalled.
Key aspects of price action analysis include:
a) Swing highs and lows: These are local peaks and troughs in price movement. Multiple swing highs at a similar level can indicate resistance, while multiple swing lows suggest support.
b) Round numbers: Psychological levels often coincide with round numbers (e.g., 1.3000, 1.3500) and can act as support or resistance.
c) Previous day’s high and low: These levels often serve as significant support and resistance points for intraday trading.
By mastering price action analysis, you’ll develop a keen eye for potential support and resistance levels, allowing you to make more informed trading decisions.
Read More: Identify Imbalance in Forex
Identifying Significant Historical Levels
When analyzing historical price levels, pay attention to:
- Major market reversals
- Prolonged consolidation periods
- Previous all-time highs and lows
- Yearly, quarterly, and monthly opens and closes
These levels often hold significance in traders’ collective memory and can act as strong support or resistance points in the future.
The Concept of Support Turned Resistance (and Vice Versa)
When a significant support level is breached, it often becomes a resistance level in the future. Similarly, when a strong resistance level is broken, it may turn into support. This concept, known as “role reversal,” is crucial for understanding how historical levels continue to influence price action.
2. Trendlines: Connecting the Dots
Trendlines are powerful tools for identifying dynamic support and resistance levels. To draw a trendline:
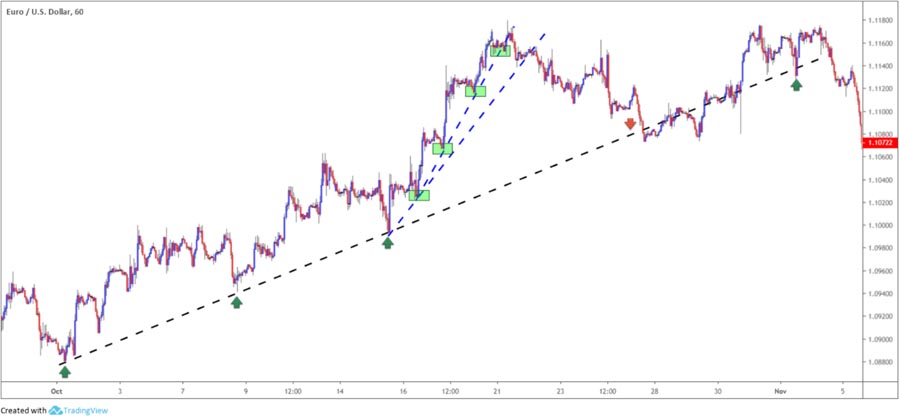
a) For an uptrend: Connect at least two significant low points. b) For a downtrend: Connect at least two significant high points.
The resulting line acts as a dynamic support (in an uptrend) or resistance (in a downtrend). Trendlines help traders visualize the overall market direction and potential reversal points.
Pro tip: The more times a trendline is touched without being broken, the stronger it becomes as a support or resistance level.
3. Moving Averages: Dynamic Support and Resistance
Moving averages (MAs) are popular indicators that smooth out price action and can act as dynamic support and resistance levels. Common MAs used in forex trading include:
a) 50-day MA b) 100-day MA c) 200-day MA
When price approaches these moving averages, it often encounters support or resistance. Traders can use this information to anticipate potential bounces or breakouts.
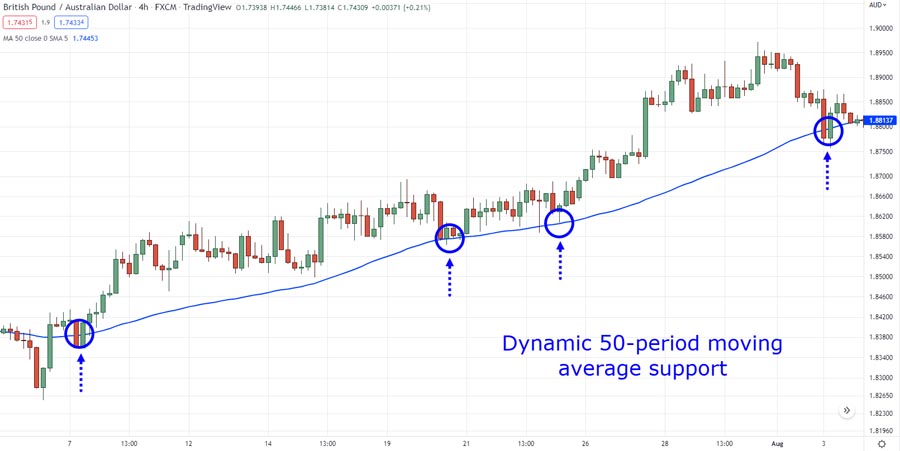
Example: If a currency pair is trading above its 200-day MA, the MA may act as support during pullbacks. Conversely, if the pair is trading below the 200-day MA, it may act as resistance during rallies.
Types of Trendlines
- Standard Trendlines: As described earlier, connecting swing lows in uptrends or swing highs in downtrends.
- Channel Trendlines: Parallel lines that contain price action, with the lower line acting as support and the upper line as resistance.
- Fan Lines: Multiple trendlines drawn from a significant low or high point, creating a fan-like structure that can identify potential support and resistance levels.
Read More: Identify Imbalance in Forex
Trendline Breaks
A break of a significant trendline can signal a potential trend reversal or pause. However, it’s essential to consider:
- The strength of the break (volume and momentum)
- Whether the break is confirmed by subsequent price action
- Other supporting technical indicators
False breaks are common, so always look for confirmation before making trading decisions based on trendline breaks.
4. Moving Averages: Adaptive Support and Resistance
Moving averages (MAs) smooth out price action and can act as dynamic support and resistance levels. Popular MAs in forex include:
- 50-day MA
- 100-day MA
- 200-day MA
When price approaches these moving averages, it often encounters support or resistance. The 200-day MA is particularly significant, often acting as a long-term trend indicator.
5. Fibonacci Retracements: Hidden Harmonic Levels
Fibonacci retracements reveal potential support and resistance levels based on the golden ratio. To use this method:
- Identify a significant price move (swing low to swing high or vice versa)
- Draw Fibonacci retracement levels (23.6%, 38.2%, 50%, 61.8%, and 78.6%)
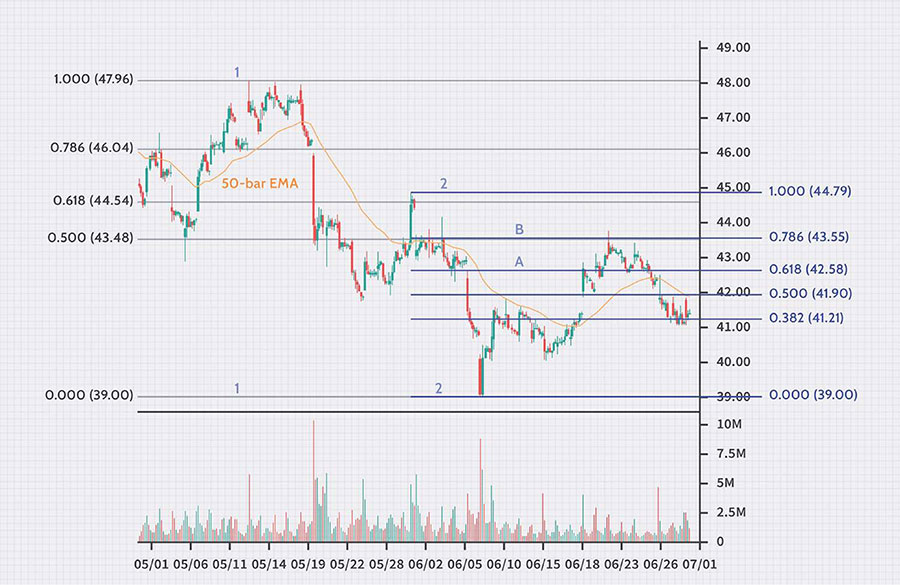
These levels often coincide with areas where price may find support or resistance during retracements. The 38.2% and 61.8% levels are particularly worth watching
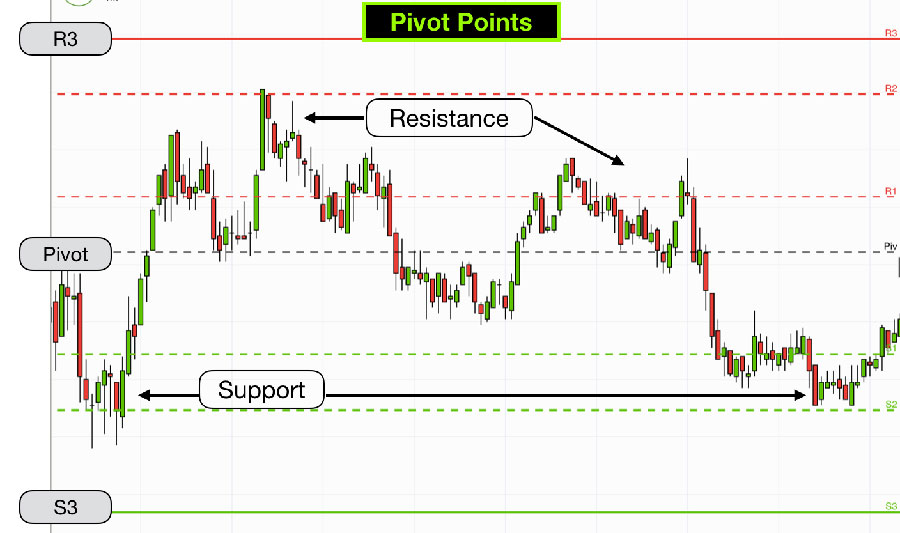
6. Pivot Points: Daily Support and Resistance
Pivot points provide a set of potential support and resistance levels for the current trading day. The basic pivot point (PP) is calculated as:
PP = (High + Low + Close) / 3
From the PP, you can derive additional support (S1, S2) and resistance (R1, R2) levels. These levels are especially useful for day traders and short-term position traders.
Read More: Identify Imbalance in Forex
Using Pivot Points in Trading
- Breakout Strategy: If price breaks above R1, consider going long with a target at R2. If it breaks below S1, consider going short with a target at S2.
- Range Trading: Buy near support levels and sell near resistance levels when the market is range-bound.
- Trend Confirmation: In an uptrend, pivot points can act as support levels. In a downtrend, they can serve as resistance levels.
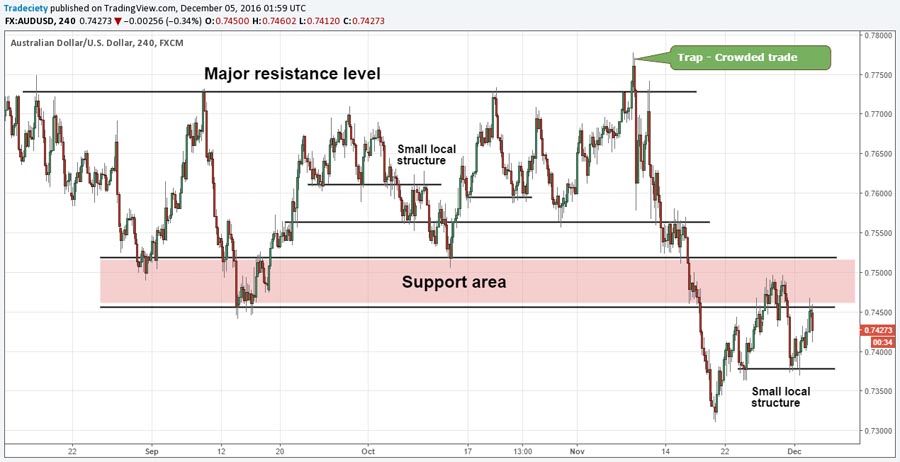
7. Horizontal Levels: Historical Support and Resistance
Horizontal levels are straightforward yet effective ways to identify support and resistance. These are price levels where the market has repeatedly reversed or consolidated in the past. To find horizontal levels:
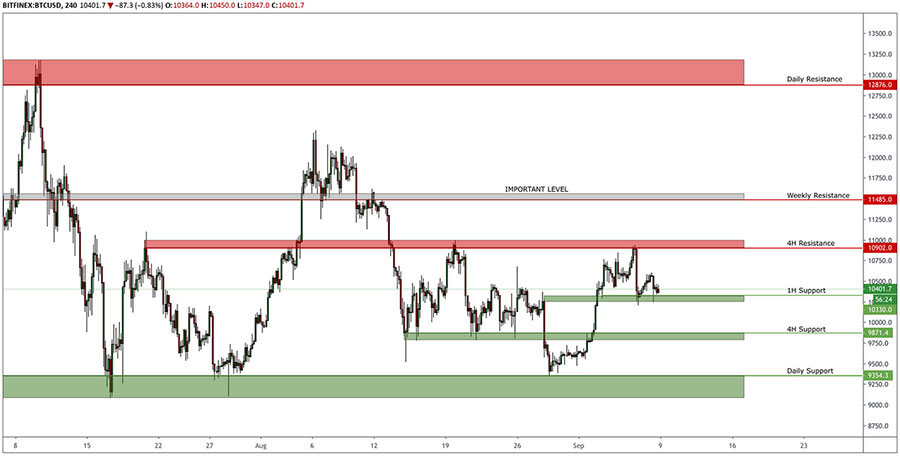
a) Identify price points where the market has reversed multiple times. b) Draw horizontal lines at these levels. c) Pay attention to areas where multiple timeframes show the same level.
The more times a horizontal level has been tested, the stronger it becomes as a potential support or resistance area.
8. Chart Patterns: Formation-Based Support and Resistance
Certain chart patterns inherently create support and resistance levels:
- Head and Shoulders: The neckline often becomes a crucial support or resistance level
- Double Tops/Bottoms: The peaks or troughs form strong resistance or support
- Triangles: The upper and lower trendlines of triangles act as dynamic resistance and support
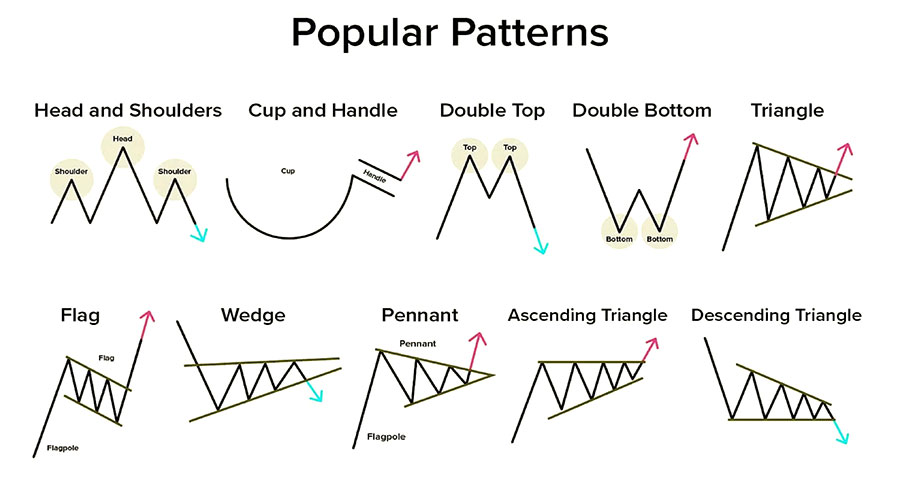
Recognizing these patterns can help you anticipate where price might encounter obstacles or find support.
Additional Chart Patterns
- Cup and Handle: The rim of the cup often acts as resistance until broken, after which it may become support.
- Flags and Pennants: The upper and lower boundaries of these continuation patterns can act as short-term support and resistance.
- Rectangles: In this consolidation pattern, the upper and lower boundaries clearly define resistance and support levels.
- Wedges: Rising and falling wedges provide dynamic support and resistance levels as price consolidates.
The Importance of Pattern Completion
Not all patterns complete as expected. Always wait for confirmation of a pattern break before making trading decisions. False breakouts are common and can lead to significant losses if not managed properly.
9. Previous Day’s High and Low
For short-term traders, the previous day’s high and low often serve as significant support and resistance points. These levels are particularly useful for day traders and can help in setting intraday targets and stop-loss levels.
Combining Methods for Stronger Confirmation
While each of these techniques can be powerful on its own, combining multiple methods often provides stronger confirmation of support and resistance levels. For example:
- A horizontal support level coinciding with a Fibonacci retracement level
- A trendline intersecting with a moving average
- A pivot point aligning with a high-volume node from volume profile analysis
By looking for confluence between different techniques, traders can increase their confidence in potential support and resistance levels.
Advanced Techniques for Identifying Support and Resistance
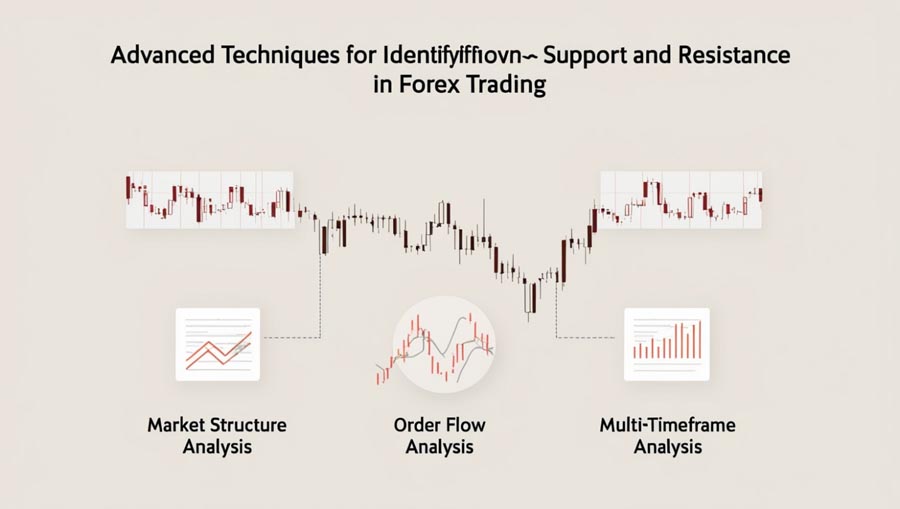
1. Market Structure Analysis
Analyzing market structure involves identifying higher highs and higher lows in uptrends, or lower highs and lower lows in downtrends. This approach helps traders identify key swing points that often act as support or resistance.
2. Order Flow Analysis
Order flow analysis involves studying the interaction between buying and selling pressure at specific price levels. This can be done by analyzing:
- The depth of market (DOM)
- Time and sales data
- Footprint charts
While more complex, this approach can provide valuable insights into potential support and resistance levels based on real-time market activity.
3. Multi-Timeframe Analysis
Combining support and resistance levels from multiple timeframes can provide a more comprehensive view of potential price barriers:
- Start with a higher timeframe to identify major levels
- Move to lower timeframes to fine-tune entry and exit points
- Look for confluence between levels on different timeframes
This approach helps traders understand the “big picture” while also focusing on short-term opportunities.
Conclusion
Mastering the art of identifying support and resistance in forex trading is a crucial step towards becoming a successful trader. By employing the seven proven techniques outlined in this guide – price action analysis, trendlines, moving averages, Fibonacci retracements, pivot points, volume profile, and horizontal levels – you can significantly enhance your ability to spot key price levels and make informed trading decisions.

Remember that support and resistance levels are not fixed barriers but dynamic areas that can shift based on market conditions. Continuously refine your skills, combine multiple techniques for stronger confirmation, and always consider the broader market context when making trading decisions.
By integrating these strategies into your forex trading approach, you’ll be better equipped to identify potential trend reversals, breakouts, and optimal entry and exit points. This knowledge will not only improve your trading performance but also boost your confidence in navigating the complex world of currency markets.
As you continue to practice and refine your skills in identifying support and resistance levels, you’ll develop a deeper understanding of market dynamics and be better positioned to capitalize on trading opportunities. Stay disciplined, manage your risk effectively, and never stop learning – these are the hallmarks of successful forex traders who have mastered the art of support and resistance analysis.
How do I determine the strength of a support or resistance level?
The strength of a support or resistance level can be assessed by considering several factors:
Number of touches: The more times a level has been tested without breaking, the stronger it becomes.
Timeframe: Levels identified on higher timeframes (e.g., daily, weekly) are generally stronger than those on lower timeframes.
Volume: Higher trading volume at a level often indicates stronger support or resistance.
Multiple confirmations: When different analysis techniques point to the same level, it’s typically considered stronger.
Historical significance: Levels that have repeatedly acted as support or resistance in the past are often respected by traders.
Remember that no support or resistance level is absolute, and even strong levels can be broken under the right market conditions.
Should I use support and resistance levels for entry points or exit points?
Support and resistance levels can be valuable for both entry and exit points, depending on your trading strategy:
For entries:
Buy near support levels in an uptrend
Sell near resistance levels in a downtrend
Enter on breakouts above resistance or below support
For exits:
Take profits as price approaches key resistance levels in long trades
Take profits as price nears support levels in short trades
Use support and resistance levels to set stop-loss orders
The key is to combine these levels with other technical and fundamental analysis to make well-informed trading decisions.
How often should I redraw or adjust my support and resistance levels?
The frequency of redrawing or adjusting support and resistance levels depends on several factors:
Market volatility: In highly volatile markets, you may need to adjust levels more frequently.
Timeframe: Lower timeframes may require more frequent adjustments than higher timeframes.
Significant market events: Major economic releases or geopolitical events can shift support and resistance levels.
Breakouts: When a level is decisively broken, it often needs to be redrawn or its role may change (e.g., former resistance becoming new support).


