Mastering the volume indicator in Forex trading is essential for improving your trading performance and making more informed decisions. Volume indicators help traders analyze the strength of market trends, identify potential reversals, and understand market sentiment by measuring the level of buying and selling activity. When used alongside a regulated forex broker, these tools become even more reliable. In this article, we’ll explore how volume indicators like On-Balance Volume (OBV), Money Flow Index (MFI), and Volume-Weighted Average Price (VWAP) can enhance your trading strategies, allowing you to capitalize on profitable opportunities and reduce risks. By integrating these tools into your trading plan, you’ll gain a deeper insight into market dynamics and improve your chances of success.
The Importance of Volume in Forex Trading
Volume represents the total number of contracts or shares traded for a specific financial asset during a given period. In Forex trading, it indicates the number of times a currency pair is bought or sold within a time frame. Understanding volume is vital because it reflects the market’s interest in a particular currency pair.

Key Aspects of Volume
- Market Sentiment: High volume indicates strong market interest and consensus on price direction.
- Trend Confirmation: Volume helps confirm the strength of a trend. A rising price accompanied by high volume suggests a robust uptrend.
- Reversal Signals: Unusual changes in volume can signal potential reversals, providing early entry or exit points.
Ignoring volume can lead to missed opportunities or misinterpreted signals, affecting your trading performance.
Read More: MACD Indicator in Forex Trading
Understanding Volume Indicators in Forex Trading
The Forex market is decentralized, making it challenging to obtain accurate volume data. Unlike stock markets, where actual trade volumes are available, Forex relies on tick volume, which counts the number of price changes during a trading session. While not exact, tick volume serves as a reliable proxy for real volume, reflecting the level of market activity.
Importance of Volume Indicators
The most important aspect of volume indicators is their ability to reveal the strength of a market move. High volume often signifies strong investor interest, indicating that a price movement is likely to continue. Conversely, low volume may suggest a lack of conviction, signaling potential reversals.
How to Use Common Volume Indicators in Forex Trading
Implementing volume indicators effectively requires a strategic approach. By understanding how each indicator works and applying appropriate strategies, you can enhance your trading decisions.
On-Balance Volume (OBV)
How It Works:
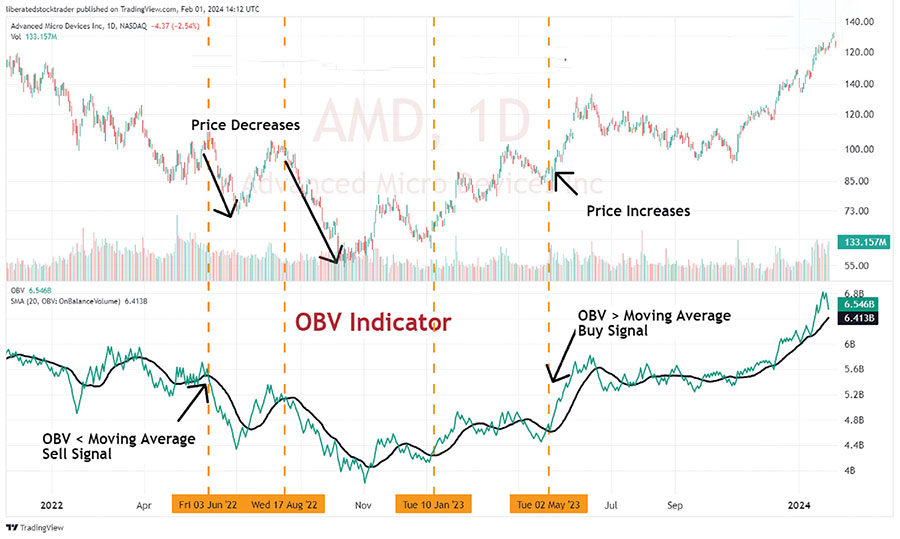
OBV is a cumulative indicator that adds volume on up days and subtracts it on down days. It reflects the buying and selling pressure, providing insights into market sentiment.
Strategy:
- Trend Confirmation:
- Application: When both OBV and price are making higher peaks and troughs, the upward trend is likely to continue.
- Example: If the EUR/USD price is rising and the OBV line is also ascending, it confirms strong buying pressure.
- Divergence Signals:
- Application: If OBV rises while the price falls, it may indicate accumulation and a potential bullish reversal.
- Example: A declining GBP/USD price with a rising OBV could signal that smart money is buying, anticipating a price increase.
Actionable Tips:
- Monitor OBV Trends: Regularly compare the OBV line with price movements to identify confirmations or divergences.
- Combine with Support/Resistance Levels: Use OBV in conjunction with key price levels to validate potential breakouts or reversals.
By monitoring OBV, traders can anticipate price movements and align their positions accordingly.
Read More: Moving Average Indicator in Forex
Money Flow Index (MFI)
How It Works:
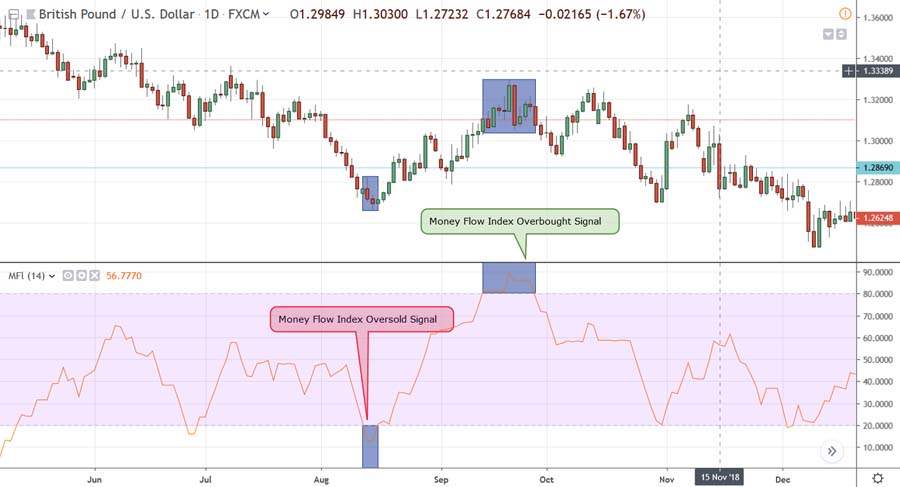
MFI is a momentum indicator that uses both price and volume data to identify overbought or oversold conditions. It’s often referred to as the volume-weighted RSI.
Strategy:
- Overbought/Oversold Conditions:
- Application: An MFI above 80 suggests overbought conditions; below 20 indicates oversold conditions.
- Example: If the USD/JPY MFI reaches 85, it may be time to consider selling, anticipating a price drop.
- Divergence Signals:
- Application: A divergence between MFI and price may signal an impending reversal.
- Example: If the price of AUD/USD is rising but MFI is falling, it could indicate weakening buying pressure.
Actionable Tips:
- Set Alert Levels: Configure alerts for MFI crossing key thresholds (20 and 80) to catch potential reversal points.
- Validate with Price Action: Always confirm MFI signals with candlestick patterns or other price action indicators.
Incorporating MFI helps traders spot potential reversal points, optimizing entry and exit strategies.
Volume Rate of Change (VROC)
How It Works:
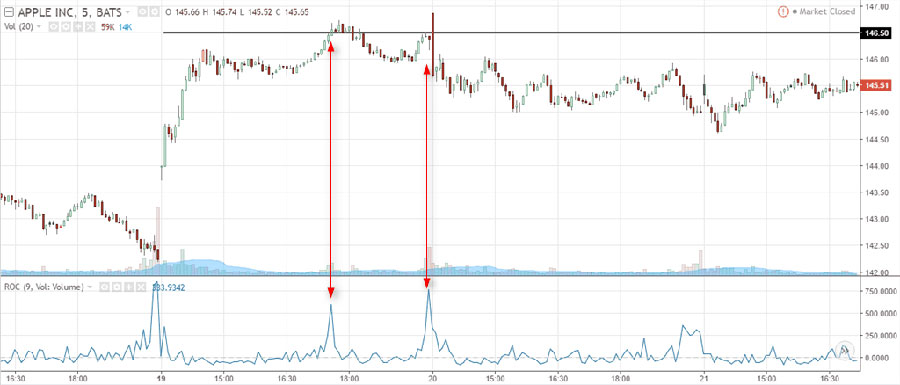
VROC measures the percentage change in volume over a given period. It highlights significant shifts in market activity.
Strategy:
- Identify Breakouts:
- Application: A sharp increase in VROC can signal a potential breakout, providing early entry opportunities.
- Example: A sudden VROC spike in EUR/GBP could indicate an upcoming breakout from a consolidation phase.
- Assess Trend Strength:
- Application: Sustained high VROC levels during a trend confirm its strength.
- Example: In a strong USD/CAD uptrend, consistently high VROC supports continued bullish momentum.
Actionable Tips:
- Watch for Extremes: Pay attention to extreme VROC values that deviate significantly from the norm.
- Use in Multiple Time Frames: Analyze VROC across different time frames to understand both short-term and long-term volume trends.
Using VROC allows traders to detect sudden changes in volume that could precede major price movements.
Volume-Weighted Average Price (VWAP)
How It Works:
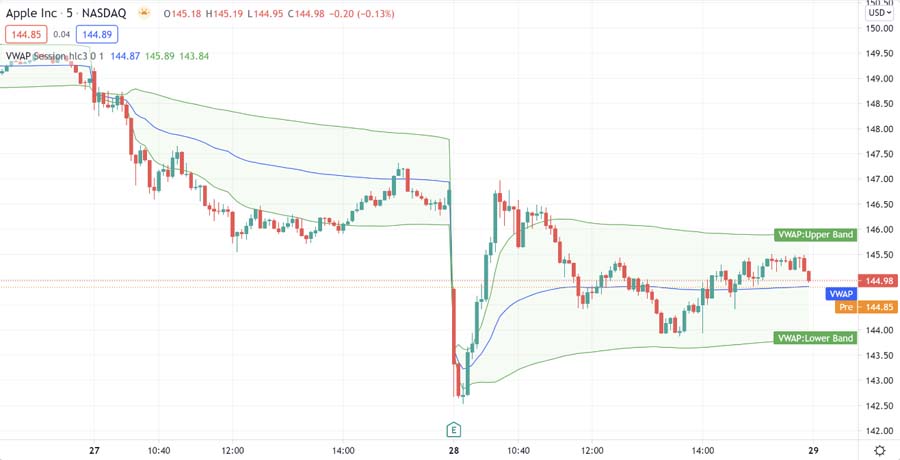
VWAP calculates the average price of a currency pair weighted by volume. It provides a benchmark for the average price traders paid during a session.
Strategy:
- Entry and Exit Points:
- Application: Buy when the price crosses above VWAP and volume increases; sell when the price crosses below VWAP with rising volume.
- Example: If the price of NZD/USD moves above the VWAP line with increasing volume, it may be a signal to enter a long position.
- Institutional Benchmarking:
- Application: Use VWAP to align your trades with institutional activity, as many large traders use VWAP as a benchmark.
Actionable Tips:
- Avoid Trading Against VWAP: Be cautious when trading against the VWAP trend, as it may indicate strong institutional pressure.
- Combine with Other Indicators: Use VWAP alongside moving averages or Bollinger Bands for enhanced analysis.
VWAP helps traders make more informed decisions by considering both price and volume.
Accumulation/Distribution Line (A/D Line)
How It Works:
The A/D Line measures the cumulative flow of money into and out of a currency pair, indicating buying or selling pressure.
Strategy:
- Trend Confirmation:
- Application: A rising A/D Line confirms an uptrend; a falling line confirms a downtrend.
- Example: If the A/D Line for USD/CHF is rising while the price is increasing, it supports the bullish trend.
- Spotting Divergences:
- Application: Divergences between the A/D Line and price can signal potential reversals.
- Example: A declining A/D Line while EUR/JPY price rises may warn of an impending bearish reversal.
Actionable Tips:
- Monitor Volume Flow: Pay attention to the direction of the A/D Line relative to price movements.
- Use with Candlestick Patterns: Confirm A/D Line signals with reversal patterns like Doji or Hammer for stronger validation.
The A/D Line provides deeper insights into market sentiment and helps validate trends.
Integrating Volume Indicators into Your Trading Plan
To effectively incorporate volume indicators into your trading plan, follow these steps:
- Set Clear Objectives: Define what you aim to achieve with volume analysis, such as confirming trends or identifying reversals.
- Customize Indicators: Adjust indicator settings to suit your trading style and the currency pairs you trade.
- Backtesting:
- Actionable Step: Use historical data to test your strategies. Platforms like MetaTrader 5 allow you to simulate trades using past market conditions.
- Risk Management:
- Actionable Step: Always use stop-loss orders and manage your risk exposure, limiting losses to a predetermined percentage of your capital.
Integrating volume indicators enhances your trading plan, providing a more comprehensive market analysis.
Advanced Strategies Using Volume Indicators

Combining Volume Indicators with Price Action
Strategy:
- Volume Spikes with Price Patterns:
- Application: Identify volume spikes accompanying key price patterns like breakouts or reversals.
- Example: A breakout from a consolidation pattern in GBP/USD accompanied by high volume may indicate a strong move.
Actionable Tips:
- Wait for Confirmation: Ensure that volume supports the price action before entering a trade.
- Use Multiple Indicators: Confirm signals with at least two indicators to reduce false positives.
Trading sessions and news events can significantly impact volume indicators. Combining them with price action strategies can lead to more reliable trading decisions.
Trading Sessions and Volume
Strategy:
- Session Analysis:
- Application: Understand how different trading sessions (Asian, European, American) affect volume and volatility.
- Example: Major currency pairs like EUR/USD typically see higher volume during the European and American sessions.
Actionable Tips:
- Adjust Strategies Accordingly: Use high-volume periods for breakout strategies and low-volume periods for range trading.
- Be Mindful of News Releases: High-impact economic news can cause sudden volume surges; plan your trades to avoid unexpected volatility.
Adapting your strategies to trading sessions and news events can enhance your use of volume indicators.
Common Pitfalls and How to Avoid Them
Overreliance on Volume Indicators
Pitfall:
Depending solely on volume indicators without considering other market factors can lead to inaccurate predictions.
Solution:
- Use a Holistic Approach: Combine volume analysis with fundamental analysis, considering economic indicators and geopolitical events.
Balancing volume indicators with other forms of analysis ensures a more accurate trading strategy.
Misinterpreting Low Volume
Pitfall:
Assuming that low volume always signals a reversal can be misleading.
Solution:
- Contextual Analysis: Consider the broader market context, such as time of day or economic events that may impact volume levels.
- Avoid Hasty Decisions: Wait for additional confirmation before acting on low-volume signals.
Understanding the context behind volume changes prevents erroneous trading decisions.
Ignoring Market Liquidity
Pitfall:
Failing to account for liquidity can result in slippage and poor trade execution.
Solution:
- Trade Major Pairs: Focus on currency pairs with high liquidity to ensure more reliable volume data.
- Use Limit Orders: Implement limit orders to control entry and exit prices, reducing the impact of slippage.
Ensuring adequate liquidity in your trades enhances execution quality and reduces risks.
Being aware of these pitfalls helps you make more informed trading decisions and avoid costly mistakes.
Case Study: Leveraging Volume Indicators for Profitable Trades

Scenario:
A trader observes that the EUR/USD has been in a consolidation phase, trading within a tight range. Suddenly, during the European session, there’s a significant spike in volume accompanied by a breakout above the resistance level.
Analysis:
- Volume Spike: The increased volume suggests strong buying interest and validates the breakout.
- Entry Point: The trader enters a long position immediately after the breakout is confirmed.
- Risk Management: A stop-loss is placed below the former resistance level, now acting as support.
- Outcome: The price continues to rise, resulting in a profitable trade.
Lessons Learned:
- Volume Confirms Breakouts: High volume during breakouts reduces the risk of false signals.
- Timely Execution: Acting promptly on volume signals can capture significant market moves.
- Effective Risk Management: Setting appropriate stop-loss levels protects against unexpected reversals.
This example illustrates the power of volume analysis in identifying lucrative trading opportunities.
Read More: Fractals Indicator in Forex Trading
Best Practices for Using Volume Indicators
- Stay Informed:
- Actionable Step: Regularly follow economic calendars and news outlets to stay updated on events that may affect volume.
- Practice Patience:
- Actionable Step: Wait for volume confirmation before entering or exiting trades, avoiding impulsive decisions.
- Continuous Learning:
- Actionable Step: Participate in webinars, read books, and engage with trading communities to enhance your understanding.
- Leverage Technology:
- Actionable Step: Use advanced trading platforms that offer real-time volume data and analytical tools.
Adhering to best practices enhances your proficiency in using volume indicators, contributing to trading success.
Opofinance: Your Trusted ASIC-Regulated Forex Broker
When it comes to implementing advanced trading strategies like volume analysis, partnering with a reliable broker is essential. Opofinance, an ASIC-regulated broker, offers a secure and transparent trading environment. As an official member of the MT5 brokers list, Opofinance provides cutting-edge platforms equipped with advanced analytical tools, including volume indicators.

Key Features of Opofinance:
- Advanced Trading Platforms:
- Benefit: Access to MetaTrader 5 with comprehensive charting tools and real-time volume data.
- Social Trading Service:
- Benefit: Follow and replicate the strategies of successful traders, accelerating your learning curve.
- Safe Transactions:
- Benefit: Enjoy safe and convenient deposit and withdrawal methods, including multiple payment options like bank transfers, credit cards, and e-wallets.
- Regulatory Compliance:
- Benefit: ASIC regulation ensures adherence to strict financial standards and client fund protection.
Why Choose Opofinance?
- Educational Resources: Access to webinars, tutorials, and market analysis to enhance your trading skills.
- Customer Support: Dedicated support team available 24/5 to assist with any queries or issues.
- Competitive Spreads: Tight spreads and fast execution speeds improve trading efficiency.
Choosing Opofinance means aligning yourself with a broker committed to your trading success.
Conclusion
Mastering the volume indicator in Forex trading is not just a technical skill, but a strategic advantage that can significantly elevate your trading performance. By understanding how volume reflects market interest, sentiment, and potential reversals, traders can make more informed decisions, align their strategies with prevailing trends, and avoid false signals. Volume indicators, such as OBV, MFI, and VWAP, provide valuable insights into the strength of market moves and help traders confirm trends, identify breakouts, or spot reversals with greater precision.
However, mastering these tools requires more than just knowledge of their mechanics—it involves practice, continuous learning, and the ability to integrate them into a broader trading strategy. Combining volume analysis with price action, market timing, and risk management ensures that traders are not only reacting to market movements but also anticipating them with confidence.
Moreover, partnering with a reliable, regulated broker like Opofinance can amplify the effectiveness of your trading strategies. Access to advanced platforms, real-time data, and robust support systems enables traders to leverage volume indicators in the most optimal way. With the right tools, guidance, and an informed approach, mastering volume indicators becomes a critical step towards long-term success in Forex trading.
In conclusion, volume analysis is a powerful technique that, when used effectively, can unlock opportunities that other traders might miss. Whether you are a beginner or an experienced trader, understanding and applying volume indicators will give you a clearer perspective on market dynamics, help you manage risks better, and ultimately increase your chances of success in the competitive world of Forex trading.
How do volume indicators differ in Forex compared to other markets?
In centralized markets like stocks, actual volume data is available, representing the total number of shares traded. In the decentralized Forex market, actual volume isn’t available. Instead, tick volume—the number of price changes—is used as a proxy. While not exact, tick volume has proven to correlate strongly with actual market activity.
Can volume indicators be used for all currency pairs?
Yes, volume indicators can be applied to all currency pairs. However, the effectiveness may vary depending on the liquidity and volatility of the pair. Major pairs like EUR/USD or GBP/USD typically provide more reliable volume data due to higher trading activity.
How often should I use volume indicators in my trading routine?
Volume indicators should be a regular part of your trading analysis. Incorporate them when scanning for trading opportunities, confirming trends, or identifying potential reversals. Consistent use helps you develop a better understanding of market dynamics.


