

A volume profile strategy is a technical analysis approach that reveals where the majority of trading volume has occurred at specific price levels over a set period. Unlike traditional volume indicators that track volume against time, this method provides a clear map of market-generated support and resistance zones, giving you a significant edge. By understanding how to interpret the Value Area, Point of Control (POC), and high/low volume nodes, traders can build a robust volume profile trading strategy to identify high-probability setups, manage risk effectively, and make decisions based on institutional order flow. This guide will walk you through everything from the core concepts to advanced techniques for integrating this powerful tool into your daily trading routine, whether you are trading with an online forex broker or in other markets.

Key Takeaways:
- A volume profile strategy focuses on volume traded at specific prices, not over time, to identify true support and resistance.
- The three most important components are the Point of Control (POC), the Value Area (VA), and High/Low Volume Nodes (HVNs/LVNs).
- The POC acts as the market’s center of gravity, while the VA contains the bulk of recent trading activity (typically 70%).
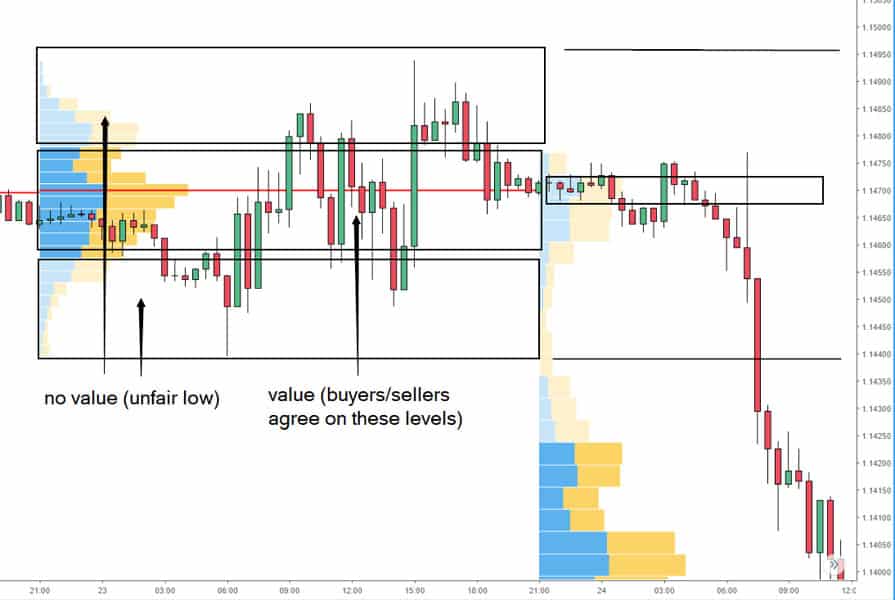
- High Volume Nodes (HVNs) indicate areas of price agreement and potential consolidation, often serving as strong support or resistance.
- Low Volume Nodes (LVNs) represent price levels where little trading occurred, suggesting price could move through these zones quickly.
- Effective strategies involve trading retracements to HVNs, breakouts through LVNs, and rotations within the Value Area.
- Combining volume profile with other indicators like moving averages or RSI can increase the probability of a successful trade.
Understanding Volume Profile
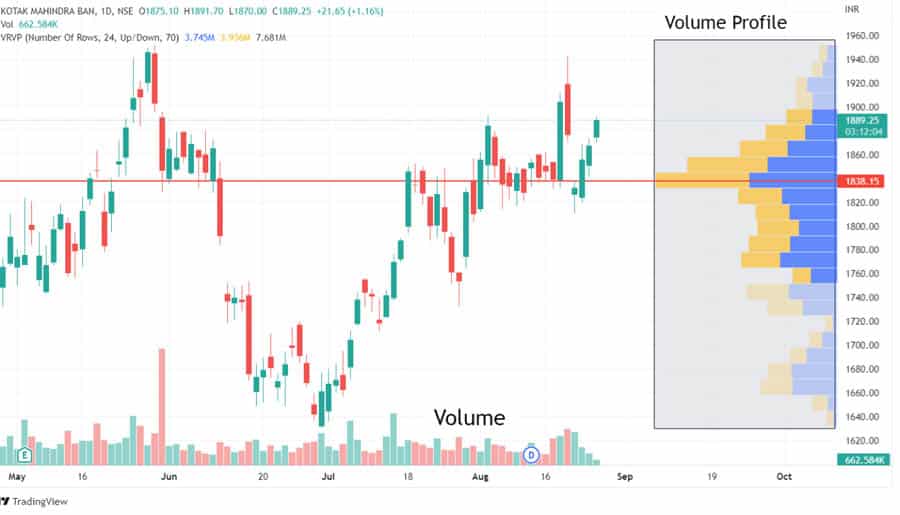
At its core, volume profile is a charting study that displays trading activity over a specified time period at specified price levels. Think of it as a horizontal histogram that sits on the y-axis (price) of your chart, rather than the traditional volume indicator at the bottom that uses the x-axis (time). This seemingly simple shift in perspective is what gives the volume profile strategy its power. Instead of just knowing *when* volume was high, you discover *where* it was high. This “where” is the secret to understanding market structure from the inside out.
Volume Profile vs. Volume-by-Time
Traditional volume-by-time indicators tell you how many shares or contracts were traded during a specific candle—say, a 5-minute or 1-hour bar. This is useful for gauging momentum but lacks context. Did that high volume occur at the top of the candle, the bottom, or somewhere in the middle? Volume profile answers this by dissecting the candle and showing you the precise price levels that attracted the most interest. It visualizes the market’s auction process, revealing the prices that buyers and sellers deemed “fair” and those they rejected.
Core Components Explained
To build a successful volume profile trading strategy, you must first master its key components. These elements work together to paint a picture of the market’s structure and sentiment.
Value Area (VA)
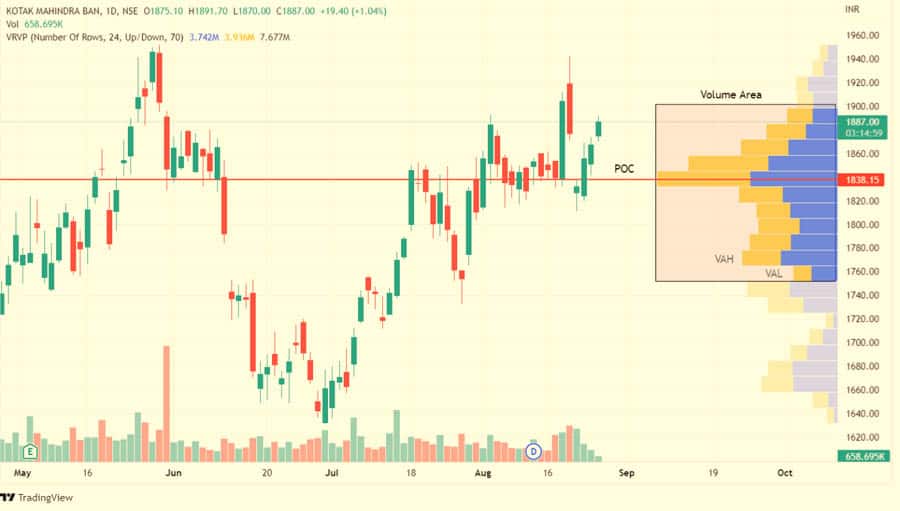
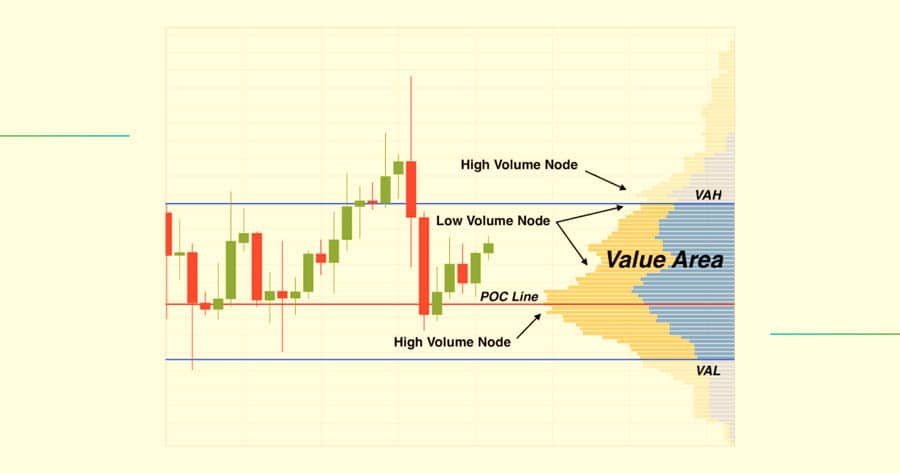
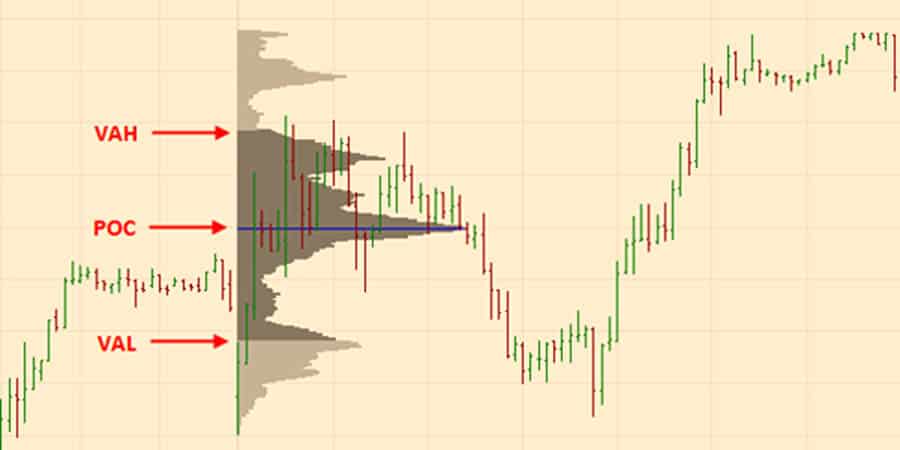
The Value Area is the heart of the volume profile. It represents the price range where a significant percentage—typically 70%—of the period’s total volume was traded. It is the zone where the market spent the most time and facilitated the most trade. Prices inside the VA are considered “accepted” by the market. The boundaries of this area are known as the Value Area High (VAH) and Value Area Low (VAL), which often act as dynamic support and resistance levels.
Point of Control (POC)
The Point of Control (POC) is the single price level within the Value Area where the most volume was traded. It is the peak of the volume histogram and represents the “fairest” price in the eyes of the market for that session. The POC is a powerful magnet for price and a critical reference point for traders. It can signal the area of maximum balance or, conversely, a key level for a potential breakout if price decisively moves away from it.
High and Low Volume Nodes (HVN/LVN)
High Volume Nodes (HVNs) are peaks in the volume profile histogram, similar to the POC but with less volume. They represent areas of high liquidity and price agreement, where the market consolidated and built a “shelf.” These shelves often become strong support or resistance on future price tests. In contrast, Low Volume Nodes (LVNs) are valleys or gaps in the histogram. These are illiquid zones where price moved quickly without facilitating much trade. LVNs signify price rejection and imbalance. When price re-enters an LVN, it tends to travel through it rapidly to find the next area of high volume (an HVN).
Read More: Market Profile vs Volume Profile
How Volume Profile Works in Trading
The practical application of volume profile hinges on its ability to map the market’s underlying structure. It moves beyond simple price action to show you the *why* behind the moves. By identifying where institutions have left their footprints, you can position yourself to trade alongside them. This is the essence of a smart volume profile strategy.
Mapping Volume at Price Levels
The profile achieves this by scanning each trading session and plotting the total volume for every price tick. The result is a distribution curve that reveals the anatomy of the market. A wide, bell-shaped curve indicates a balanced market in a consolidation phase, while a tall, thin profile suggests a trending market that is actively seeking value elsewhere. By learning to read these shapes, you gain insight into the market’s current state and its likely next move.
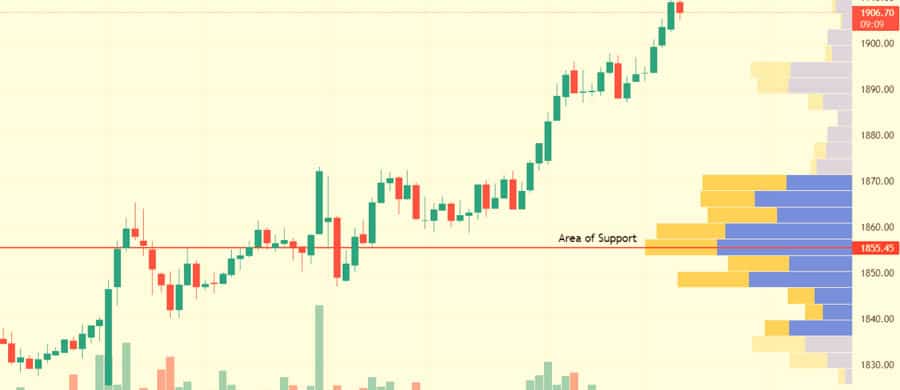
Support and Resistance Redefined
Traditional technical analysis relies on connecting past highs and lows to draw trendlines. A volume profile trading strategy offers a more dynamic and reliable way to identify support and resistance. Instead of arbitrary lines, you use market-generated levels of interest:
- Volume Shelves (HVNs): These are your high-probability support and resistance zones. When price returns to an HVN, it meets a wall of orders, often causing it to pause or reverse.
- Value Area High/Low (VAH/VAL): These levels are crucial for framing the current trading range. A rejection at the VAH can be a signal to short, while a bounce from the VAL can be a long trigger.
- Point of Control (POC): The POC is the ultimate equilibrium point. It can act as a target for mean-reversion trades or as a pivot for breakouts.
Types of Volume Profile Indicators
To effectively implement a volume profile strategy, it’s important to know the different types of indicators available on most modern trading platforms. Each one offers a unique view of the market, and experienced traders often use them in combination.
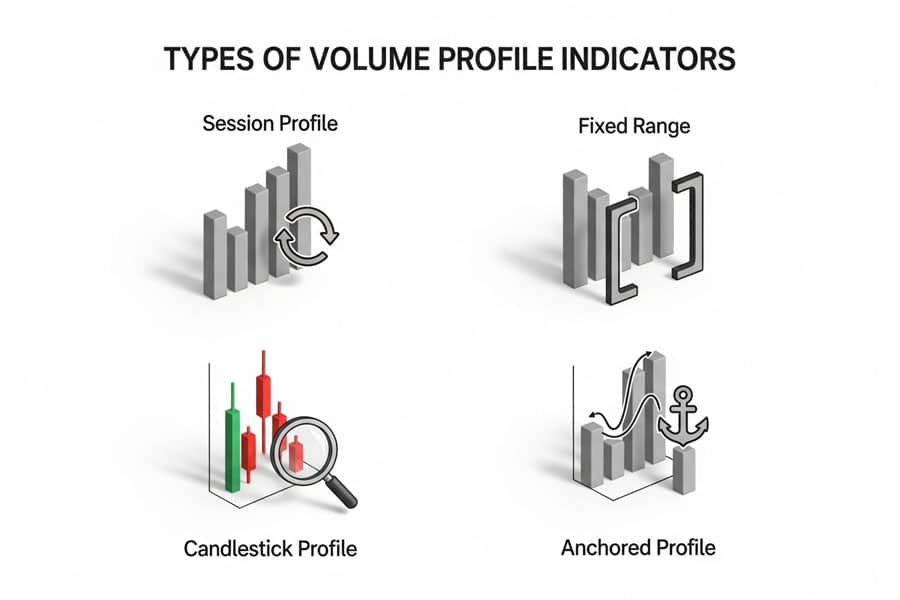
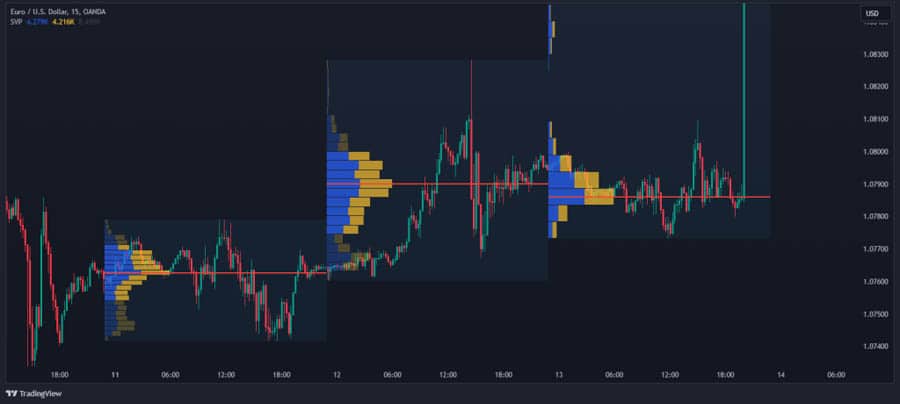
Session Profile
This is the most common type, displaying the volume profile for a single trading session (e.g., a day). It’s perfect for day traders who need to understand the intraday narrative—where value is being established and where the key intraday levels are forming.
Fixed Range Profile
The fixed range tool allows you to manually select a starting and ending point on your chart to draw a volume profile for that specific range. This is incredibly useful for analyzing specific trend legs, consolidation zones, or any custom period you want to investigate. It helps answer questions like, “Where was the most volume traded during this uptrend?”
Candlestick (or Bar-Based) Profiles
Some platforms offer mini-profiles for each individual candlestick or bar. This provides a granular view of the auction process within each bar, helping you spot absorption, exhaustion, and other subtle clues that are invisible on a standard chart. It’s a powerful tool for scalpers and short-term traders.
Anchored Volume Profile
This tool allows you to “anchor” a volume profile to a specific point on the chart, such as a significant high, low, or the start of a news event. It then calculates the profile from that point forward. This is excellent for understanding how the market has responded to a key event or a change in trend.
Read More: 7 Pro Tips for Using POC in Trading
Core Volume Profile Trading Strategies
With a solid understanding of the components, we can now dive into actionable trading setups. A successful volume profile trading strategy is not about blindly buying at support or selling at resistance; it’s about understanding the context and executing with precision. Here are some of the most effective and time-tested strategies.
High Volume Node Retracements
This is a bread-and-butter strategy for many volume profile traders. HVNs represent areas of balance and high liquidity. When price breaks away from an HVN and later returns to test it, it often finds support (if tested from above) or resistance (if tested from below). The trade idea is to wait for a pullback to a prominent HVN and look for a price action signal—like a pin bar or engulfing candle—to confirm the level is holding before entering a trade. The stop-loss can be placed on the other side of the HVN, offering a clear and logical risk-defined setup.
Low Volume Node Breakouts
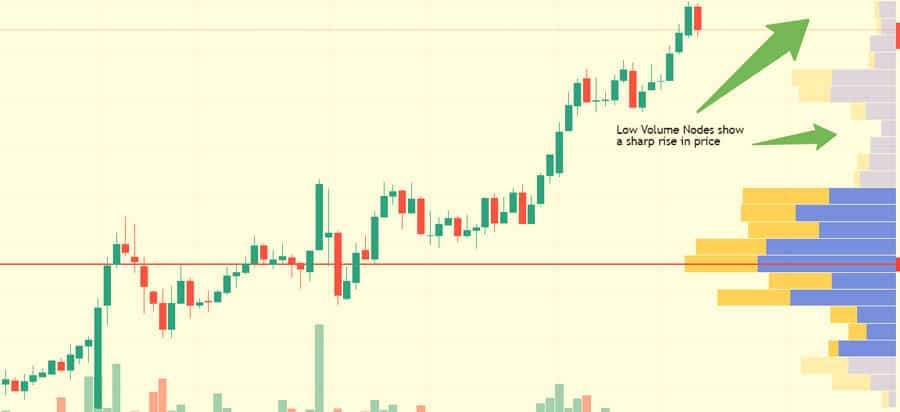
Low Volume Nodes are the opposite of HVNs. They are price zones where the market did not want to transact, creating a vacuum. When price breaks into an LVN, it often accelerates through it quickly, seeking the next area of liquidity (the next HVN). This creates a powerful momentum trading opportunity. The strategy is to identify a consolidation (an HVN) that has formed next to an LVN. When price breaks out of the consolidation and into the LVN, you can enter in the direction of the breakout, targeting the next HVN as your profit objective.
Value Area Rotation
This mean-reversion strategy is based on the principle that price has a tendency to revert to the VA and the POC. It works best in balanced, range-bound markets. The setup involves waiting for price to extend beyond the Value Area High (VAH) or Value Area Low (VAL) and then show signs of failing to find acceptance at these new prices. If price pushes above VAH but then quickly falls back inside the VA, it’s a sign of rejection and a potential short trade, targeting the POC and VAL. The same logic applies in reverse for a long trade from below the VAL.
POC Rejection/Acceptance
The Point of Control is the market’s gravitational center. How price interacts with the POC provides critical information. A POC rejection occurs when price tests the POC but is quickly repelled, indicating a strong directional bias. For example, in an uptrend, price might pull back to the POC, find buyers, and then bounce, confirming the trend. A POC acceptance, however, happens when price breaks a prior POC and begins to build volume around it, suggesting the market has accepted this new price as fair value and is likely to consolidate there.
Multi-Timeframe Confluence
The most robust strategies combine signals across multiple timeframes. For instance, you might use a weekly volume profile to identify the major HVNs and the macro market structure. Then, you can zoom into a daily or 4-hour chart to look for intraday setups that align with those higher-timeframe levels. A long entry at a daily VAH has a much higher probability of failing if that level is also a major weekly HVN resistance. Finding confluence—where a key level on a lower timeframe aligns with a key level on a higher timeframe—is a hallmark of a professional volume profile strategy.
Identifying Key Market Levels
The real power of a volume profile strategy lies in its ability to pinpoint market-generated levels that matter. These are not arbitrary lines drawn on a chart; they are zones where significant business has taken place. Learning to see and interpret these levels is the key to unlocking the predictive power of volume profile.
Using POC, VAH, and VAL
Think of these three levels as your primary roadmap for any trading session. – The POC is your reference point for “fair value.” Is the market trading above it (bullish) or below it (bearish)? Is it accepting the POC or rejecting it? – The VAH is the upper boundary of the value zone. It’s the level where sellers may start to emerge. A breakout above it that holds suggests bulls are in firm control. – The VAL is the lower boundary. It’s where buyers are expected to step in. A breakdown below it that holds indicates bears have taken over. A simple but effective approach is to observe how the current session’s price action interacts with the previous day’s POC, VAH, and VAL. These levels often act as powerful pivots for the day’s trading.
Volume Clusters and Shelves
Beyond the main VA, a profile will often show multiple smaller HVNs, or “volume clusters.” These are areas where price paused and built a small pocket of liquidity. These “volume shelves” are crucial for trade management. For example, if you are in a long trade that is moving up through an LVN, the next volume shelf above is your logical first profit target. It’s an area where the move is likely to stall or reverse. Understanding these minor shelves allows you to be more precise with your entries, stops, and targets.
Read More: Volume Spread Analysis
Determining Market Context with Profile Shapes
One of the more advanced aspects of a volume profile trading strategy is the ability to read the “shape” of the daily profile as it develops. The shape tells a story about the type of participants in the market and their intentions. There are four primary profile shapes that every trader should know.
‘P’ Shaped Profile
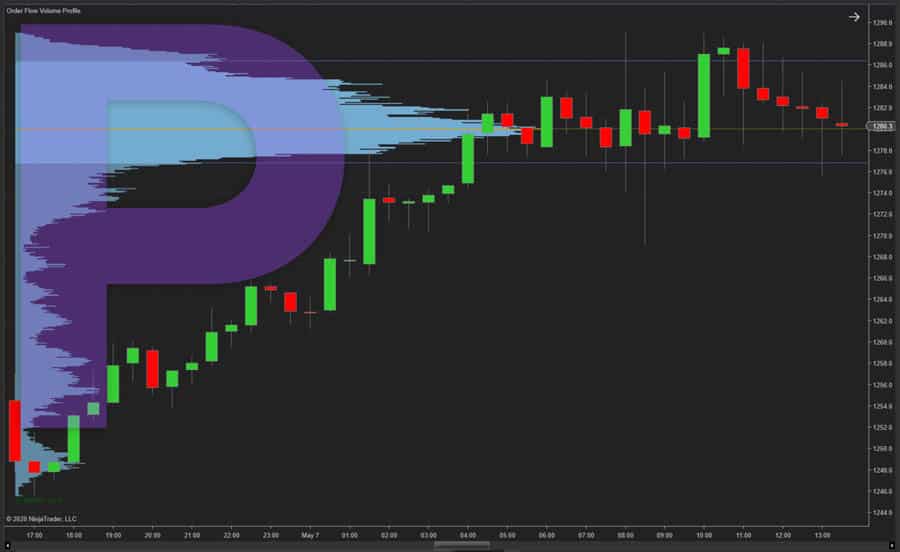
A “P” shape occurs when there is a wide volume distribution at the top of the profile with a long, thin tail at the bottom. This typically forms after an uptrend and signals that long-term buyers may be taking profits and short-term traders are active at the top of the range. The bulk of the volume (the body of the “P”) indicates a new area of balance. This shape suggests a potential short-term top or consolidation, but the underlying trend may still be up.
‘b’ Shaped Profile
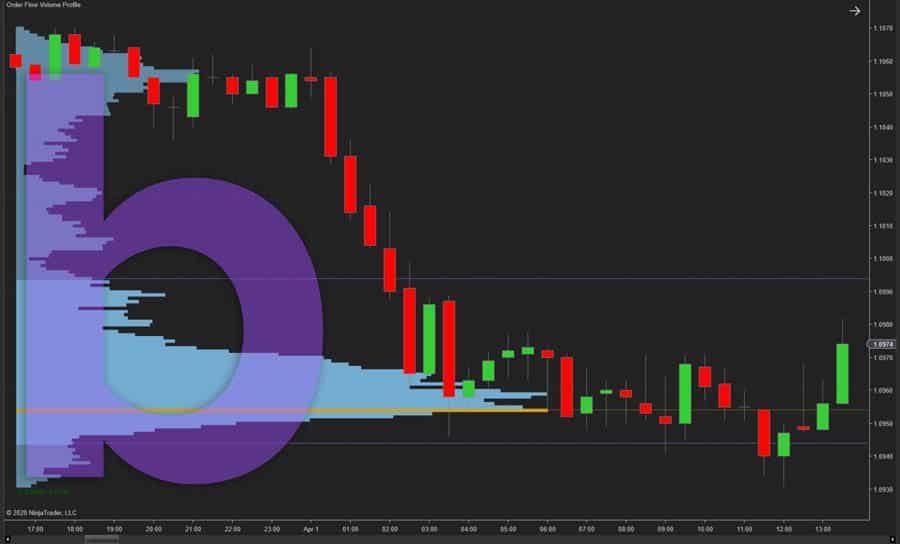
The “b” shape is the inverse of the “P.” It has a wide distribution at the bottom and a thin tail at the top. This often forms after a downtrend and can signal capitulation or the beginning of accumulation by long-term buyers. The wide base shows that a new value area is being established at lower prices. This can be a sign of a potential bottom or at least a significant pause in the downtrend.
‘D’ Shaped Profile
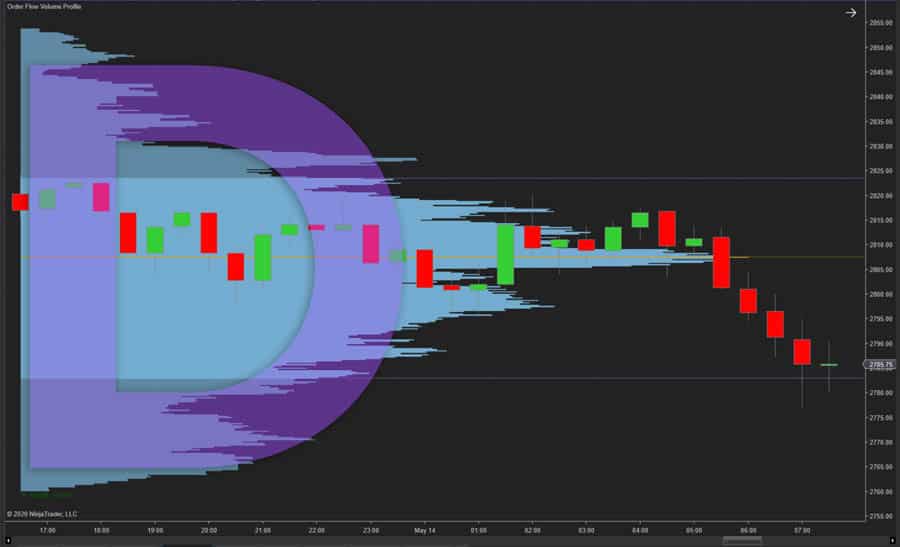
The “D” shape, or normal distribution, looks like a classic bell curve. It indicates a market that is in complete balance and harmony. Both long-term and short-term traders are active, and there is no strong directional conviction. This is the shape of a range-bound or sideways market. Trading within a “D” shaped profile often involves fading the extremes (VAH and VAL) and targeting the POC.
‘B’ Shaped Profile
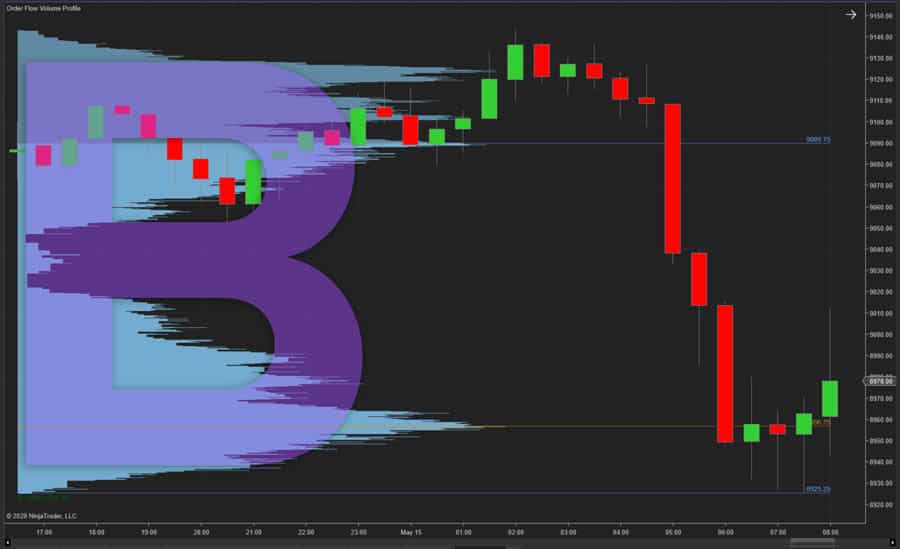
A “B” shape is characterized by two distinct high-volume distributions (two “bellies”) with a thin area in the middle. This signals a market with two different groups of participants fighting for control at two different price levels. It’s a sign of strong disagreement and often leads to a powerful breakout. The key is to watch which of the two distributions price breaks away from, as that will likely signal the direction of the next trend.
Combining Volume Profile With Other Tools
While a volume profile strategy is powerful on its own, its effectiveness can be magnified when combined with other indicators. The goal of using additional tools is not to add complexity, but to find confluence—a situation where multiple, independent signals point to the same conclusion. This dramatically increases the probability of a trade working out.
Moving Averages
Moving averages are excellent for confirming the overall trend direction. For example, you might be considering a long trade based on a pullback to an HVN. If the price is also bouncing off the 50-period moving average at the same time, your confidence in the trade should increase. The moving average confirms that your entry is aligned with the prevailing trend.
RSI and Momentum Oscillators
Oscillators like the Relative Strength Index (RSI) or Stochastics can help you time your entries by identifying overbought and oversold conditions. Imagine price is approaching a major VAL support level. If, at the same time, the RSI is showing a deep oversold reading (below 30) and perhaps even a bullish divergence, it adds significant weight to the potential for a bounce. This confluence can help you avoid entering too early and catch the turn more precisely.
Fibonacci Retracements
Fibonacci levels are another popular tool that pairs exceptionally well with volume profile. It’s not uncommon to see a key Fibonacci retracement level (like the 61.8%) line up perfectly with a major HVN or a session POC. When this happens, you have a confluence of a price-based support level and a volume-based support level. This is a very high-probability setup that many professional traders look for.
Pro Setup & Charting Best Practices
Setting up your charts correctly is crucial for executing a volume profile trading strategy effectively. The right settings and timeframes can make the difference between clarity and confusion. While preferences vary, there are some general best practices that can serve as a solid starting point.
Best Volume Profile Settings
- For Day Trading: Use a Session Volume (SVP) profile that resets daily. This gives you a clear view of the developing intraday structure. Set the “row size” (the number of price levels displayed) to a number that provides detail without cluttering the chart. A common setting is between 50 and 100 rows.
- For Swing Trading: Use a weekly or monthly profile to identify the major macro levels. Supplement this with the Fixed Range tool to analyze specific swing highs and lows. This helps you see the bigger picture and position yourself for multi-day moves.
- For Scalping: A bar-based or candlestick profile can be invaluable. It shows the volume distribution within each individual bar, allowing you to spot absorption and exhaustion on a micro-level for quick in-and-out trades.
Choosing the Right Chart Timeframe
Your primary charting timeframe should match your trading style. A day trader might use a 5-minute or 15-minute chart, while a swing trader would focus on the 4-hour or daily chart. However, it’s essential to always have a higher timeframe chart open for context. If you’re a day trader on a 5-minute chart, you should still be aware of the key levels from the daily and weekly profiles. This prevents you from taking a trade that goes directly against a major higher-timeframe support or resistance level.
Setting Up on Popular Platforms
Most modern charting platforms offer robust volume profile tools. – TradingView: Offers several built-in volume profile indicators, including Session Volume Profile (SVP), Fixed Range (VPFR), and Visible Range (VPVR). They are highly customizable and easy to use. – Sierra Chart: Known for its advanced charting and order flow tools, Sierra Chart offers highly detailed and customizable volume profile indicators that are favored by many professional futures traders. – MotiveWave: Another professional-grade platform that provides a suite of advanced volume profile and order flow studies, catering to serious traders who need deep market analysis.
Risk Management With Volume Profile
One of the greatest advantages of a volume profile trading strategy is that it provides a logical framework for risk management. Unlike strategies that rely on arbitrary percentage-based stops, volume profile allows you to place your stops and targets based on actual market-generated structure. This leads to more intelligent and effective trade management.
Logical Stop-Loss Placement
Volume profile makes stop-loss placement intuitive. If you are entering a long trade at an HVN, your stop-loss should be placed just below that node. The HVN represents a zone of strong support; if price breaks decisively through it, your trade idea is invalidated. By placing your stop on the other side of the node, you are letting the market prove your thesis wrong before you exit the trade. Similarly, if you’re trading a breakout through an LVN, your stop can be placed back inside the previous HVN, as a move back into that consolidation area would negate the breakout signal.
Profit Targets Using Volume Zones
Just as volume profile helps with stops, it also provides clear profit targets. If you enter a trade at one HVN, your logical first target is the next HVN on the chart. If you’re trading a breakout across an LVN, your target is the high-volume area on the other side of that “volume gap.” This approach allows you to set realistic profit objectives based on where the market is likely to encounter friction, rather than relying on fixed risk-to-reward ratios that may not align with the current market structure.
Managing Trades Based on Liquidity
Active trade management can also be enhanced. As your trade moves in your favor, you can trail your stop-loss behind newly formed volume shelves. This allows you to lock in profits while still giving the trade room to breathe. By managing your trade based on where real liquidity is building, you can adapt to changing market conditions and maximize the potential of your winning trades.
Common Mistakes & Pro Tips
While a volume profile strategy is incredibly powerful, it’s not a magic bullet. There are common pitfalls that trip up new traders, and there are subtle nuances that experienced traders learn over time. Being aware of these can significantly shorten your learning curve.
Common Mistakes to Avoid
- Fading Strong Trends: Trying to short a market that is consistently breaking above the previous day’s VAH is a recipe for disaster. Always respect the trend context.
- Ignoring Profile Shape: Taking a mean-reversion trade (fading the edges of the VA) in a trending “P” or “b” shaped profile is a low-probability play. Match your strategy to the market type revealed by the profile shape.
- Over-Reliance on a Single Level: Don’t treat the POC or VAH as an exact line in the sand. Think of them as zones. Wait for price action to confirm the level before entering.
Pro Tips from Experienced Traders
- Look for “Naked” POCs: A Point of Control from a previous session that has not been re-tested is called a “Naked POC.” These levels often act as powerful magnets for price and can be excellent targets for trades.
- Watch for POC Migration: Pay attention to whether the daily POC is moving higher or lower throughout the session. A POC that is consistently migrating upwards is a strong sign of bullish sentiment.
- Screen Time is Key: There is no substitute for experience. Spend hours watching how price interacts with profile levels in real-time. This will build the intuition needed to execute a volume profile trading strategy with confidence.
Real Trader Experiences & Case Studies
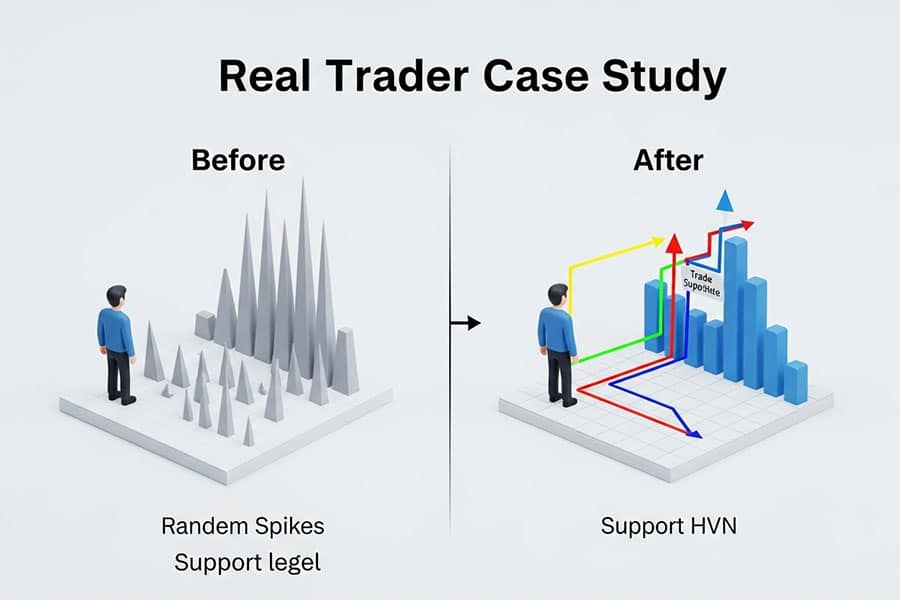
The journey to mastering any trading strategy is paved with trial and error. The traders who find consistent success with volume profile are those who put in the screen time to truly understand its nuances. One common story is of traders who initially struggled with classic indicators, feeling like they were always one step behind the market. After discovering volume profile, they often describe a “lightbulb moment” where the market’s structure finally became clear.
A typical case study might involve a futures trader who was consistently stopped out by random price spikes. By implementing a volume profile strategy, they learned to place their stops behind solid HVNs, drastically reducing their number of frustrating losses. They also learned to target LVNs for breakouts, allowing them to catch some of the fastest moves of the day. The key lesson from these experiences is always the same: focus on learning the principles and adapting them to your market and timeframe, rather than searching for a “holy grail” setup. The consistency comes from disciplined application of the core concepts over hundreds of trades.
Trade with a Regulated and Innovative Broker
Enhance your volume profile trading strategy with a broker that offers cutting-edge tools and a secure environment. Opofinance, regulated by ASIC, provides everything a modern trader needs.
- Advanced Trading Platforms: Choose from industry-leading platforms like MT4, MT5, cTrader, and the proprietary OpoTrade.
- Innovative AI Tools: Gain an edge with an AI Market Analyzer, AI Coach, and AI-powered Support.
- Flexible Trading Options: Explore Social Trading and Prop Trading opportunities to diversify your approach.
- Secure & Flexible Transactions: Enjoy safe and convenient deposits and withdrawals, including crypto payments with zero fees.
Take your trading to the next level. Open an account with Opofinance today!
Conclusion
Mastering a volume profile strategy is a journey, not a destination. It requires a shift from thinking about price over time to understanding volume at price. By learning to read the Value Area, Point of Control, and the various nodes, you can uncover the market’s true support and resistance levels. This guide has provided a comprehensive roadmap, from the basic components to advanced strategies. The next step is to apply these concepts, practice diligently, and make this powerful methodology your own.
Is volume profile a lagging or leading indicator?
Volume profile is considered a leading indicator because it shows pre-existing areas of support and resistance based on past volume, which can predict future price behavior, unlike lagging indicators that are based purely on past price.
Can volume profile be used for long-term investing?
Yes, by applying a volume profile over a very long timeframe (e.g., several years of data), investors can identify major long-term value areas and accumulation/distribution zones to make informed investment decisions.
What is the main difference between a TPO profile and a volume profile?
A volume profile shows how much volume was traded at each price level. A Time Price Opportunity (TPO) profile shows how much time the market spent at each price level, offering a slightly different view of market acceptance.
How does market open affect volume profile analysis?
The opening price’s relationship to the previous day’s value area is critical. An open above the VA might signal a bullish day, while an open below could indicate bearish sentiment, setting the initial bias for applying a volume profile strategy.
Does volume profile work in low-volume markets?
Volume profile is most effective in liquid markets where the data is robust (like futures, popular stocks, and major forex pairs). In very thin, low-volume markets, the profile may be too erratic to provide reliable signals.


