The 200 EMA swing trading strategy is widely regarded as one of the most reliable tools for identifying long-term trends and making informed trading decisions in various financial markets. Trusted by many traders, including those using a regulated forex broker, the 200-period Exponential Moving Average (EMA) smooths out price fluctuations, offering a clearer picture of the market’s overall direction. This strategy is particularly valuable for swing traders who aim to capture medium-term market movements and profit from price swings within a trend.
This article provides a comprehensive guide to mastering the 200 EMA swing trading strategy, including how to use it, when to enter and exit trades, and advanced techniques to maximize your profitability. By the end of this guide, you’ll have all the knowledge you need to incorporate this powerful tool into your trading routine. Moreover, aligning with Google’s helpful content rules, this guide will ensure that every aspect of the 200 EMA strategy is explained clearly and directly, offering actionable insights for traders at every level. Using a secure and regulated broker like Opofinance can enhance your trading experience, ensuring that your trades are executed in a safe and transparent environment.
What is the 200 EMA?
The 200 EMA is a technical indicator that tracks the average price of an asset over the past 200 periods, giving more weight to recent prices. This makes it a highly responsive tool for detecting long-term trends. Unlike the Simple Moving Average (SMA), which assigns equal importance to all price points, the EMA places more emphasis on the latest data, making it more sensitive to price changes.
How is the 200 EMA Calculated?
The 200 EMA calculation is more complex than the SMA but follows a clear mathematical formula that weights recent prices more heavily:
- Exponential Weighting: Assigns more importance to recent price points.
- Smoothing Factor: The smoothing factor for the 200 EMA is calculated as 2 ÷ (200 + 1), resulting in a value of approximately 0.0099.
- EMA Formula: EMA = (Current Price × Smoothing Factor) + (Previous EMA × (1 – Smoothing Factor)).
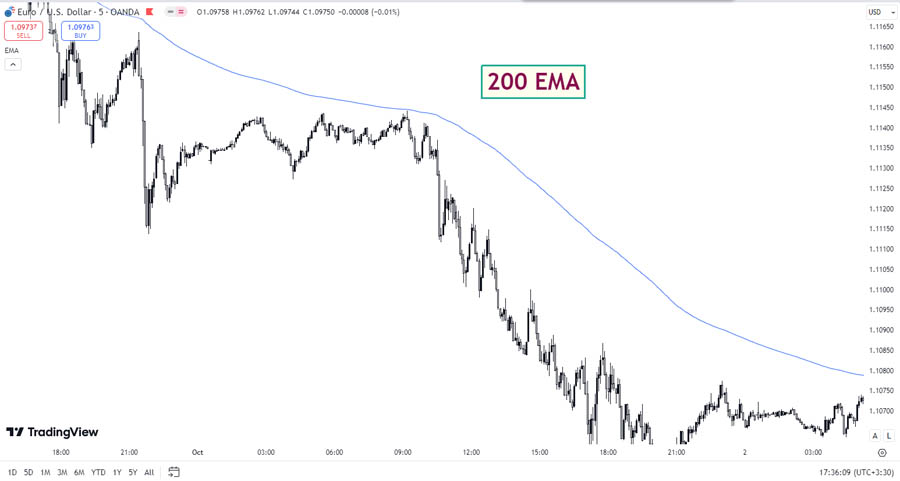
This formula ensures that the EMA reacts more quickly to recent price movements, making it a better indicator for identifying trend reversals compared to the SMA.
Read More: 50 EMA Swing Trading Strategy
Why the 200 EMA is Ideal for Swing Trading
The 200 EMA swing trading strategy is ideal for identifying long-term trends and capturing price swings within those trends. It is popular among swing traders for several reasons:
- Trend Identification: The 200 EMA filters out short-term market noise, allowing traders to focus on the overall market direction.
- Support and Resistance: The 200 EMA often acts as dynamic support or resistance, helping traders identify key areas to enter or exit trades.
- Reliable Risk Management: Using the 200 EMA as a guide, traders can set logical stop-loss levels and reduce their risk exposure.
- Versatility: The 200 EMA works well across various markets, including forex, stocks, and cryptocurrencies, making it a flexible tool for all types of traders.
If you are serious about improving your swing trading skills, learning to master the 200 EMA strategy is a must.
Step-by-Step Guide to Implementing the 200 EMA Strategy
1. Chart Setup
Setting up your chart is the first step in implementing the 200 EMA swing trading strategy. Here’s how to do it:
- Select your trading time frame. The 4-hour or daily charts are recommended for swing trading.
- Add the 200 EMA to your chart by selecting the appropriate tool from your trading platform.
- Customize your chart by combining the 200 EMA with other technical indicators like the Relative Strength Index (RSI) or Moving Average Convergence Divergence (MACD) for further confirmation of trend direction and trade entries.
2. Entry Rules
The success of the 200 EMA strategy depends heavily on following strict entry rules:
- For Long Positions: When the price bounces off the 200 EMA from below, it signals the start of a new upward trend. Enter a buy position after confirming the trend with other indicators such as the RSI, which should show oversold conditions, or a bullish candlestick pattern like a bullish engulfing.
- For Short Positions: If the price rejects the 200 EMA from above, it indicates a potential downward trend. Confirm this signal with bearish patterns such as a shooting star or an overbought signal from the RSI before entering a sell position.
Using other indicators or candlestick patterns ensures you enter high-probability trades rather than relying solely on the 200 EMA.
3. Exit Strategy
Exiting your trades at the right time is just as important as entering them. Here’s how to manage your exits effectively:
- Set your take-profit level at key support or resistance areas identified on the chart.
- Use trailing stops to lock in profits as the trade moves in your favor, allowing you to capture additional gains if the trend continues.
- Time-based exits can also be useful when a trade doesn’t move as expected within a specified period, allowing you to cut losses early or exit with a small profit.
Advanced Techniques for Maximizing Success with the 200 EMA Strategy
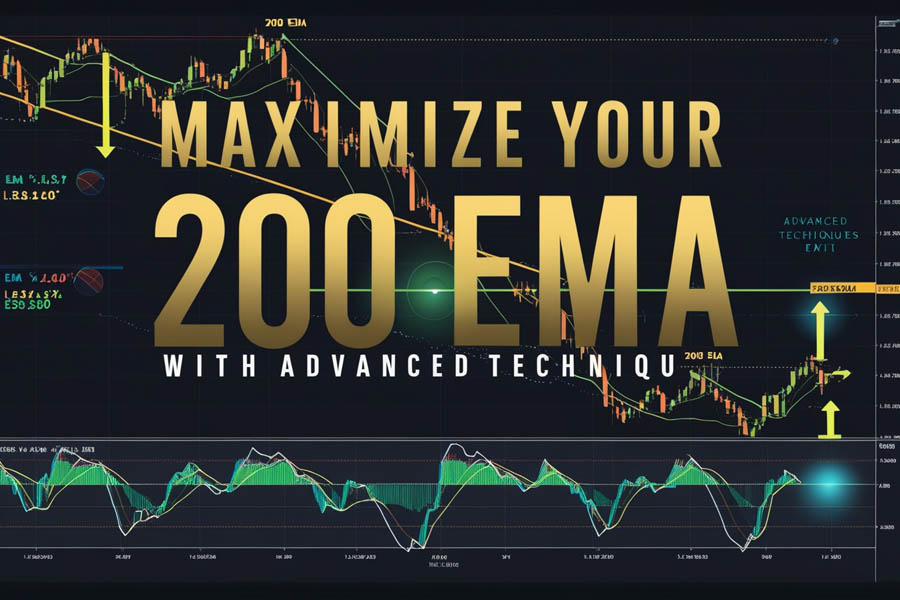
Multiple Timeframe Analysis
To increase the accuracy of your trades, it’s helpful to incorporate multiple timeframes into your analysis. This approach provides a broader perspective of the market and increases your chances of identifying high-probability trade setups. Here’s how you can implement it:
- Daily Chart: Use the daily chart to identify the overall trend direction.
- 4-Hour Chart: Look for precise entry points by observing the price’s interaction with the 200 EMA.
- 1-Hour Chart: Fine-tune your entry and exit points, increasing your precision.
By using multiple timeframes, you can ensure that your trades are aligned with the broader market trend, reducing the chances of false signals.
Combining the 200 EMA with Other Indicators
While the 200 EMA is a powerful indicator, combining it with other technical indicators can improve your trade accuracy:
- RSI (Relative Strength Index): The RSI helps determine whether an asset is overbought or oversold, offering confirmation for potential trend reversals.
- MACD (Moving Average Convergence Divergence): The MACD highlights momentum shifts and can confirm the direction of a trend.
- Fibonacci Retracement: A tool used to identify potential support and resistance levels, Fibonacci retracement can provide additional confirmation for entry points.
By adding these indicators to your trading strategy, you enhance the effectiveness of the 200 EMA and increase the likelihood of successful trades.
Read More: 5 EMA Swing Trading Strategy
How to Adapt the 200 EMA Strategy to Different Market Conditions
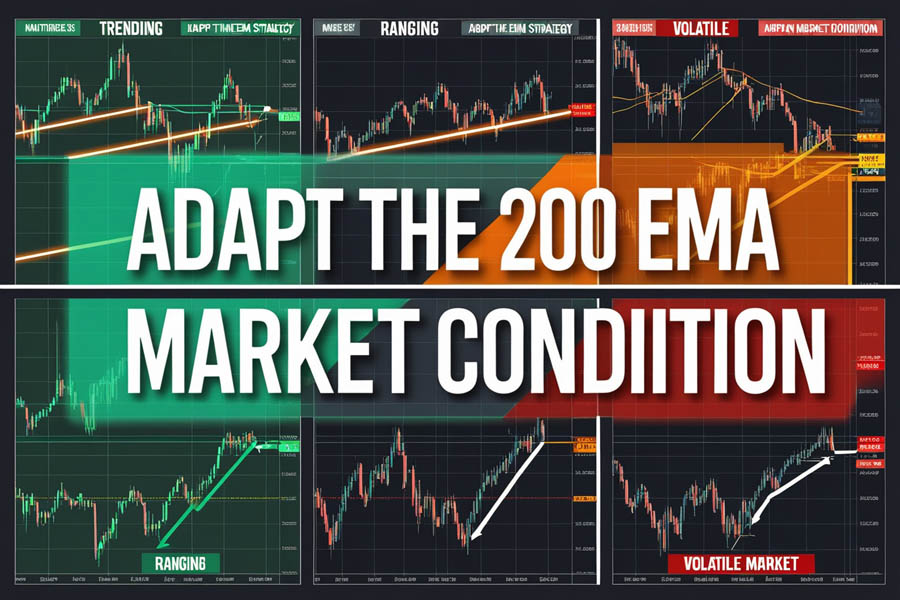
Trending Markets
In trending markets, the 200 EMA acts as a reliable support or resistance level. Here’s how to trade in such conditions:
- For Uptrends: Look for pullbacks to the 200 EMA to enter long positions.
- For Downtrends: Watch for the price to reject the 200 EMA from above, signaling a good opportunity to enter short positions.
Ranging Markets
When the market is moving sideways, the 200 EMA tends to flatten out, indicating no clear trend. In these conditions, traders may experience false breakouts. In such cases:
- Avoid Trading Solely on the 200 EMA: Consider using additional indicators, such as Bollinger Bands or stochastic oscillators, to identify overbought or oversold conditions within the range.
Volatile Markets
Volatile markets can lead to erratic price movements, which may reduce the effectiveness of the 200 EMA as a support or resistance level. In such markets:
- Widen Your Stop-Loss: To accommodate larger price swings, consider increasing the distance of your stop-loss.
- Reduce Position Size: Lowering your position size helps manage risk when markets are highly volatile.
By adjusting your strategy based on market conditions, you can maximize your chances of success while minimizing risk.
Risk Management in the 200 EMA Strategy
Risk management is critical to your success as a swing trader. Without proper risk management, even the best strategy can result in significant losses. Here are some key principles to follow when trading the 200 EMA strategy:
- Limit Risk per Trade: Never risk more than 1-2% of your trading capital on any single trade. This ensures that a string of losing trades won’t wipe out your account.
- Use Logical Stop-Losses: Set your stop-loss levels just beyond the 200 EMA or at recent swing highs/lows to protect against unexpected price movements.
- Adjust Position Sizes: Based on the size of your stop-loss, adjust your position size to keep your risk consistent across trades.
- Stay Aware of News Events: Market-moving news events can cause sudden spikes in volatility. Avoid entering trades just before major economic announcements, as these can result in sharp price swings that could hit your stop-loss.
By adhering to these risk management principles, you can trade the 200 EMA strategy with confidence, knowing that your downside risk is limited.
Common Mistakes to Avoid in the 200 EMA Strategy
Here are some common pitfalls traders encounter when using the 200 EMA swing trading strategy:
- Overtrading: Taking trades that do not meet all your entry criteria.
- Ignoring Confirmation Signals: Failing to confirm your entries with other indicators or price action patterns can lead to false signals.
- Risking Too Much Per Trade: Always manage your risk by using proper position sizing and stop-loss placements.
- Not Adapting to Market Conditions: The 200 EMA works best in trending markets. Avoid using it in ranging markets without additional strategies.
Read More: 55 EMA Swing Trading Strategy
Choosing the Right Time Frame for the 200 EMA Strategy
Selecting the appropriate time frame is crucial for the effectiveness of the 200 EMA swing trading strategy. The time frame you choose can significantly influence your trading decisions, entry and exit points, and overall strategy effectiveness. In this section, we’ll explore how to choose the right time frame based on your trading style, goals, and the nature of the market.
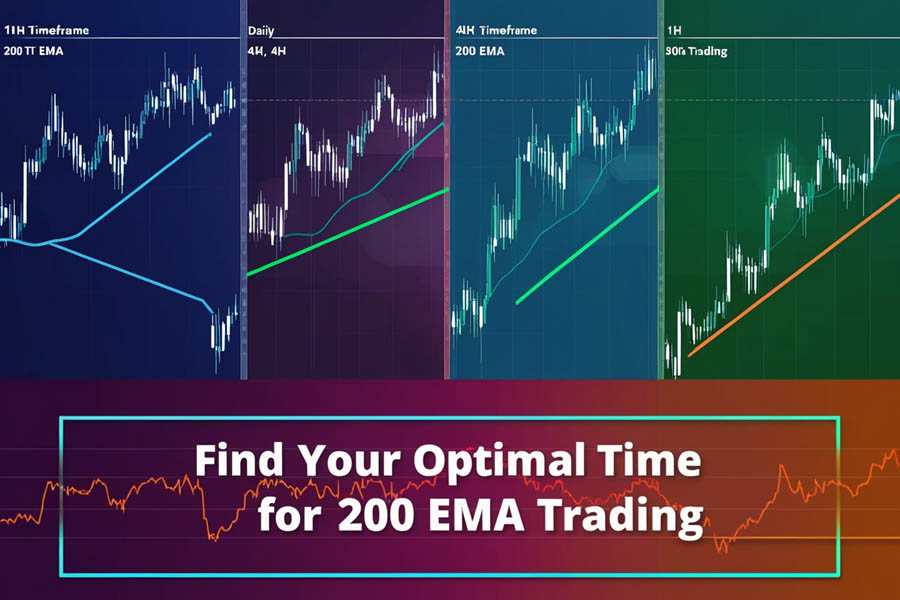
Different Time Frames Explained
When trading with the 200 EMA, various time frames can be utilized depending on your trading style. Here are some common time frames used by traders:
- Short Time Frames (1-Minute to 30-Minute Charts):
- Best For: Scalpers and day traders who look to capitalize on short-term price movements.
- Characteristics: High volatility and noise, which can lead to false signals. In this context, the 200 EMA may be less effective, as short-term fluctuations can deviate significantly from the long-term trend.
- Medium Time Frames (1-Hour to 4-Hour Charts):
- Best For: Swing traders who prefer to hold positions for several hours to days.
- Characteristics: Provides a balance between short-term volatility and long-term trends. The 200 EMA is particularly useful here, as it helps identify significant price swings while filtering out some of the noise seen in shorter time frames.
- Long Time Frames (Daily to Weekly Charts):
- Best For: Position traders and long-term investors focusing on macro trends.
- Characteristics: Less volatility and noise, providing a clearer view of the overall market trend. The 200 EMA is highly effective in these time frames for identifying long-term support and resistance levels, making it ideal for traders who wish to capture substantial price movements over weeks or months.
Aligning Time Frames with Trading Goals
When using the 200 EMA strategy, consider the following factors to align your time frame with your trading goals:
- Risk Tolerance: Shorter time frames often come with increased risk due to rapid price changes. Choose a time frame that suits your comfort level regarding risk and volatility.
- Time Commitment: Assess how much time you can dedicate to monitoring the markets. If you can’t spend much time analyzing charts, consider using longer time frames that require less frequent monitoring.
- Market Conditions: Different market conditions may favor different time frames. In trending markets, longer time frames might provide more reliable signals, while ranging markets may necessitate a more active approach with shorter time frames.
Combining Time Frames for Enhanced Decision-Making
Employing a multiple timeframe analysis can significantly enhance your trading decisions. Here’s how to combine different time frames effectively:
- Top-Down Analysis: Start with a higher time frame (like the daily chart) to determine the overall market trend and then drill down to a lower time frame (like the 1-hour chart) to identify precise entry points.
- Confirming Trends: If the daily chart indicates an uptrend while the 1-hour chart shows a pullback to the 200 EMA, this alignment strengthens the case for entering a long position.
- Adapting to Market Changes: Regularly evaluate the current market conditions and adjust your time frame as necessary. In times of high volatility, you might prefer the safety of a longer time frame, while in quieter periods, shorter time frames might offer more opportunities.
Opofinance Services: Elevate Your Trading with a Regulated Broker
When executing the 200 EMA swing trading strategy, choosing the right forex trading broker is essential for success. Opofinance, a reputable ASIC-regulated broker, offers traders a safe and transparent trading environment. With its user-friendly platforms, including MT4 and MT5, Opofinance ensures seamless execution of your strategies with competitive spreads and lightning-fast trade execution.
Opofinance is also officially featured on the MT5 brokers list, a testament to its reliability and advanced technology. Whether you’re a beginner or an experienced trader, the social trading feature allows you to share and learn strategies from other traders, making it ideal for enhancing your skills.
Additionally, Opofinance offers secure and convenient deposit and withdrawal methods, giving you peace of mind with your transactions. With 24/7 customer support, regular market insights, and an extensive suite of educational resources, Opofinance provides everything you need for successful trading.
Experience the benefits of trading with a trusted broker—choose Opofinance and take your 200 EMA strategy to new heights.
Conclusion
The 200 EMA swing trading strategy is a powerful tool for traders seeking to capitalize on market trends and price swings. By mastering the use of the 200 EMA, understanding how to select appropriate time frames, and implementing sound risk management practices, you can enhance your trading performance significantly. Remember to keep your strategy flexible and adapt to market conditions as needed.
As you continue to develop your trading skills, consider the advantages of using a reputable broker like Opofinance. With its ASIC regulation and user-friendly platform, Opofinance can provide a secure environment for executing your trades. By incorporating the 200 EMA strategy into your trading routine and following the guidelines outlined in this article, you can navigate the complexities of the financial markets with confidence and precision.
What is the best time frame to use with the 200 EMA for swing trading?
While the 200 EMA can be applied to various time frames, swing traders typically find it most effective on the 4-hour and daily charts. These time frames strike a balance between identifying longer-term trends and capturing significant price swings, offering clearer signals for entry and exit.
How can I improve my results with the 200 EMA strategy?
To enhance your results with the 200 EMA strategy, consider using multiple time frame analysis to confirm trends, combine the 200 EMA with other indicators like the RSI or MACD for additional confirmation, and always adhere to strict risk management practices to protect your capital.
Can I use the 200 EMA strategy for cryptocurrency trading?
Yes, the 200 EMA strategy can be effectively applied to cryptocurrency trading as well. Many cryptocurrencies exhibit trending behavior similar to forex pairs, making the 200 EMA a useful tool for identifying entry and exit points. Just be mindful of the increased volatility and potential for larger price swings in the cryptocurrency market.


