

In the dynamic and ever-evolving world of financial markets, traders are constantly seeking strategies that can provide a distinct edge. For those exploring opportunities through an online forex broker, one such strategy that has gained significant attention and acclaim is the 50 200 day moving average crossover strategy.

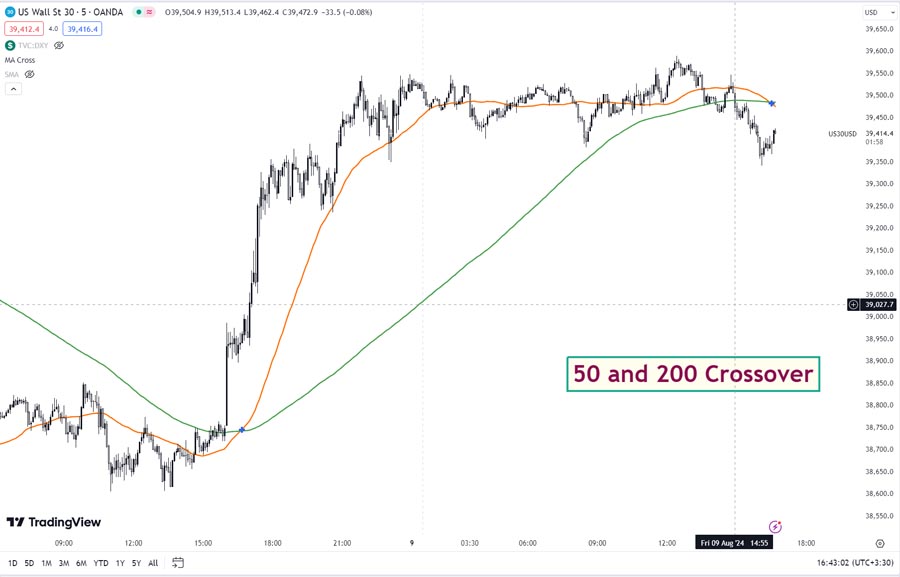
At its core, the 50/200 day moving average crossover strategy focuses on the relationship between two key technical indicators – the 50-day and 200-day moving averages. These moving averages serve as valuable tools for identifying the underlying market trends, with the 50-day average representing the short-term momentum and the 200-day average reflecting the long-term direction.
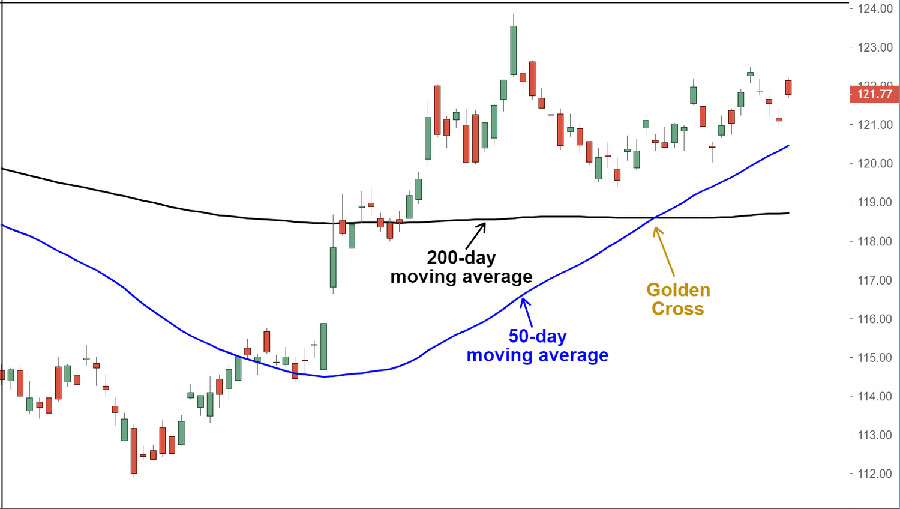
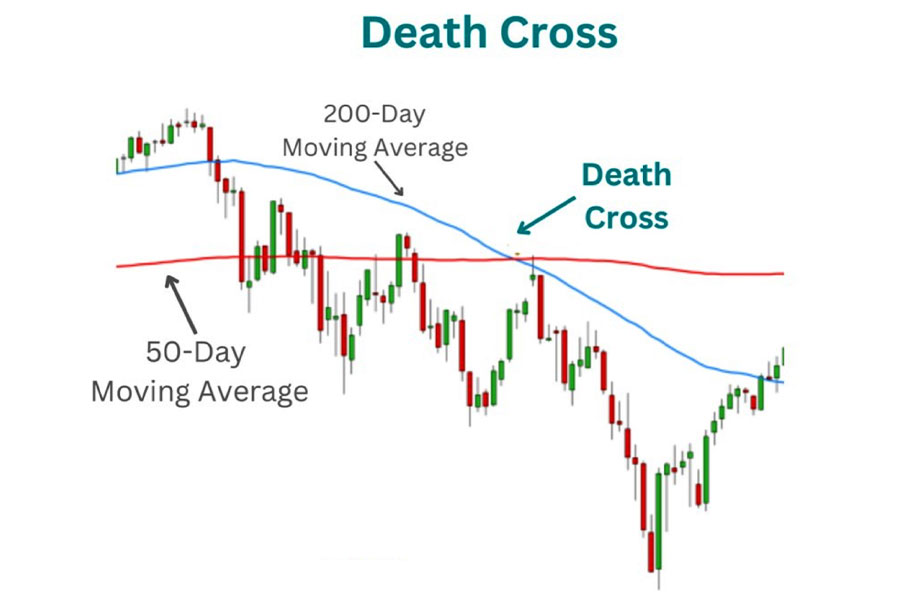
When the 50-day moving average crosses above the 200-day moving average, it is known as a “golden cross” and is generally seen as a bullish signal, suggesting that the market may be poised for a potential uptrend. Conversely, when the 50-day moving average crosses below the 200-day moving average, it is referred to as a “death cross” and is typically interpreted as a bearish signal, indicating a potential market downtrend.
By closely monitoring these crossover signals, traders can gain valuable insights into the current state of the market and make more informed trading decisions. In this comprehensive blog post, we’ll delve into the intricacies of the 50/200 day moving average crossover strategy, exploring its key benefits, optimization techniques, and strategies for seamlessly integrating it into your trading arsenal.
Understanding Market Trends and Moving Averages
At the heart of the 50/200 day moving average crossover strategy lies a fundamental understanding of market trends and the role of moving averages in technical analysis. Moving averages are widely regarded as one of the most essential tools in the trader’s toolkit, as they help smooth out price fluctuations and identify the underlying direction of the market.

The 50-day moving average is considered a short-term trend indicator, reflecting the average closing price over the past 50 trading days. This average is often used to gauge the current market sentiment and identify potential support or resistance levels. On the other hand, the 200-day moving average is viewed as a long-term trend indicator, representing the average closing price over the past 200 trading days. This longer-term average is frequently utilized to determine the overall direction of the market and the strength of the prevailing trend.

By closely monitoring the relationship between these two moving averages, traders can gain valuable insights into the market’s momentum and the potential for trend changes – a key component of the 50/200 day moving average crossover strategy.
Read More: 20, 50 and 200 day moving average crossover
The 50/200 Day Moving Average Crossover Strategy Explained
At the heart of the 50/200 day moving average crossover strategy is the relationship between these two key technical indicators. The 50-day and 200-day moving averages serve as valuable tools for identifying the underlying trends in the financial markets.
The 50-day moving average reflects the average closing price over the past 50 trading days. This short-term average is often used by traders to gauge the current market sentiment and identify potential support or resistance levels. When the price is trading above the 50-day moving average, it can be interpreted as a bullish sign, suggesting that the market is in an upward trend.
On the other hand, the 200-day moving average represents the average closing price over the past 200 trading days. This longer-term average is widely considered a reliable indicator of the overall market direction. A price trading above the 200-day moving average is generally seen as a bullish signal, while a price below the 200-day moving average is interpreted as a bearish signal.
The 50/200 day moving average crossover strategy focuses on the precise moment when these two moving averages intersect, as this crossover can signal a significant shift in market sentiment. There are two key crossover signals to watch for:
- Golden Cross: When the 50-day moving average crosses above the 200-day moving average, it is referred to as a “golden cross.” This event is generally interpreted as a bullish signal, suggesting that the market may be transitioning into an uptrend. The golden cross is often seen as a confirmation of a new long-term bullish trend.
- Death Cross: Conversely, when the 50-day moving average crosses below the 200-day moving average, it is known as a “death cross.” This is typically regarded as a bearish signal, indicating a potential shift in the market’s direction towards a downtrend. The death cross is often seen as a warning sign of an impending market decline.
By closely monitoring these crossover signals, traders can gain valuable insights into the current state of the market and make more informed trading decisions. The 50/200 day moving average crossover strategy provides a data-driven framework for identifying potential trend changes, which can be a crucial factor in achieving trading success.
It’s important to note that the 50/200 day moving average crossover strategy should not be viewed in isolation. Traders often combine this technique with other technical and fundamental analysis tools to enhance their decision-making process and confirm the validity of the signals generated by the strategy.
For example, traders may choose to incorporate momentum indicators, such as the Relative Strength Index (RSI), or volume analysis to corroborate the signals from the 50/200 day moving average crossover. This multi-faceted approach can help traders make more informed and confident trading decisions, as they can better understand the underlying market dynamics.
By mastering the intricacies of the 50/200 day moving average crossover strategy and integrating it seamlessly into their trading arsenal, traders can gain a significant advantage in navigating the complexities of the financial markets.
Read More: 20 day moving average crosses 200 day moving average
Benefits of the 50/200 Day Moving Average Crossover Strategy
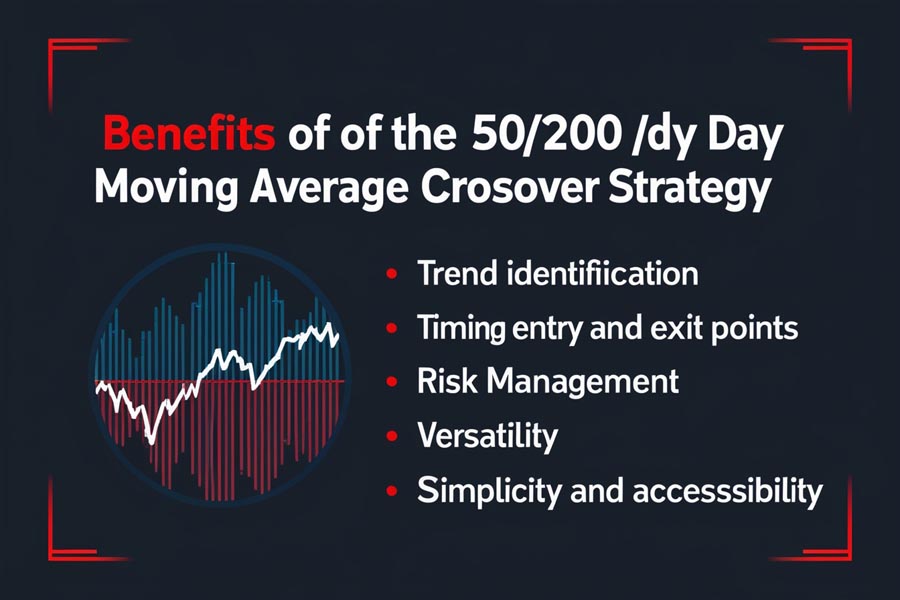
The 50/200 day moving average crossover strategy offers a multitude of benefits that make it a highly compelling tool for traders:
- Trend Identification: By analyzing the relationship between the 50-day and 200-day moving averages, traders can more accurately identify the prevailing market trend, whether it’s bullish or bearish. This information can be instrumental in guiding their trading decisions and positioning their portfolios accordingly.
- Timing Entry and Exit Points: The crossover signals generated by this strategy can help traders time their market entries and exits more effectively, potentially increasing their chances of capturing favorable market movements and minimizing losses during adverse conditions.
- Risk Management: The 50/200 day moving average crossover strategy can be used as a risk management tool, as it can help traders identify potential support and resistance levels, allowing them to set appropriate stop-loss orders and manage their overall risk exposure.
- Versatility: This strategy can be applied to a wide range of financial instruments, including stocks, forex, and commodities, making it a highly versatile tool for traders across different asset classes.
- Simplicity and Accessibility: While the 50/200 day moving average crossover strategy is a powerful technique, it is also relatively straightforward to understand and implement, making it accessible to both novice and experienced traders.
By leveraging the benefits of the 50/200 day moving average crossover strategy, traders can gain a significant advantage in the markets, potentially improving their overall trading performance and risk-adjusted returns.
Optimizing the 50/200 Day Moving Average Crossover Strategy
To maximize the effectiveness of the 50/200 day moving average crossover strategy, it’s essential to consider the following optimization techniques:
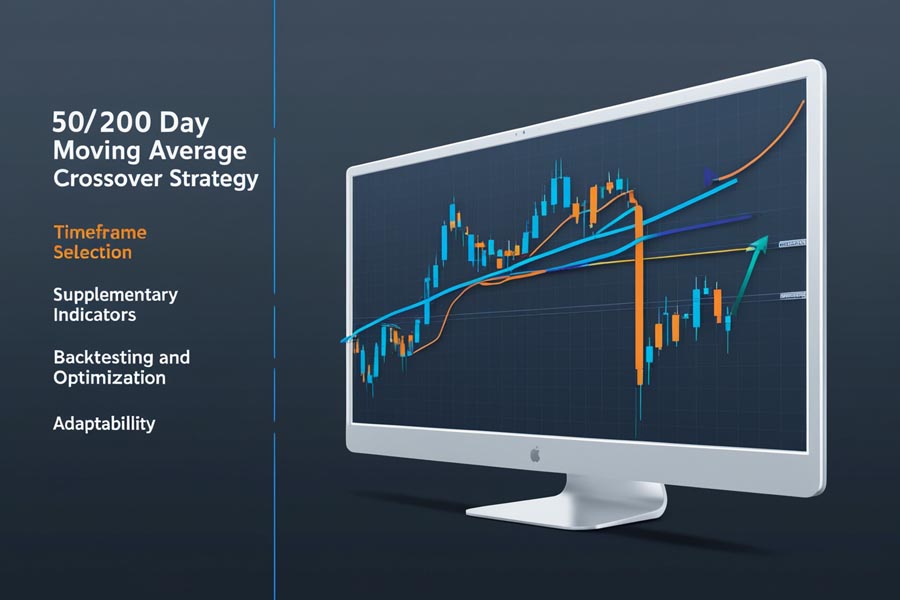
- Timeframe Selection: Determine the optimal timeframe for your trading style and risk tolerance. While the 50/200 day moving average is considered a medium-term trend indicator, you may find that adjusting the timeframe can improve the strategy’s performance in certain market conditions.
- Supplementary Indicators: Combine the 50/200 day moving average crossover with other technical indicators, such as momentum oscillators, volume analysis, or support and resistance levels, to enhance your decision-making process and confirm the validity of the signals generated by the strategy.
- Backtesting and Optimization: Conduct thorough backtesting on various market conditions to fine-tune your trading parameters, including entry and exit points, position sizing, and risk management techniques. This process can help you identify the most effective application of the 50/200 day moving average crossover strategy for your specific trading approach.
- Adaptability: Remain flexible and be willing to adjust your strategy based on changing market dynamics. The financial markets are constantly evolving, and a successful trader must be able to adapt their approach accordingly to maintain a competitive edge.
By incorporating these optimization techniques, you can unlock the full potential of the 50/200 day moving average crossover strategy and enhance its effectiveness within your overall trading plan.
Integrating the 50/200 Day Moving Average Crossover with Other Indicators
While the 50/200 day moving average crossover strategy is a powerful tool on its own, it can be even more effective when combined with other technical and fundamental analysis techniques. By layering multiple strategies, traders can increase the robustness of their trading approach and potentially improve their overall performance.
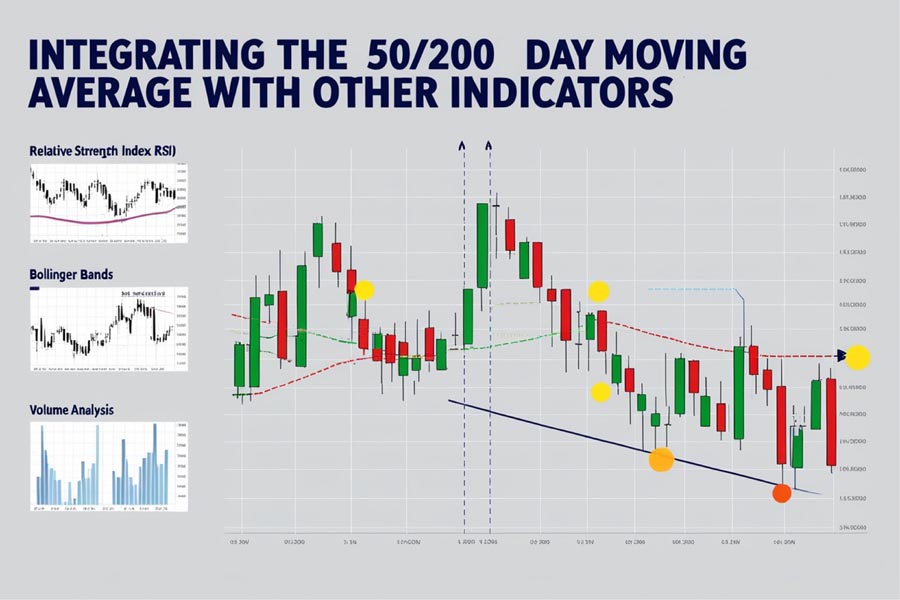
For example, traders may choose to incorporate the relative strength index (RSI), Bollinger Bands, or volume analysis to confirm the signals generated by the 50/200 day moving average crossover. This multi-faceted approach can help traders validate the market signals and make more informed trading decisions.
However, it’s important to note that when combining multiple strategies, it’s crucial to thoroughly backtest and optimize the integration to ensure the strategies work well together and align with your trading objectives. Careful consideration and testing are essential to avoid potential conflicts or unintended consequences.
Read More: 200 day moving average trading strategies
Risk Management Considerations
Effective risk management is a crucial component of any successful trading strategy, and the 50/200 day moving average crossover strategy is no exception. While this strategy can provide valuable insights, it is not a guarantee of success, and traders must always be mindful of their risk exposure.
One key aspect of risk management is setting appropriate stop-loss orders. By placing stop-loss orders at strategic levels, traders can limit their potential losses and protect their capital in the event of adverse market movements. Additionally, diversifying your portfolio and managing position sizes can help reduce overall risk and provide a buffer against market volatility.
It’s also important to remember that the financial markets are inherently unpredictable, and even the most well-designed strategies can experience periods of underperformance. Maintaining a disciplined and adaptable approach to risk management is essential for navigating the ups and downs of the market.
OpoFinance Services: A Trusted Broker for Traders
As you embark on your journey to master the 50/200 day moving average crossover strategy, it’s crucial to partner with a reliable and ASIC-regulated broker that can provide you with the necessary tools and support. OpoFinance is a trusted name in the industry, offering a suite of services tailored to the needs of modern traders.
One of the standout features of OpoFinance is its social trading service, which allows you to connect with a community of experienced traders, share insights, and copy successful trading strategies. This collaborative approach can be particularly beneficial for traders looking to enhance their skills and stay up-to-date with the latest market trends.
Whether you’re a seasoned trader or just starting your trading journey, OpoFinance is committed to helping you navigate the financial markets with confidence. Explore their comprehensive suite of services and discover how they can support your trading success.
Conclusion
The 50/200 day moving average crossover strategy is a transformative tool that can help traders navigate the complex and ever-changing financial markets. By understanding the underlying principles of this strategy and incorporating it into your trading approach, you can gain a significant competitive edge and potentially improve your overall trading performance.
Remember, the key to success with the 50/200 day moving average crossover strategy is to combine it with a robust risk management plan, continuous market analysis, and a disciplined trading approach. Stay vigilant, keep learning, and always strive to improve your trading skills. Embrace the power of this strategy and unlock new possibilities in your trading journey.
How can I determine the optimal timeframe for the 50/200 day moving average crossover strategy?
The optimal timeframe for the 50/200 day moving average crossover strategy can depend on factors such as your trading style, risk tolerance, and the asset you’re trading. Generally, the 50/200 day moving average is considered a medium-term trend indicator, suitable for traders with a longer-term perspective. However, some traders may choose to use shorter or longer timeframes based on their specific needs and market conditions.


