The 50 EMA Swing Trading Strategy is a reliable and effective method for identifying profitable trading opportunities in the forex market. This technical analysis strategy uses the 50-period Exponential Moving Average (EMA) to highlight trends, pinpoint reversals, and define entry and exit points for swing trades. Whether you are a beginner or an experienced trader, this strategy can be highly beneficial when combined with a regulated forex broker that offers the right tools and trading conditions. By focusing on the 50 EMA, traders can avoid market noise, enhance their decision-making, and align their trades with established trends for increased profitability.

In this article, we will delve deep into the workings of the 50 EMA Swing Trading Strategy, covering everything from the basics of the indicator to its advanced applications. We will also provide practical tips, discuss risk management techniques, and share real-world examples to help you master this strategy. If you’re looking for a robust and straightforward way to capture medium-term price movements in forex, the 50 EMA might just be the perfect fit.
Let’s begin by exploring the fundamentals of the 50 EMA and why it’s such a popular choice among swing traders.
What is the 50 EMA Swing Trading Strategy?
At its core, the 50 EMA swing trading strategy uses the Exponential Moving Average (EMA) to interpret market momentum and trend direction. Unlike the Simple Moving Average (SMA), the EMA gives more weight to recent price action, making it faster in responding to market changes. The 50-period EMA is specifically designed to capture medium-term trends, a perfect balance for swing traders who aim to hold trades for several days to weeks.
Swing traders focus on profiting from the “swings” or oscillations in market prices. By using the 50 EMA, traders can avoid the intraday volatility that might trigger false signals in shorter timeframes while still reacting to price movements efficiently. The strategy is particularly effective in trending markets, where the EMA can act as a dynamic support or resistance line.

Why the 50 EMA Is a Key Indicator
Among technical indicators, the 50 EMA stands out for several reasons:
- Balanced Sensitivity: It reacts quicker to price changes than longer-term averages (like the 100 or 200 EMA) but is less prone to the false signals that shorter EMAs (e.g., the 10 or 20 EMA) might trigger.
- Widely Used: The 50 EMA is employed by traders across multiple asset classes, including stocks, commodities, and cryptocurrencies. Its universal application ensures that many market participants monitor it, increasing its reliability.
- Best of Both Worlds: The 50 EMA’s sensitivity is particularly helpful in volatile markets, where sudden price movements can either present profitable opportunities or signal a reversal.
The 50 EMA serves as both a trend filter and a trading trigger, making it a central part of any serious trader’s toolkit.
Read More: 200 EMA Swing Trading
How to Implement the 50 EMA Swing Trading Strategy

Identifying the Trend
The success of the 50 EMA swing trading strategy lies in first determining the direction of the overall trend. This involves not only looking at price relative to the EMA but also confirming the trend strength and longevity using other technical tools.
Steps for Trend Identification:
- Uptrend: The price consistently remains above the 50 EMA, and the EMA itself is sloping upwards.
- Downtrend: The price consistently remains below the 50 EMA, with the EMA sloping downwards.
In an uptrend, you’ll only look for long (buy) trades, while in a downtrend, your focus will be on short (sell) trades. It’s essential to ensure that the trend isn’t weakening by combining your EMA analysis with indicators such as the MACD or RSI for momentum confirmation.
Pullback and Entry Points
After confirming the trend, the next step is to identify a pullback—a temporary reversal within the larger trend. This presents an opportunity to enter the trade at a more favorable price. Look for the price to pull back towards the 50 EMA without breaking it convincingly. Once the price approaches the EMA, watch for reversal candlestick patterns such as a bullish engulfing pattern, hammer, or pin bar in a bullish setup. In a bearish setup, look for bearish patterns like a shooting star or bearish engulfing.
Advanced Tip: You can refine your entry point by using a smaller timeframe (e.g., 1-hour or 4-hour chart) to look for precise candlestick patterns while maintaining your trend analysis on a higher timeframe (e.g., daily chart). This multi-timeframe approach reduces the risk of entering trades prematurely.
Position Sizing and Risk Management
One of the most crucial elements of any swing trading strategy is managing risk. Before entering a trade, you need to decide on your position size and where to place your stop loss. A common approach is to place your stop loss slightly below the recent swing low for a buy trade, or above the swing high for a sell trade. This ensures that you’re protected if the market moves against your position.
Position Sizing: The key to long-term trading success is not over-leveraging. Limit your risk per trade to 1-2% of your total capital, adjusting the lot size based on your risk tolerance and stop loss distance. For example, if your stop loss is 50 pips away and you’re risking 2% of your capital, calculate your lot size accordingly to maintain that risk level.
Exit Strategies
Proper exit strategies are crucial to the success of the 50 EMA swing trading strategy. By planning your exits in advance, you can maximize your profits and minimize your losses.
- Profit Taking:
- Take partial profits at key support or resistance levels to reduce your exposure while locking in gains.
- Scaling out of positions can allow you to capitalize on extended trends without exposing your entire position to market reversals.
- Use price action signals, such as a break of a trendline or the formation of a reversal pattern, to time your exit.
- Stop Loss Placement:
- Set your initial stop loss based on recent price swings, ensuring that you give the market enough room to move without prematurely exiting the trade.
- Once your trade is in profit, consider moving your stop loss to breakeven to eliminate risk.
- Implement time-based exits for trades that are not performing as expected within a specific timeframe.
Read More: 5 EMA Swing Trading Strategy
Combining the 50 EMA with Other Indicators

To increase the success rate of the 50 EMA swing trading strategy, many traders combine it with other technical indicators. Here are some of the best combinations:
1. Relative Strength Index (RSI)
The RSI is an excellent tool to confirm whether a pullback is a healthy retracement within a trend or the start of a reversal. If you’re in a bullish trend and the RSI dips near 30 during a pullback, it’s an indication that the market is likely to resume its uptrend. Similarly, in a bearish trend, an RSI approaching 70 during a pullback could signal a continuation of the downtrend.
Advanced Tip: Use the RSI to identify divergence. Bullish divergence in a downtrend suggests that selling pressure is weakening, signaling a potential trend reversal, while bearish divergence in an uptrend indicates that the buying pressure is fading.
2. Fibonacci Retracement Levels
Fibonacci levels are popular among swing traders for identifying potential support and resistance areas during pullbacks. Combining the 50 EMA with the 38.2%, 50%, or 61.8% Fibonacci retracement levels can provide highly accurate trade entries.
For example: In an uptrend, if the price pulls back to the 50 EMA, and this coincides with the 38.2% Fibonacci retracement level, this confluence significantly increases the probability of a successful trade.
3. MACD (Moving Average Convergence Divergence)
The MACD indicator provides a valuable layer of confirmation by showing the relationship between two moving averages. When the MACD line crosses above the signal line during a pullback in an uptrend, it’s a strong buy signal. The reverse is true for downtrends.
Pro Tip: Use MACD divergences to spot potential reversals before they happen. If price is making higher highs, but MACD is making lower highs, it signals weakening momentum, suggesting that the uptrend might soon reverse.
Best Timeframes for the 50 EMA Swing Trading Strategy

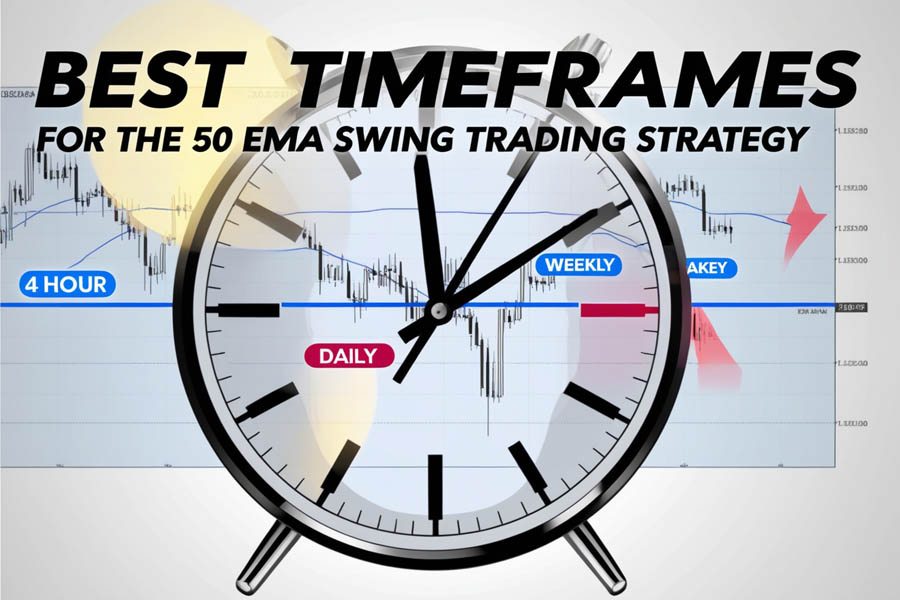
The 50 EMA swing trading strategy is highly versatile and works across a range of timeframes. The most effective timeframes for this strategy include:
- 4-hour charts – Ideal for capturing multi-day swing trades.
- Daily charts – Best for swing traders who want to hold positions for several days to weeks.
- Weekly charts – Suitable for long-term swing traders who are looking to capture broader market trends.
Timeframe Selection Criteria
When choosing the right timeframe for your trades, consider the following factors:
- Trading Style and Availability: Select a timeframe that matches your availability to monitor the markets. 4-hour and daily charts are typically best for traders with limited screen time.
- Market Volatility: Higher volatility pairs may require shorter timeframes to capture quick movements, while lower volatility pairs may benefit from longer timeframes.
- Currency Pair Characteristics: Different currency pairs behave differently. For example, some pairs, like EUR/USD, may work well on daily charts, while others, like GBP/JPY, may require shorter timeframes.
- Risk Tolerance: Your risk tolerance will play a significant role in your timeframe selection. Shorter timeframes often come with more price noise, while longer timeframes may expose you to larger drawdowns.
Pro Tip: Always align your trades with the overall trend on the higher timeframes, even if you’re trading on a shorter timeframe. For instance, if the weekly chart shows a strong uptrend, you should only be looking for buy opportunities on the daily or 4-hour charts.
Advanced Tips for the 50 EMA Swing Trading Strategy
1. Trade the Breakouts
In addition to pullbacks, breakouts from consolidation patterns near the 50 EMA can offer excellent trading opportunities. When the price consolidates in a tight range around the 50 EMA, a breakout often leads to strong price moves in the direction of the trend. Watch for chart patterns like triangles, flags, or pennants forming around the EMA to identify potential breakout trades.
2. Use a Trend Filter
Many traders use the 200 EMA as a trend filter in combination with the 50 EMA. When the price is above the 200 EMA, it confirms a long-term uptrend, and you should only be looking for buy signals with the 50 EMA. Conversely, when the price is below the 200 EMA, you should focus on sell signals.
Read More: 55 EMA Swing Trading Strategy
Common Mistakes to Avoid with the 50 EMA Strategy
- Ignoring the Broader Market Context: Always consider the overall market conditions. If the market is ranging or volatile, the 50 EMA may give you false signals. It’s important to only trade in trending markets to maximize your chances of success.
- Overtrading: Just because the price touches the
50 EMA doesn’t mean you should automatically enter a trade. Always wait for confirmation through price action, candlestick patterns, or other technical indicators.
- Not Using Stop-Loss Orders: Failing to set a stop-loss can result in large losses if the market moves against you. Always use a stop-loss based on recent swing highs or lows.
- Emotional Trading: Sticking to your strategy and not letting emotions dictate your trades is crucial. Fear and greed can easily lead you to exit trades too early or enter trades too late, negatively impacting your overall profitability.
Opofinance Services: Elevate Your 50 EMA Swing Trading Strategy
To successfully implement the 50 EMA swing trading strategy, you need a reliable and trusted forex broker that offers the right trading conditions and tools. Opofinance, a globally recognized broker regulated by ASIC, provides an excellent platform for swing traders looking to maximize their profits. Here’s why Opofinance stands out:
- ASIC Regulation:
- As an ASIC-regulated broker, Opofinance ensures a high level of security and transparency, protecting your capital and ensuring fair trading practices.
- MT5 Platform Access:
- Opofinance is included in the prestigious MT5 brokers list, providing you with access to the powerful MetaTrader 5 platform. MT5 offers advanced charting tools, technical indicators, and automated trading capabilities, making it the perfect platform for implementing the 50 EMA swing trading strategy.
- Social Trading Services:
- Opofinance offers an innovative social trading service, allowing you to follow and copy the trades of experienced and successful traders. This feature is particularly useful for beginners who want to learn from seasoned professionals while profiting from their strategies.
- Safe Deposit and Withdrawal Methods:
- With Opofinance, you can enjoy secure and convenient deposit and withdrawal methods, ensuring that your funds are always safe and accessible.

By choosing Opofinance as your broker, you can enhance your trading experience, access valuable tools, and trade with confidence using the 50 EMA swing trading strategy.
Conclusion
The 50 EMA swing trading strategy is a highly effective and versatile method for identifying trends, entering trades, and capturing significant market swings. Its balance between responsiveness and reliability makes it a favorite among traders across various markets and timeframes. By combining the 50 EMA with additional indicators such as the RSI or Fibonacci retracement levels, and employing sound risk management techniques, you can significantly improve your trading results.
However, no strategy is foolproof. Consistent practice, patience, and discipline are essential to mastering the 50 EMA swing trading strategy. Ensure you’re trading with a reputable broker like Opofinance, which provides the tools and support necessary for a successful trading career.
With these insights, you’re well on your way to mastering the 50 EMA swing trading strategy and improving your overall profitability.
Can I use the 50 EMA swing trading strategy on stocks?
Yes, the 50 EMA strategy is not limited to forex trading. It can be applied to stocks, commodities, cryptocurrencies, and other financial instruments. However, different asset classes may have different volatility and liquidity levels, so adjust your strategy accordingly.
What is the best stop-loss strategy when using the 50 EMA?
A common stop-loss strategy is to place your stop slightly below the recent swing low in an uptrend or above the swing high in a downtrend. This allows you to protect your capital while giving the trade enough room to breathe.
How long should I hold my trades with the 50 EMA strategy?
The holding period for trades using the 50 EMA swing trading strategy varies depending on the timeframe you’re using. On a 4-hour chart, trades might last a few days, while on a daily chart, trades could last several weeks. Always be prepared to exit your trade if the market shows signs of reversal.
Can I use leverage with the 50 EMA strategy?
Yes, you can use leverage, but it’s important to do so carefully. Over-leveraging can lead to significant losses if the market moves against you. Always ensure that you’re managing your risk appropriately by not risking more than 1-2% of your trading account on any single trade.


