Smart Money Concepts (SMC) terminology encompasses a set of trading strategies and principles that focus on understanding and leveraging the actions of institutional traders, often referred to as “smart money.” These concepts provide traders with insights into market behavior by analyzing price movements, order blocks, liquidity zones, and key levels that are influenced by large-scale investors. By mastering SMC terminology, traders can align their strategies with those of institutional players, thereby enhancing their ability to make informed and strategic trading decisions. This introduction delves into the core terminologies of SMC, offering a comprehensive understanding of the key elements that drive market movements. If you are looking for an online forex broker to apply SMC strategies, finding a reliable platform is crucial for success.

Understanding Smart Money Concepts
Smart money concepts (SMC) are fundamental for traders seeking to navigate the complexities of financial markets by analyzing the actions of institutional investors. These entities, including hedge funds, institutional investors, central banks, and seasoned professional traders, possess substantial capital and resources. Their strategies often involve leveraging advanced technologies, extensive research capabilities, and privileged access to market-moving information.
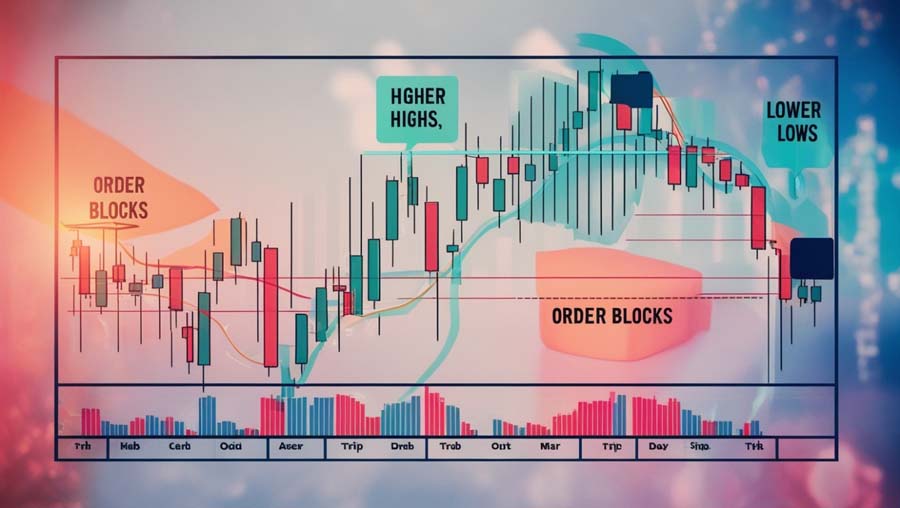
Key Aspects of Smart Money Analysis:
- Market Influence: Smart money players wield significant influence over market dynamics due to their ability to execute large-scale trades. Their entry or exit from positions can trigger substantial price movements, making it crucial for traders to monitor their activities closely.
- Predictive Insights: Analyzing smart money behavior provides predictive insights into potential market directions. For instance, accumulation of a particular asset by institutional investors may indicate an anticipated price increase, while distribution could signal an impending decline.
- Strategic Advantage: Aligning with smart money strategies can provide retail traders with a strategic edge. By identifying and following institutional trends, traders can position themselves advantageously in the market, enhancing profitability and risk management.
- Risk Management: Smart money players are renowned for their rigorous risk management practices. By observing their behavior, traders can identify optimal entry and exit points, set effective stop-loss levels, and improve overall risk-reward ratios.
Understanding these core concepts empowers traders to decipher market movements more effectively and make informed decisions aligned with institutional strategies. By incorporating smart money analysis into their trading approach, traders can enhance their ability to navigate volatile market conditions and achieve sustainable trading success.
Core Concepts of SMC Terminology
1. Price Action vs. Order Blocks & Liquidity
Price action involves studying historical price movements to predict future trends by analyzing charts and identifying patterns such as candlestick formations, support and resistance levels, and trend lines.
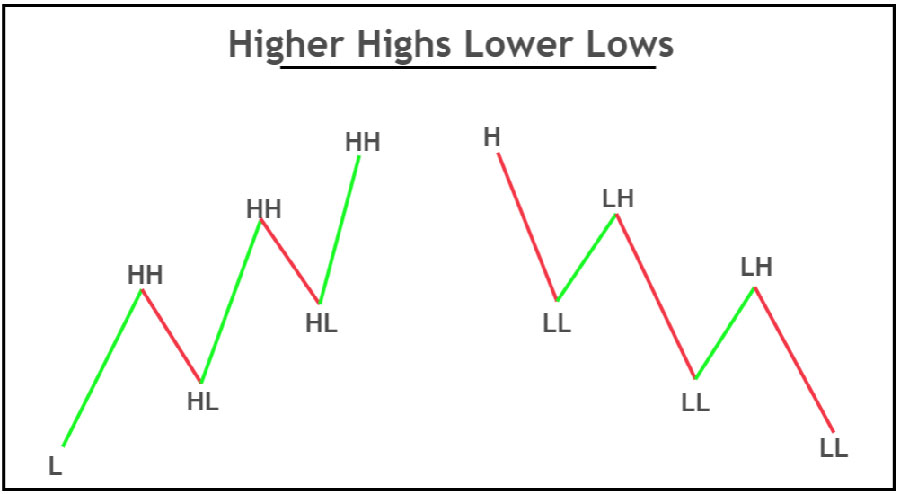
- Key Terms in Price Action:
- Higher Highs (HH): New highs higher than previous highs, indicating an uptrend. Traders look for HHs to confirm that the market is in a strong upward movement.
- Higher Lows (HL): New lows higher than previous lows, confirming an uptrend. HLs indicate that the buyers are in control and are stepping in at higher levels.
- Lower Highs (LH): New highs lower than previous highs, indicating a downtrend. LHs suggest weakening buyer strength and increasing seller dominance.
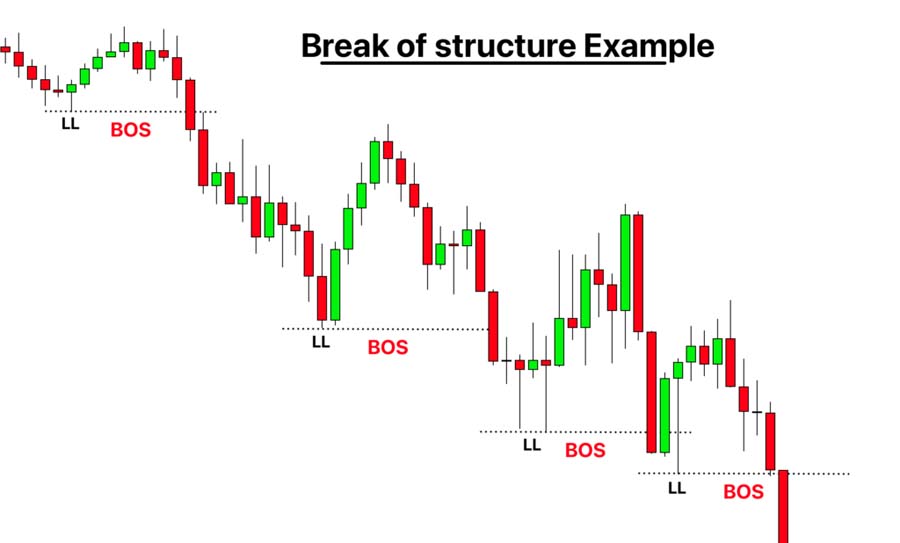
- Lower Lows (LL): New lows lower than previous lows, confirming a downtrend. LLs show that sellers are pushing the market lower, and the trend is likely to continue downward.
Order Blocks:
Order blocks are zones where institutional traders place large buy or sell orders, which act as significant support or resistance levels. These blocks are crucial for identifying potential price reversals or continuations. Understanding the different types of order blocks can enhance a trader’s ability to anticipate market movements and make informed decisions.
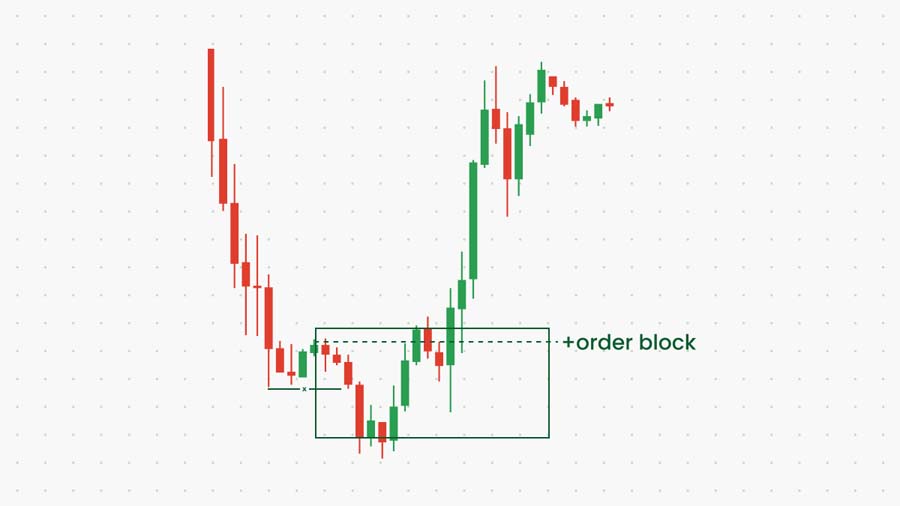
- Bullish Order Block:
- Definition: A zone where large buy orders are placed, typically forming around a significant low before a price increase.
- Application: Acts as a strong support level, indicating where institutional traders are likely accumulating long positions. Traders look for bullish order blocks to enter buy trades at potential reversal points.
- Bearish Order Block:
- Definition: A zone where large sell orders are placed, typically forming around a significant high before a price decrease.
- Application: Acts as a strong resistance level, indicating where institutional traders are likely accumulating short positions. Traders look for bearish order blocks to enter sell trades at potential reversal points.
- Mitigation Block:
- Definition: An area where the market retraces to a previous order block to “mitigate” unfilled orders left by institutions.
- Application: Used to identify potential entry points when the price revisits an order block after a significant move. Traders watch for mitigation blocks to enter trades in the direction of the initial institutional order flow.
- Breaker Block:
- Definition: A former order block that has been breached by price movement, indicating a strong shift in market sentiment.
- Application: Once broken, these blocks can act as either support or resistance, depending on the direction of the breach. Traders use breaker blocks to confirm a change in trend and find entry points in the direction of the new trend.
- Rejection Block:
- Definition: A zone where the price has repeatedly been rejected, forming a strong support or resistance level.
- Application: Acts as a crucial area for potential reversals or continuation patterns. Traders watch for rejection blocks to place trades with higher confidence in the market’s response to these levels.
- Vacuum Block:
- Definition: An area with low liquidity where price moves rapidly through, often filling a gap left by institutional orders.
- Application: Used to anticipate swift price movements through low liquidity zones. Traders look for vacuum blocks to enter trades, expecting quick moves as the price fills the vacuum.
Read More: The Smart Money Concept (SMC)
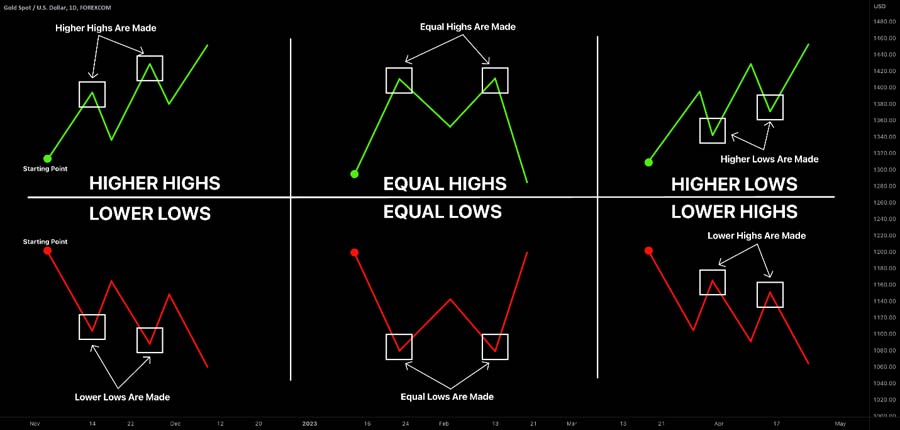
Equal Highs (EQH) and Equal Lows (EQL):
- Definition: Occur when the price forms highs or lows at the same level multiple times, indicating strong support or resistance zones.
- Application: Used to identify significant levels for entering and exiting trades. These levels often act as magnets for price action and can be pivotal points for market reversals or breakouts.
Liquidity (Liq):
- Definition: Refers to the availability of assets that can be quickly bought or sold without causing significant price changes.
- Application: Helps in identifying potential support and resistance levels and executing trades efficiently. Liquidity zones are often targeted by institutional traders to execute large orders without causing dramatic price swings.
AMD (Accumulation Manipulation Distribution):
- Phases:
- Accumulation: The phase where institutional traders accumulate positions at low prices.
- Manipulation: Temporary price movements intended to mislead retail traders.
- Distribution: The phase where institutional traders distribute their positions at higher prices.
2. Identifying Key Levels: PDL, PDH, etc.
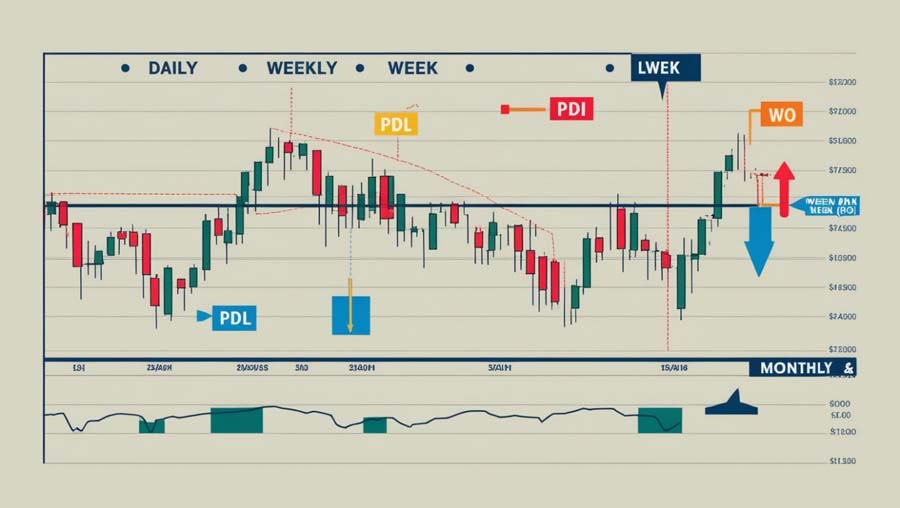
Daily Key Levels:
- Previous Day Low (PDL): The lowest price of the previous trading day, often serving as a support level. Traders watch for price reactions at this level to gauge market strength or weakness.
- Previous Day High (PDH): The highest price of the previous trading day, often serving as a resistance level. It helps in determining potential breakout or reversal points.
- Day Open (DO): The opening price of the current trading day, which can act as a pivot point for intraday trading strategies.
Weekly Key Levels:
- Previous Week High (PWH): The highest price during the previous week, acting as a significant resistance level. Monitoring this level helps traders identify long-term resistance.
- Previous Week Low (PWL): The lowest price during the previous week, acting as a significant support level. It is crucial for recognizing potential buying zones.
- Week Open (WO): The opening price of the current trading week, providing a reference point for weekly market analysis.
Read More: Sentiment Analysis In Forex
Monthly and Yearly Key Levels:
- Month Open (MO): The opening price of the current trading month, helping in identifying long-term trends. It provides a broader perspective on market direction.
- Year Open (YO): The opening price of the current trading year, providing insights into annual trends and potential long-term reversals. It is significant for understanding the overall market sentiment over a longer period.
3. SMC Terminology for Market Action
Break of Structure (BOS):
- Definition: Occurs when the price breaks a key level of support or resistance, indicating a potential change in market direction.
- Application: Used to identify entry and exit points, signaling the end of a trend and the beginning of a new one. A BOS is critical for traders to adjust their positions according to the new market dynamics.
Change of Character (CHoCH):
- Definition: Describes a shift in market sentiment, typically following a BOS, indicating a transition from one market phase to another.
- Application: Confirms that a BOS is not a false signal, allowing traders to adjust their strategies to align with the new market direction. CHoCH helps in verifying the sustainability of a new trend.
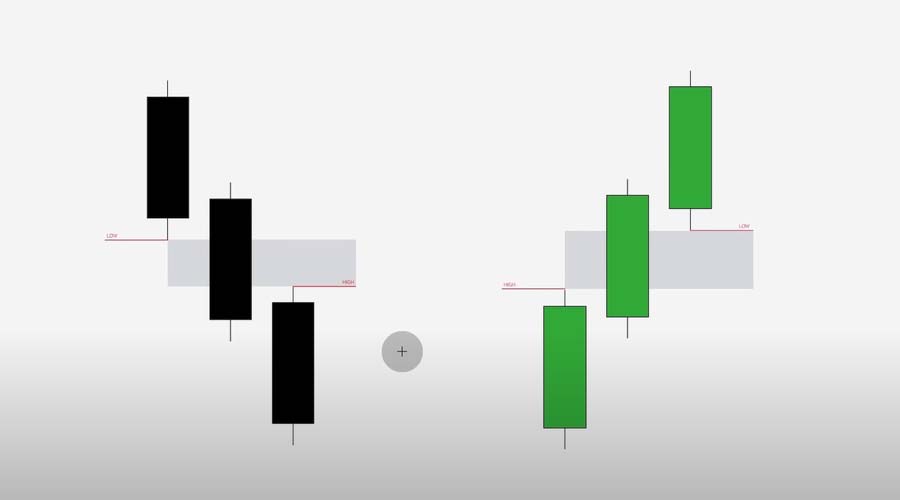
Fair Value Gaps (FVGs):
- Definition: Price gaps created by an imbalance between buyers and sellers, often during high volatility periods.
- Application: Used to identify potential entry and exit points as the price often returns to fill the gap. FVGs provide opportunities for trades when the market seeks to rebalance itself.
Order Block Events (Liquidity Grabs):
- Definition: Occur when the price moves sharply to capture liquidity before reversing direction, often around key levels.
- Application: Helps anticipate potential price reversals and avoid false breakouts. Recognizing these events can lead to more accurate predictions of market movements and better trade placement.
Read more: Market Makers In Forex Market
4. Market Structure and Momentum
Market Structure (MS):
- Definition: Refers to the overall trend and pattern of price movements, including uptrends, downtrends, and ranges.
- Application: Used to determine the current phase of the market and make informed trading decisions. Understanding MS helps traders align their strategies with the prevailing market conditions.
Momentum (MOM):
- Definition: Measures the speed of price movement over time, indicating strong buying or selling pressure or consolidation.
- Application: Gauges the strength of a trend and identifies potential reversals. MOM is crucial for confirming the validity of trends and adjusting trading strategies accordingly.
5. Timeframes (TF)
Definition: Periods over which price movements are analyzed.
- Common Timeframes:
- Monthly (MN): Analysis over a month.
- Weekly (W): Analysis over a week.
- Daily (D): Analysis over a day.
- 4 Hours (H4): Analysis over four hours.
- 1 Hour (H1): Analysis over one hour.
- 15 Minutes (M15): Analysis over fifteen minutes.
- 1 Minute (M1): Analysis over one minute.
Application: Multiple timeframes provide a comprehensive market view, helping to identify long-term trends and short-term entry points. Traders use a combination of timeframes to develop a holistic understanding of market behavior and to fine-tune their trading strategies based on both macro and micro market trends.
By understanding and utilizing these core concepts and terminologies, traders can better navigate the markets and align their strategies with those of smart money players. This comprehensive knowledge of smart money concepts provides a solid foundation for making informed trading decisions.
Conclusion
Understanding and utilizing smart money concepts can provide traders with a strategic edge in the market. By learning the key terminologies and concepts outlined in this article, traders can better anticipate market movements and align their strategies with those of institutional investors. However, it is crucial to combine these concepts with other technical analysis tools and remain aware of their limitations to achieve consistent trading success.
What are some common pitfalls to avoid when using smart money concepts?
When using smart money concepts, traders should avoid relying solely on these concepts without incorporating other technical analysis tools. Overtrading based on perceived smart money movements can also lead to losses. It’s essential to remain patient and wait for clear signals before entering or exiting trades.
How can retail traders access information on smart money movements?
Retail traders can access information on smart money movements through various means, such as following financial news, using trading platforms that offer order flow analysis, and subscribing to market analysis reports from reputable sources. Additionally, some advanced trading software provides insights into institutional order flow.
Are there specific markets or securities where smart money concepts are more effective?
Smart money concepts can be applied across various markets and securities, but they tend to be more effective in highly liquid markets, such as forex, major stock indices, and commodities. These markets have significant institutional participation, making it easier to identify and analyze smart money movements.


One Response
I do not even know how I finished up here, however I believed this publish was good. I do not realize who you might be however certainly you are going to a well-known blogger if you aren’t already 😉 Cheers!