The 55 EMA Swing Trading Strategy is a powerful tool for traders who aim to capitalize on market trends with precision and consistency. By integrating the Exponential Moving Average (EMA) into your trading plan, you gain the ability to filter out market noise, track trends effectively, and time your trades with confidence. The 55 EMA, in particular, strikes the perfect balance between short-term fluctuations and long-term trend identification, making it ideal for swing trading strategies that last several days to weeks.

For traders using a forex trading broker or any other market platform, the 55 EMA swing trading strategy provides clear signals for market direction, which are essential for entering and exiting trades at the most opportune moments. Whether you’re new to trading or an experienced trader looking to sharpen your skills, mastering this strategy can lead to more consistent trading outcomes.
In this comprehensive guide, we will break down the key components of the 55 EMA swing trading strategy, how to implement it, and valuable insights to help you avoid common pitfalls. Additionally, we will explore how to enhance your trading approach by pairing the 55 EMA with other indicators like the RSI (Relative Strength Index).
Understanding the 55 EMA: What You Need to Know
What is an Exponential Moving Average (EMA)?
The Exponential Moving Average (EMA) is a type of moving average that assigns more weight to the most recent data points, allowing traders to better capture the latest price trends. Unlike the Simple Moving Average (SMA), which gives equal importance to all data, the EMA responds faster to recent price changes, making it a valuable tool for trend-following strategies like swing trading.
The 55 EMA specifically looks at the average price over 55 periods, which can be days, hours, or any other time frame you set on your trading platform.

Why Choose the 55 EMA?
- Balanced View: The 55 EMA provides a balanced perspective that is neither too short-term nor too long-term. Shorter EMAs (e.g., 20 EMA) may generate false signals due to market noise, while longer EMAs (e.g., 200 EMA) may react too slowly to recent price shifts. The 55 EMA strikes a middle ground, making it suitable for swing trading.
- Fibonacci Influence: The number 55 is part of the Fibonacci sequence, which is used in various trading strategies to identify potential retracement levels. This adds an extra layer of significance to the 55 EMA and enhances its use in identifying key market points.
Read More: 5 EMA Swing Trading Strategy
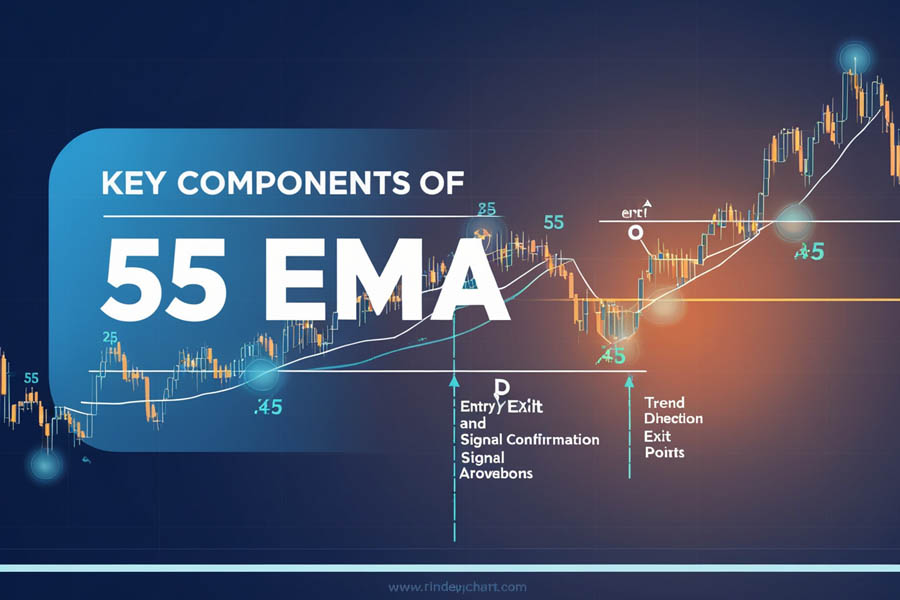
Key Components of the 55 EMA Swing Trading Strategy

- Trend Identification
The 55 EMA swing trading strategy is built on identifying market trends. The 55-period Exponential Moving Average (EMA) reacts quickly to price changes, offering a reliable way to determine the market’s direction.- Uptrend: If the price is above the 55 EMA, it signals an uptrend, encouraging buying or holding long positions.
- Downtrend: When the price is below the 55 EMA, it indicates a downtrend, signaling potential short-selling opportunities.
The 55 EMA often acts as a dynamic support or resistance level. Understanding the trend is vital for swing traders, as trading in the trend’s direction boosts the chances of success.
- Example: In a bullish market, when the price touches but holds above the 55 EMA, it may indicate continued strength, offering a good entry point for long positions.
- Retracements and Pullbacks
Even strong trends experience pullbacks, and these moments offer swing traders a chance to enter at a better price. In this strategy, pullbacks to the 55 EMA are crucial points of interest.- Uptrend Example: When the price pulls back to the 55 EMA in an uptrend but remains above, it signals that the trend is still intact, and traders can enter long positions.
- Downtrend Example: If the price retraces to the 55 EMA in a downtrend but fails to break above, it suggests that the downtrend remains strong, making it an ideal shorting opportunity.
- Confirmation Indicators
Relying solely on the 55 EMA may lead to false signals, so pairing it with confirmation tools like the RSI, MACD, or stochastic oscillator can increase accuracy.- RSI: If the price is above the 55 EMA and the RSI is over 50, it indicates a bullish trend.
- MACD: A MACD crossover above the signal line while the price is above the 55 EMA strengthens the buy signal.
- Stochastic Oscillator: In an uptrend, a bullish crossover in the stochastic oscillator, near the 55 EMA, signals an upward price continuation.
- Risk Management
Risk management is critical in any trading strategy. Use stop-loss orders to protect against unexpected market reversals. For example, place stop-losses just below the 55 EMA in an uptrend and just above in a downtrend.
Proper position sizing and maintaining a favorable risk-to-reward ratio (e.g., risking $1 for a potential $3 gain) are essential to managing risk and improving long-term profitability with the 55 EMA swing trading strategy.
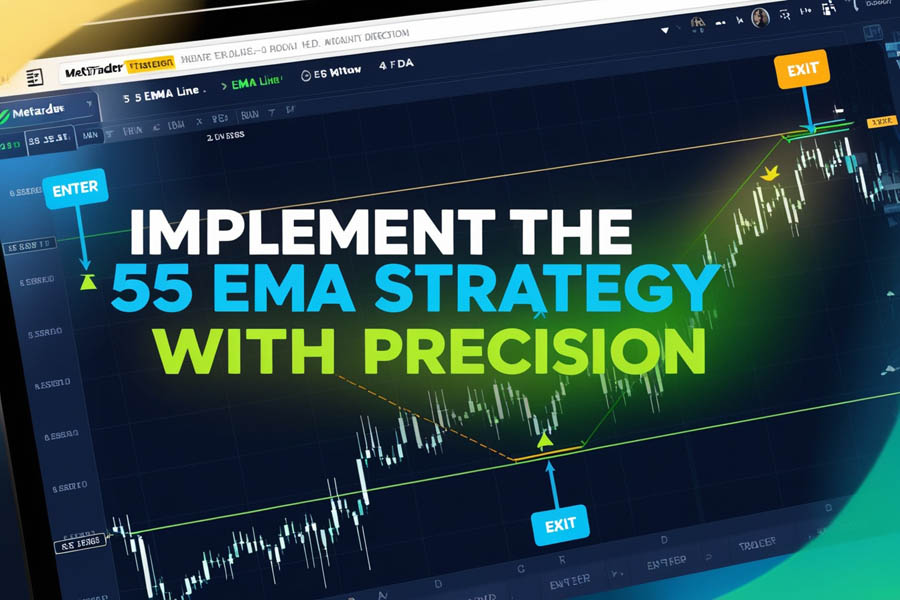
How to Implement the 55 EMA Swing Trading Strategy

Implementing the 55 EMA swing trading strategy can be a straightforward process if you follow a systematic approach. Below is a step-by-step guide designed to help traders effectively apply this strategy, ensuring they are well-prepared for live market conditions.
Read More: 50 EMA Swing Trading Strategy
Step 1: Configure the 55 EMA on Your Trading Platform
Before diving into trade setups, it’s essential to have the 55-period Exponential Moving Average (EMA) configured on your trading platform. Most platforms like MetaTrader 5 (MT5) and TradingView offer built-in tools that allow you to quickly add this indicator to your chart.
- MT5 Setup: On the MetaTrader 5 platform, click on Insert, go to Indicators > Trend, and select Moving Average. In the settings window, change the moving average type to Exponential and set the period to 55. This allows the EMA to calculate based on the most recent 55 price bars.
- TradingView Setup: On TradingView, click Indicators at the top of the chart, search for Moving Average Exponential, and adjust the length to 55 in the input settings. You can also personalize the EMA line’s color and thickness to make it more visible.
Once you configure the EMA, it will appear on your chart, serving as a dynamic level of support or resistance based on the price’s interaction with it.
Step 2: Identify the Trend
The first major decision when using the 55 EMA swing trading strategy is to determine the current market trend. The EMA makes this process simple by acting as a visual reference for market direction.
- Uptrend: If the price is trading above the 55 EMA, it indicates that the market is trending upward. Swing traders should look for buying opportunities during pullbacks to the EMA, as these temporary dips often offer ideal entry points in a bullish market.
- Example: In a rising stock market like Tesla (TSLA), if the price pulls back toward the 55 EMA after a strong rally and holds above it, this signals a good buying opportunity to ride the trend higher.
- Downtrend: If the price is trading below the 55 EMA, the market is in a downward trend. In this scenario, traders should focus on selling opportunities or entering short positions on pullbacks to the EMA.
- Example: In a falling cryptocurrency market like Ethereum (ETH), if the price pulls back to the 55 EMA but fails to break above it, this could confirm that the downtrend is still in effect, offering a chance to enter a short trade.
Identifying the trend is critical for swing traders. Trading in the direction of the prevailing trend increases the probability of a successful trade and minimizes the risk of being caught in a market reversal.
Step 3: Confirm with Other Indicators
Relying solely on the 55 EMA can sometimes lead to false signals. For this reason, it’s important to use confirmation indicators that help validate the strength of the trend and increase the likelihood of success. Popular confirmation tools include the Relative Strength Index (RSI) and the Moving Average Convergence Divergence (MACD).
- RSI Confirmation: The RSI measures momentum and helps to determine whether the market is overbought or oversold. When paired with the 55 EMA, it provides an extra layer of confirmation. In an uptrend, if the RSI is above 50, it confirms strong buying pressure. In a downtrend, an RSI below 50 signals strong selling pressure.
- Example: If the price crosses above the 55 EMA but the RSI is still below 50, it may indicate weak bullish momentum. Traders should wait until the RSI moves above 50 before entering a long trade, as this confirms the strength of the trend.
- MACD Confirmation: The MACD compares two moving averages to indicate changes in momentum. When the MACD line crosses above its signal line and the price is above the 55 EMA, it confirms a bullish trend. In contrast, a MACD cross below its signal line while the price is below the 55 EMA confirms bearish momentum.
- Example: In a forex pair like GBP/USD, if the price is below the 55 EMA and the MACD crosses below its signal line, this can confirm a short trade setup, signaling that the market is likely to continue its downward trend.
By combining the 55 EMA with these indicators, traders can filter out false signals and enter trades with greater confidence.
Step 4: Enter the Trade
Once the trend has been identified and confirmed with additional indicators, you can proceed to execute your trade. Timing is critical here, as waiting for confirmation helps reduce the risk of entering a trade based on a weak or temporary signal.
- Buy Setup: When the price is above the 55 EMA, the RSI is above 50, and the MACD shows a bullish crossover, you can enter a long position. For swing traders, the best time to buy is often when the price pulls back to the EMA in an uptrend, as this gives a favorable entry point.
- Example: In a bullish trend for the Nasdaq (NDX), if the price pulls back to the 55 EMA and the RSI is above 50, it confirms a buying opportunity. Entering at this stage allows you to capitalize on the continuation of the trend.
- Sell Setup: In a downtrend, when the price is below the 55 EMA, the MACD shows a bearish crossover, and the RSI is below 50, this confirms a short trade setup. Traders should enter short positions on pullbacks to the 55 EMA.
- Example: In a declining commodity like crude oil, if the price rises to the 55 EMA but fails to break above it, while the MACD confirms downward momentum, this is an ideal point to enter a short trade, expecting further price declines.
By waiting for confirmation before entering the trade, you reduce the risk of jumping into the market prematurely and improve your chances of capturing larger price movements.
Step 5: Set Stop-Loss and Take-Profit Levels
Managing risk is one of the most important aspects of successful trading. Setting proper stop-loss and take-profit levels helps you protect your capital and lock in profits when the market moves in your favor.
- Stop-Loss: For long trades, place your stop-loss below the 55 EMA to protect yourself in case the price reverses. For short trades, set your stop-loss above the 55 EMA. This allows you to exit the trade quickly if the market moves against you.
- Example: If you enter a long position at $150, placing a stop-loss at $145 ensures that you limit your losses if the price breaks below the 55 EMA, signaling a potential trend reversal.
- Take-Profit: As the trade progresses, adjust your take-profit levels to lock in gains. Many traders use a risk-to-reward ratio of 1:2 or 1:3, meaning you aim to make at least twice the amount you risked. You can also use previous support and resistance levels as a guide for where to take profits.
- Example: In an uptrend, if you enter a long position at $150 and the previous resistance level is at $160, you might set a take-profit order at $160 to lock in gains when the price reaches that target.
By incorporating stop-loss and take-profit strategies, you ensure that your trades are managed effectively, minimizing risk while maximizing potential profits.
Read More: 200 EMA Swing Trading
Why the 55 EMA Swing Trading Strategy Works
- Smoothing Out Market Noise
One of the primary reasons the 55 EMA swing trading strategy is so effective is that it smooths out the noise of the market. While shorter moving averages might give too many signals, and longer moving averages can lag, the 55 EMA provides the perfect blend, reacting to price changes while filtering out insignificant fluctuations.
- Timing and Flexibility
The 55 EMA is flexible across different timeframes, whether you’re trading on the 4-hour chart or daily chart. Its versatility makes it a favorite among traders of various markets, including forex, crypto, and commodities.
- Building Confidence in Trades
Many traders face the challenge of second-guessing their decisions. By using the 55 EMA in conjunction with confirmation indicators, traders can feel more confident in their trades, knowing they are relying on solid technical analysis rather than emotions.
Opofinance Services: Trade with Confidence and Security
When implementing advanced strategies like the 55 EMA swing trading strategy, it’s crucial to choose a broker that offers a secure and reliable platform. Opofinance, an ASIC-regulated broker, provides exactly that. As a part of the MT5 brokers list, it offers superior trading conditions with access to advanced technical analysis tools, including moving averages like the 55 EMA.

Opofinance is also known for its social trading service, allowing traders to follow and copy successful strategies. With safe and convenient deposit and withdrawal methods, you can focus on trading without worrying about the security of your funds.
Conclusion: Mastering the 55 EMA Swing Trading Strategy
The 55 EMA swing trading strategy is a robust method that helps traders identify trends, enter trades with confidence, and manage risk effectively. By incorporating additional indicators like the RSI and MACD, traders can further refine their approach and enhance their decision-making process.
To be successful with this strategy, it’s important to avoid common mistakes such as over-relying on the EMA alone or ignoring market context. With the right practice and discipline, the 55 EMA swing trading strategy can be a valuable tool in any trader’s arsenal.
Can the 55 EMA swing trading strategy be applied to stocks?
Yes, the 55 EMA swing trading strategy can be applied to stock markets. Many traders use this approach to capitalize on price trends in individual stocks or indices. The key is to adapt the timeframe based on your trading style, whether it’s short-term or long-term swing trading.
How does the 55 EMA compare to the 200 EMA for swing trading?
The 55 EMA reacts quicker to price changes than the 200 EMA, making it more suitable for swing trading where trades are typically held for a shorter period. The 200 EMA is often used for identifying long-term trends, while the 55 EMA is ideal for catching intermediate trends.
Can I use the 55 EMA on shorter timeframes?
While the 55 EMA can be used on shorter timeframes, it is most effective on higher timeframes like the 4-hour or daily chart. Using it on lower timeframes might generate false signals due to market noise.


