Are you searching for a reliable trading strategy that yields consistent profits? The Ichimoku and Fibonacci strategy might be the breakthrough you’ve been looking for. In the ever-changing world of forex trading, where market movements can be unpredictable, having a robust strategy is essential. By combining the Ichimoku Cloud and Fibonacci retracement techniques, traders can gain deeper insights into market trends and potential reversal points. This comprehensive approach not only enhances trading accuracy but also helps in making informed decisions.
Whether you’re a seasoned trader or just starting out with a regulated forex broker like Opofinance, understanding how to effectively utilize the Ichimoku Fibonacci strategy can significantly improve your trading performance. In this article, we’ll delve deep into each of these indicators, explore how they can be combined for maximum effectiveness, and provide step-by-step guidance on implementing this Ichimoku Fibonacci trading strategy in your routine.
Ready to elevate your trading game? Let’s dive in!
Understanding Ichimoku Cloud
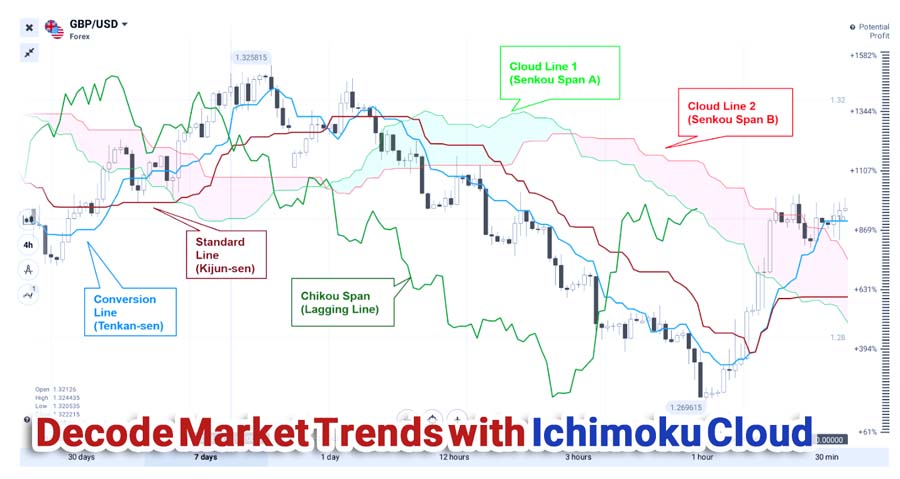
The Ichimoku Cloud, developed by Japanese journalist Goichi Hosoda, is more than just a single indicator; it’s a comprehensive system that provides a multi-dimensional view of the market. Understanding its components is crucial for interpreting the signals effectively, as each element works together to provide a holistic view of market dynamics.
Components of Ichimoku Cloud
- Tenkan-Sen (Conversion Line): Acts as a short-term moving average, indicating short-term price momentum and potential support or resistance levels. Calculated over the past nine periods, a rising Tenkan-Sen suggests an uptrend, while a falling line indicates a downtrend.
- Kijun-Sen (Base Line): Serves as a medium-term moving average, providing insights into intermediate price momentum. Calculated over the past 26 periods, it offers signals similar to the Tenkan-Sen but over a longer timeframe.
- Senkou Span A (Leading Span A) and Senkou Span B (Leading Span B): These form the cloud or Kumo, a central element of the Ichimoku system. Senkou Span A is plotted 26 periods ahead and represents the average of the Tenkan-Sen and Kijun-Sen. Senkou Span B, also plotted 26 periods ahead, represents the average of the highest high and lowest low over the past 52 periods. The space between these two lines forms the cloud, projecting potential future support or resistance levels.
- Chikou Span (Lagging Span): Provides a lagging perspective of price action by plotting the current closing price 26 periods back. It helps confirm trends, with its position relative to past prices indicating bullish or bearish momentum.
How Ichimoku Provides Insights
The Ichimoku Cloud isn’t just about individual lines; it’s about how these lines interact with each other and with the price action. It offers a multi-layered analysis that can significantly enhance a trader’s understanding of the market.
- Trend Identification: When the price is above the cloud and the cloud is green (Senkou Span A above Senkou Span B), it indicates a bullish trend. Conversely, when the price is below the cloud and the cloud is red (Senkou Span B above Senkou Span A), it signals a bearish trend.
- Momentum Signals: Crossovers of the Tenkan-Sen and Kijun-Sen generate momentum signals. A bullish crossover, where the Tenkan-Sen crosses above the Kijun-Sen, indicates upward momentum and a potential buy signal. A bearish crossover suggests the opposite.
- Support and Resistance Levels: The cloud acts as dynamic support and resistance, with thicker clouds suggesting stronger levels. Since the cloud is plotted 26 periods ahead, it provides forward-looking insights into potential future support or resistance areas.
- Confirmation with Chikou Span: The Chikou Span adds another layer of confirmation, supporting bullishness if it’s above the price from 26 periods ago and bearishness if below.
Fibonacci Retracement Basics
The Fibonacci retracement tool is based on the Fibonacci sequence, closely related to the “Golden Ratio” (approximately 1.618), which appears in various natural phenomena.
Explanation of Fibonacci Levels
In trading, Fibonacci retracement levels are horizontal lines indicating where support and resistance are likely to occur. The key levels are derived from the ratios of:
- 23.6%
- 38.2%
- 50% (commonly used, though not a Fibonacci ratio)
- 61.8%
- 78.6%
These levels are calculated by taking high and low points on a chart and marking the key Fibonacci ratios horizontally to produce a grid.
Importance in Identifying Reversal Points
Fibonacci retracement levels help predict market corrections by indicating potential areas where the price might reverse after a significant movement. These levels often correspond with price areas where the market has reacted in the past, making them valuable for identifying support and resistance.
Traders use Fibonacci levels to set entry and exit points. They might enter a trade when the price hits a retracement level that aligns with other signals or use Fibonacci extensions (161.8%, 261.8%, etc.) to set profit targets. Since many traders watch these levels, they can become self-fulfilling prophecies as market participants act upon them.
Combining Ichimoku and Fibonacci
How to Use Ichimoku Signals to Confirm Fibonacci Retracement Levels
When trading, relying on a single indicator can lead to false signals. Combining Ichimoku and Fibonacci provides a stronger basis for decision-making. By overlaying Fibonacci retracement levels on the Ichimoku Cloud, traders can identify confluence zones where both indicators suggest potential support or resistance. These areas become high-probability zones for potential reversals or continuations.
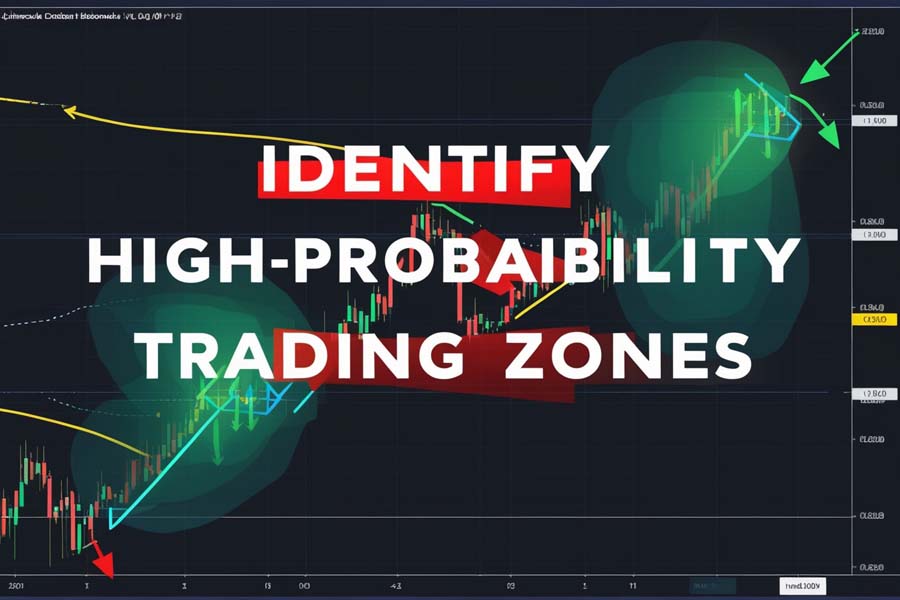
For example, if the price retraces to a Fibonacci level that aligns with Ichimoku support, and the Tenkan-Sen crosses above the Kijun-Sen, it provides a stronger bullish signal. Similarly, if the price retraces to a Fibonacci level aligning with Ichimoku resistance, and the Tenkan-Sen crosses below the Kijun-Sen, it suggests a stronger bearish signal.
Strategies for Entering Trades Based on Combined Signals
To improve the chances of entering high-probability trades using the Ichimoku Fibonacci strategy, follow this systematic approach:
- Identify the Primary Trend: Use the Ichimoku Cloud to determine if the market is in an uptrend or downtrend. Confirm with the Chikou Span and the position of the Tenkan-Sen and Kijun-Sen.
- Apply Fibonacci Retracement: In an uptrend, draw the Fibonacci retracement from the swing low to the swing high. In a downtrend, draw from the swing high to the swing low.
- Look for Confluence: Identify Fibonacci levels that coincide with Ichimoku components, such as the Kijun-Sen or the edges of the cloud.
- Wait for Confirmation: Enter the trade when both indicators align and provide confirming signals.
Step-by-Step Trading Strategy

Trend Identification: Using Ichimoku to Determine Market Direction
Begin by assessing the Ichimoku Cloud:
- Above the Cloud: Indicates a bullish trend.
- Below the Cloud: Indicates a bearish trend.
- Within the Cloud: Suggests consolidation or indecision.
Check the future cloud (Senkou Span A and B) to see if it supports a continued trend. A thicker cloud suggests stronger support or resistance. Examine the Chikou Span’s position relative to past prices to reinforce the trend direction.
Retracement Analysis: Applying Fibonacci Retracement to Identify Correction Levels
Identify the most recent significant swing high and swing low. Apply the Fibonacci retracement tool to these points to plot the retracement levels. Look for overlap with Ichimoku lines and observe how the price behaves around these levels.
Entry Confirmation: Waiting for Confirmation from Both Ichimoku and Fibonacci Indicators
Wait for Ichimoku signals, such as a bullish crossover of the Tenkan-Sen and Kijun-Sen near a key Fibonacci level. Candlestick patterns like hammers or engulfing patterns add further confirmation. Ensure the Chikou Span supports the trade direction.
Risk Management: Setting Stop-Loss Orders Based on Key Levels
Set stop-loss orders below support levels for long positions or above resistance levels for short positions. Determine your risk-reward ratio, aiming for at least 1:2. Adjust your position size to ensure the potential loss does not exceed your risk tolerance per trade.
Exit Strategies: Utilizing Fibonacci Extensions for Profit-Taking
Use Fibonacci extension levels to identify potential exit points. Consider scaling out of the position at different levels to secure profits. Monitor Ichimoku signals for trend reversals and stay alert to market conditions.
Practical Examples
Case Study 1: EUR/USD
Imagine the EUR/USD has been in a steady uptrend, with the price above the Ichimoku Cloud. A recent pullback brings the price down to the 38.2% Fibonacci retracement level.
Analysis:
- Ichimoku Signals: Price remains above the cloud, indicating an overall bullish trend. The Tenkan-Sen is above the Kijun-Sen but approaching it, and the Chikou Span is above the price from 26 periods ago.
- Fibonacci Confluence: The 38.2% retracement level aligns with the Kijun-Sen line.
Trade Execution:
Wait for the Tenkan-Sen to bounce off the Kijun-Sen or cross back above it. Set a stop-loss just below the 50% Fibonacci level and the lower boundary of the cloud. Use the 161.8% Fibonacci extension level as the profit target.
Outcome:
The price resumes its uptrend, and the trade reaches the take-profit level, resulting in a gain of 150 pips.
Case Study 2: GBP/JPY
Consider the GBP/JPY in a downtrend, with the price below the Ichimoku Cloud. A retracement brings the price up to the 61.8% Fibonacci level.
Analysis:
- Ichimoku Signals: Price touches the bottom of the cloud but does not break through. The Tenkan-Sen is below the Kijun-Sen, supporting a bearish outlook, and the Chikou Span is below the price from 26 periods ago.
- Fibonacci Confluence: The 61.8% retracement level coincides with the bottom of the cloud.
Trade Execution:
Enter a short position when the price fails to break above the cloud and shows bearish candlestick patterns. Set a stop-loss just above the cloud and the 78.6% Fibonacci level. Aim for the previous swing low or use Fibonacci extensions for targets.
Outcome:
The price reverses and continues downward, hitting the take-profit levels, resulting in a gain of 200 pips.
Advanced Techniques
Using RSI in Conjunction with Ichimoku and Fibonacci for Enhanced Accuracy
Incorporating the Relative Strength Index (RSI) can provide additional momentum confirmation. RSI values above 70 suggest overbought conditions, while below 30 indicates oversold conditions. When RSI indicates oversold conditions at a key Fibonacci retracement level, and Ichimoku signals a bullish reversal, the probability of a successful trade increases.
Divergence signals can also be valuable. A bullish divergence occurs when the price makes lower lows, but the RSI makes higher lows. Conversely, a bearish divergence suggests a potential downward reversal.
Exploring Additional Indicators That Complement the Strategy
Other indicators can enhance the Ichimoku Fibonacci trading strategy:
- Moving Average Convergence Divergence (MACD): Helps confirm trend direction and momentum shifts.
- Bollinger Bands: Identifies periods of high or low volatility.
- Volume Indicators: Tracks cumulative volume flow to confirm trends.
- Candlestick Patterns: Reversal patterns like Doji, Hammer, or Shooting Star signal potential reversals at key levels.
Pro Tips for Advanced Traders
- Backtesting: Test your strategy on historical data to evaluate its effectiveness before applying it in live trading.
- Multi-Timeframe Analysis: Use higher timeframes to confirm trends identified on lower timeframes.
- Use of Fibonacci Time Zones: Predict potential time periods for market reversals.
- Economic Calendar Monitoring: Be aware of scheduled news releases that can cause sudden market movements.
- Emotional Discipline: Stick to your plan and avoid impulsive decisions based on emotions.
Common Mistakes to Avoid
Misinterpretation of Signals
- Overlooking the Big Picture: Focusing too narrowly on one signal without considering the overall market context can lead to poor decisions.
- Ignoring Conflicting Signals: Wait for clear alignment between indicators.
- Forgetting Timeframe Differences: Ensure consistency by aligning your analysis across multiple timeframes.
Over-Reliance on One Indicator
- Tunnel Vision: Depending solely on either Ichimoku or Fibonacci can result in missed opportunities.
- Neglecting Market Fundamentals: Always be aware of economic news or geopolitical events.
- Emotional Trading: Allowing emotions to override your strategy can lead to impulsive decisions.
Opofinance Services
Looking for a reliable partner to implement your trading strategies? Opofinance is an ASIC-regulated broker offering exceptional services tailored for traders of all levels.

Social Trading Platform
- Copy Successful Traders: Access a network of experienced traders and replicate their strategies.
- Diversify Your Portfolio: Follow multiple traders to spread risk.
- Performance Metrics: Analyze detailed statistics of top traders before copying.
Featured on MT5 Brokers List
- Advanced Trading Platform: Benefit from MetaTrader 5’s robust features, including advanced charting tools for the Ichimoku and Fibonacci strategy.
- Custom Indicators: Implement custom indicators and expert advisors.
- Multi-Asset Trading: Trade forex, commodities, indices, and more.
Safe and Convenient Deposits and Withdrawals
- Secure Transactions: Use encrypted channels for all financial operations.
- Multiple Payment Methods: Choose from bank transfers, credit cards, and e-wallets.
- Fast Processing Times: Enjoy quick deposit and withdrawal times.
Regulated Forex Broker
- ASIC Regulation: Assurance of compliance with strict financial standards.
- Client Fund Protection: Segregated accounts to protect your capital.
Join Opofinance today and take your trading to the next level with a broker that understands your needs.
Conclusion
Integrating the Ichimoku and Fibonacci strategy offers a robust approach to forex trading. By combining the trend-identifying capabilities of the Ichimoku Cloud with the retracement insights provided by Fibonacci levels, traders can make more informed decisions, potentially increasing profitability.
Remember, successful trading isn’t about finding a single “holy grail” indicator but about how you combine and apply various tools to understand the market better. Continuous practice, disciplined risk management, and ongoing education are the keys to long-term success.
Now it’s your turn to put this strategy into action. Start experimenting with it on a demo account, refine your skills, and take your trading to new heights.
Key Takeaways
- Combined Strength: Using the Ichimoku and Fibonacci strategy enhances trading accuracy.
- Confirmation is Key: Wait for both indicators to align before entering a trade.
- Risk Management: Setting stop-loss orders and managing your risk-reward ratio is essential.
- Continuous Learning: Regularly update your knowledge and adapt your strategies.
- Practice Makes Perfect: Utilize demo accounts to refine your Ichimoku Fibonacci trading strategy.
- Choose the Right Broker: Partnering with a regulated forex broker like Opofinance provides the tools necessary for success.
What are the best timeframes for using Ichimoku and Fibonacci together?
The best timeframes depend on your trading style:
Day Traders: 5-minute, 15-minute, or 1-hour charts.
Swing Traders: 4-hour or daily charts.
Position Traders: Daily, weekly, or monthly charts.
Ensure the timeframe aligns with your trading objectives and consistently apply your analysis within that timeframe.
How do I adjust my strategy for different market conditions?
Trending Markets: Use Ichimoku to identify the trend and Fibonacci for pullbacks.
Range-Bound Markets: Be cautious; the cloud may not provide clear direction.
High Volatility: Adjust stop-loss orders to account for increased price swings.
Low Volatility: Use tighter stops and targets; avoid overtrading.
Can beginners effectively use this combined strategy?
Can beginners effectively use this combined strategy?
Yes, but it requires:
Education: Understand each indicator individually before combining them.
Practice: Use demo accounts to gain experience.
Simplicity: Focus on main signals and avoid overcomplicating.
Mentorship: Consider using social trading platforms like Opofinance’s to learn from experienced traders.


