Are you searching for a reliable trading strategy that can enhance your forex trading performance? Combining Ichimoku and RSI might be the game-changer you’ve been looking for. This powerful Ichimoku RSI strategy merges the strengths of two popular technical indicators to provide clearer signals and better trading opportunities. Whether you’re a beginner or an experienced trader working with a regulated forex broker, understanding how to effectively use RSI and Ichimoku together can significantly elevate your trading success.

In the fast-paced world of forex trading, having a strategy that effectively identifies trends and momentum is crucial. The Ichimoku Kinko Hyo, with its comprehensive market view, and the Relative Strength Index (RSI), with its momentum-measuring capabilities, form a potent combination. This guide will delve deep into how you can harness the synergy of these indicators, offering practical steps, pro tips, and insights to help you navigate the forex market confidently.
Understanding Ichimoku Kinko Hyo
What Is Ichimoku Kinko Hyo?
Ichimoku Kinko Hyo, often referred to simply as Ichimoku, is a versatile technical analysis indicator developed by Japanese journalist Goichi Hosoda in the late 1930s. The term translates to “One Glance Equilibrium Chart,” aptly describing its ability to provide a snapshot of market conditions at a glance.
Ichimoku is not just a single indicator but a comprehensive system that offers insights into trend direction, momentum, support and resistance levels, and potential reversal points. It’s widely used in forex trading due to its effectiveness in identifying market trends and helping traders make informed decisions.
Read More: Ichimoku and MACD
Key Components of Ichimoku
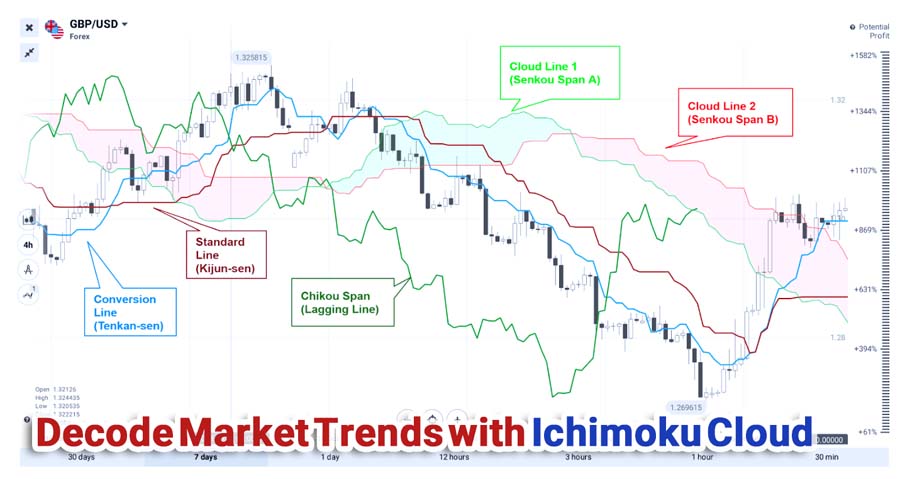
The Ichimoku system consists of five main components:
- Tenkan-sen (Conversion Line):
- Calculation: (Highest High + Lowest Low) ÷ 2 over the past 9 periods.
- Purpose: Reflects short-term price momentum and acts as a signal line.
- Important Note: A crossover between the Tenkan-sen and Kijun-sen can indicate a potential trend change.
- Kijun-sen (Base Line):
- Calculation: (Highest High + Lowest Low) ÷ 2 over the past 26 periods.
- Purpose: Represents medium-term trend and serves as a support or resistance level.
- Important Note: Traders often use the Kijun-sen to set stop-loss levels.
- Senkou Span A (Leading Span A):
- Calculation: (Tenkan-sen + Kijun-sen) ÷ 2, plotted 26 periods ahead.
- Purpose: Forms one boundary of the Ichimoku Cloud.
- Important Note: The cloud ahead provides insights into future support and resistance levels.
- Senkou Span B (Leading Span B):
- Calculation: (Highest High + Lowest Low) ÷ 2 over the past 52 periods, plotted 26 periods ahead.
- Purpose: Forms the other boundary of the Ichimoku Cloud.
- Important Note: A thicker cloud suggests stronger support or resistance.
- Chikou Span (Lagging Span):
- Calculation: Current closing price plotted 26 periods back.
- Purpose: Confirms trend direction by comparing current prices to past prices.
- Important Note: If the Chikou Span is above the past prices, it indicates bullish momentum.
The Ichimoku Cloud (Kumo)
The area between Senkou Span A and Senkou Span B is shaded to form the Ichimoku Cloud or Kumo. This cloud is the centerpiece of the Ichimoku system and provides vital information about future support and resistance levels.
- Bullish Cloud:
- Occurs when Senkou Span A is above Senkou Span B.
- Indicates potential support and a bullish market sentiment.
- Bearish Cloud:
- Occurs when Senkou Span A is below Senkou Span B.
- Suggests potential resistance and a bearish market outlook.
The Ichimoku Cloud allows traders to anticipate future price movements and make informed trading decisions.
Understanding the Relative Strength Index (RSI)
What Is RSI?
The Relative Strength Index (RSI) is a popular momentum oscillator developed by J. Welles Wilder Jr. in 1978. It measures the speed and change of price movements and oscillates between 0 and 100.
RSI helps traders identify overbought and oversold conditions in the market, which can signal potential reversal points. It’s a valuable tool for confirming trend strength and momentum, making it an excellent complement to the Ichimoku indicator.
How RSI Works
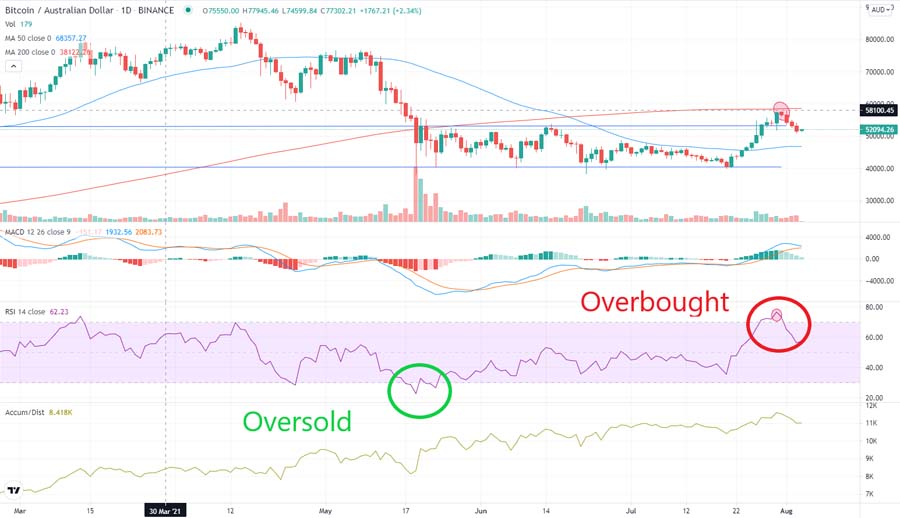
- Overbought Conditions:
- RSI Above 70: Indicates the asset may be overbought.
- Implication: Prices could reverse downward soon.
- Oversold Conditions:
- RSI Below 30: Suggests the asset may be oversold.
- Implication: Prices might reverse upward shortly.
- Centerline (50 Level):
- RSI Above 50: Confirms bullish momentum.
- RSI Below 50: Indicates bearish momentum.
RSI is instrumental in measuring the strength of price movements, helping traders gauge market momentum.
Interpreting RSI Divergences
- Bullish Divergence:
- Occurs when the price makes a lower low, but RSI forms a higher low.
- Signal: Potential upward reversal.
- Bearish Divergence:
- Happens when the price makes a higher high, but RSI forms a lower high.
- Signal: Possible downward reversal.
Divergences between RSI and price action can provide early warning signs of trend reversals.
Read More: Ichimoku and Elliott Wave
Combining Ichimoku and RSI for a Powerful Strategy
Benefits of the Ichimoku RSI Strategy
Merging Ichimoku and RSI creates a robust trading strategy that leverages the strengths of both indicators:
- Enhanced Trend Confirmation:
- Ichimoku identifies trend direction and key support/resistance levels.
- RSI confirms the momentum behind the trend.
- Improved Entry and Exit Points:
- RSI helps validate signals generated by Ichimoku, leading to better-timed trades.
- Reduced False Signals:
- The combination filters out market noise, increasing the accuracy of trading signals.
By using both indicators together, traders can gain a comprehensive view of the market, improving decision-making.
Practical Steps to Implement the Strategy
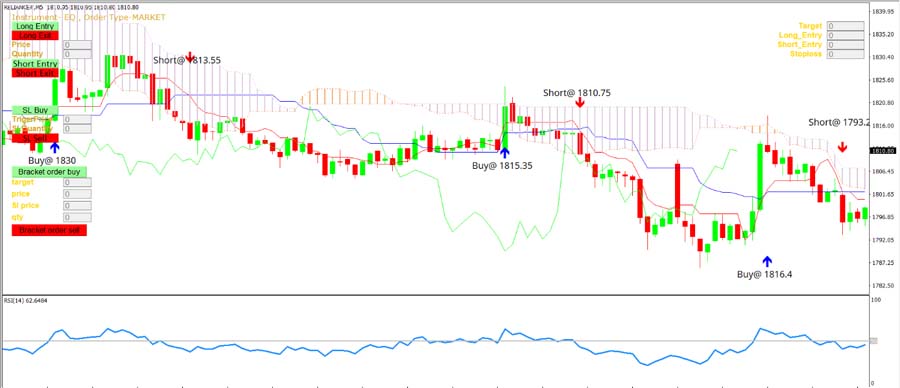
Step 1: Identify the Trend with Ichimoku
- Bullish Trend:
- Price Above the Cloud: Indicates an uptrend.
- Tenkan-sen Above Kijun-sen: Confirms bullish momentum.
- Chikou Span Above Price: Supports bullish sentiment.
- Bearish Trend:
- Price Below the Cloud: Suggests a downtrend.
- Tenkan-sen Below Kijun-sen: Confirms bearish momentum.
- Chikou Span Below Price: Reinforces bearish outlook.
Step 2: Confirm Momentum with RSI
- Bullish Momentum:
- RSI Above 50: Indicates buyers are in control.
- RSI Moving Upwards: Suggests strengthening momentum.
- Bearish Momentum:
- RSI Below 50: Indicates sellers dominate.
- RSI Moving Downwards: Signals increasing bearish momentum.
Step 3: Execute Trades
- Entering Long Positions (Buy):
- Criteria:
- Price is above the Ichimoku Cloud.
- Tenkan-sen crosses above Kijun-sen.
- RSI crosses above 50.
- Action:
- Place a buy order.
- Set a stop-loss below the Kijun-sen or recent swing low.
- Criteria:
- Entering Short Positions (Sell):
- Criteria:
- Price is below the Ichimoku Cloud.
- Tenkan-sen crosses below Kijun-sen.
- RSI crosses below 50.
- Action:
- Place a sell order.
- Set a stop-loss above the Kijun-sen or recent swing high.
- Criteria:
Step 4: Managing the Trade
- Take-Profit Levels:
- Identify potential support/resistance levels for exit points.
- Use previous highs/lows or Fibonacci retracements.
- Trailing Stop-Loss:
- Adjust your stop-loss to lock in profits as the trade moves in your favor.
- Use the Tenkan-sen or Kijun-sen as reference points.
Always consider using stop-loss orders to manage risk effectively and protect your capital.
Examples of the Ichimoku RSI Strategy in Action
Example 1: Bullish Trade on EUR/USD
- Scenario:
- Price breaks above the Ichimoku Cloud.
- Tenkan-sen crosses above Kijun-sen.
- RSI moves above 50.
- Action:
- Enter a long position.
- Set a stop-loss below the Kijun-sen.
- Take profit at the next resistance level.
Example 2: Bearish Trade on GBP/JPY
- Scenario:
- Price falls below the Ichimoku Cloud.
- Tenkan-sen crosses below Kijun-sen.
- RSI drops below 50.
- Action:
- Enter a short position.
- Set a stop-loss above the Kijun-sen.
- Take profit at the next support level.
These examples demonstrate how combining Ichimoku and RSI can identify high-probability trading opportunities.
Pro Tips for Advanced Traders
Tip 1: Multi-Timeframe Analysis
- Why It’s Useful:
- Confirms signals across different timeframes.
- Aligns short-term entries with long-term trends.
- How to Apply:
- Use a higher timeframe (e.g., daily) to identify the primary trend with Ichimoku.
- Use a lower timeframe (e.g., 1-hour) to time entries and exits with RSI.
Multi-timeframe analysis enhances the reliability of your trading signals.
Tip 2: Adjust RSI Settings
- Standard RSI Period: 14
- Experiment with Different Periods:
- Shorter Periods (e.g., 9): Makes RSI more sensitive to price changes.
- Longer Periods (e.g., 21): Smooths out RSI, reducing false signals.
- Customize Overbought/Oversold Levels:
- Adjust levels to 80/20 in strong trends to avoid premature exits.
Tailoring RSI settings to your trading style can improve strategy effectiveness.
Tip 3: Combine with Other Indicators
- Moving Averages:
- Use exponential moving averages (EMAs) to confirm trend direction.
- Volume Indicators:
- Incorporate volume to validate the strength of price movements.
- Fibonacci Retracements:
- Identify potential support and resistance levels.
Additional indicators can provide further confirmation and enhance your trading decisions.
Tip 4: Stay Informed About Market Events
- Economic Calendars:
- Monitor key economic releases that may impact currency pairs.
- News Feeds:
- Stay updated with geopolitical events and market sentiment.
- Risk Management:
- Adjust position sizes during high-volatility periods.
Being aware of market events helps you anticipate volatility and adjust your strategy accordingly.
Read More: Ichimoku and EMA
Market Conditions for Effective Use
Analysis of Different Market Scenarios
Trending Markets:
- Characteristics:
- Clear directional movement, either upward or downward.
- Higher highs and higher lows in an uptrend; lower highs and lower lows in a downtrend.
- Effectiveness of Strategy:
- The Ichimoku and RSI strategy excels in trending markets, providing reliable signals aligned with the prevailing trend.
Range-Bound Markets:
- Characteristics:
- Price oscillates between defined support and resistance levels.
- Lack of clear directional movement.
- Effectiveness of Strategy:
- Signals may be less reliable.
- Consider using oscillators like RSI with different settings or additional range-based indicators.
Volatile Markets:
- Characteristics:
- High price fluctuations and rapid movements.
- Often caused by news events or economic data releases.
- Effectiveness of Strategy:
- Increased risk of false signals due to sudden price swings.
- Requires cautious approach and possibly wider stop-loss levels.
How to Adjust Strategies Based on Market Behavior
In Trending Markets:
- Align with the Trend:
- Focus on signals that go in the direction of the main trend.
- Use Ichimoku’s cloud and line positions to confirm trend strength.
- Adjust RSI Interpretation:
- In strong trends, RSI may remain overbought or oversold. Consider using the 80/20 levels instead of 70/30 to avoid premature exits.
In Range-Bound Markets:
- Modify Strategy:
- Use the Ichimoku Kijun-sen and Tenkan-sen lines as dynamic support and resistance levels.
- Consider shorter-term trades and quicker profit targets.
- Alternative Indicators:
- Incorporate other tools like Stochastic Oscillator or Bollinger Bands to better navigate sideways markets.
In Volatile Markets:
- Risk Management Emphasis:
- Tighten risk controls by reducing position sizes.
- Use wider stop-loss levels to accommodate larger price swings.
- Stay Informed:
- Be aware of economic calendars and avoid trading during major news releases if possible.
General Tips:
- Flexibility: Be prepared to adapt your strategy as market conditions change.
- Continuous Monitoring: Regularly assess market conditions and adjust your approach accordingly.
- Education: Invest time in learning about different market environments and how they impact trading strategies.
By tailoring your approach to the prevailing market conditions, you enhance the effectiveness of your trading strategy and improve your chances of success.
Risk Management Techniques

Importance of Setting Stop-Loss Orders
Effective risk management is critical in trading. Stop-loss orders serve as an essential tool to:
- Limit Potential Losses: By predefining the maximum acceptable loss on a trade, you protect your capital from significant drawdowns.
- Remove Emotional Decision-Making: Stop-loss orders execute automatically, reducing the impact of fear or greed on trading decisions.
- Preserve Capital for Future Opportunities: Limiting losses ensures you have sufficient capital to take advantage of future trading opportunities.
Strategies for Managing Risk When Trading with Ichimoku and RSI
Stop-Loss Placement:
- Below/Above Key Ichimoku Levels:
- For long positions, place the stop-loss below the Kijun-sen or below the lower boundary of the cloud.
- For short positions, place the stop-loss above the Kijun-sen or above the upper boundary of the cloud.
Position Sizing:
- Risk Per Trade:
- Determine a fixed percentage of your trading capital to risk on each trade (commonly 1-2%).
- Adjust position sizes accordingly to ensure consistency in risk exposure.
Use of Trailing Stops:
- Locking in Profits:
- As the trade moves in your favor, adjust the stop-loss to trail behind the price, securing gains while allowing for potential further profits.
- Based on Ichimoku Levels:
- Use moving averages like the Tenkan-sen or Kijun-sen to trail the stop-loss.
Diversification:
- Avoid Concentration Risk:
- Do not overexpose your portfolio to a single currency pair or correlated assets.
- Spread Risk Across Multiple Trades:
- Diversify your trades to mitigate the impact of any single loss.
Emotional Discipline:
- Stick to Your Plan:
- Avoid deviating from your predefined trading plan and risk management rules.
- Accept Losses as Part of Trading:
- Recognize that not all trades will be winners and that managing losses is key to long-term success.
Regular Review and Adjustment:
- Analyze Past Trades:
- Review both winning and losing trades to understand what worked and what didn’t.
- Adjust Strategies as Needed:
- Be willing to refine your risk management approach based on your trading experience and changing market conditions.
By implementing robust risk management techniques, you protect your trading capital and create a solid foundation for sustainable trading success.
Improving Your Trading Experience with Opofinance
Why Choose Opofinance?
As you implement the Ichimoku RSI strategy, partnering with a reliable regulated forex broker is crucial. Opofinance is an ASIC-regulated broker that offers a secure and innovative trading environment.
Key Features:
- Social Trading Service:
- Copy experienced traders and accelerate your learning curve.
- Access a community of successful traders and replicate their strategies.
- Featured on MT5 Brokers List:
- Trade on the advanced MetaTrader 5 platform.
- Utilize a wide range of technical indicators, including Ichimoku and RSI.
- Safe and Convenient Deposits and Withdrawals:
- Multiple funding options with fast processing times.
- Secure transactions to protect your funds.

Benefits of Trading with Opofinance
- Regulated and Trustworthy:
- ASIC regulation ensures adherence to strict financial standards.
- Competitive Trading Conditions:
- Tight spreads, low commissions, and flexible leverage options.
- Educational Resources:
- Access webinars, tutorials, and market analysis to enhance your trading knowledge.
- Dedicated Customer Support:
- Professional support team available to assist with any inquiries.
Opofinance provides the tools and support you need to succeed in the forex market.
Conclusion
Combining Ichimoku and RSI creates a robust trading strategy that can significantly enhance your forex trading performance. By identifying trends with Ichimoku and confirming momentum with RSI, you can make more informed trading decisions, reduce false signals, and improve your entry and exit points.
Partnering with a reliable online forex broker like Opofinance provides the support, tools, and resources necessary to implement this strategy effectively. With features like social trading, advanced platforms, and secure transactions, Opofinance can elevate your trading experience.
Take the next step in your trading journey by applying the Ichimoku RSI strategy and leveraging the advantages of a reputable broker.
Key Takeaways
- Combining Ichimoku and RSI:
- Forms a powerful trading strategy by merging trend analysis with momentum confirmation.
- Implementing the Strategy:
- Involves aligning signals from both indicators for higher accuracy.
- Pro Tips Enhance Effectiveness:
- Multi-timeframe analysis and customizing RSI settings can improve results.
- Partnering with a Reliable Broker:
- Using a regulated forex broker like Opofinance enhances your trading experience.
Understanding and applying the Ichimoku RSI strategy can be a game-changer in your forex trading journey.
Can I use the Ichimoku RSI strategy on any currency pair?
Yes, the Ichimoku RSI strategy is versatile and can be applied to any currency pair. However, it’s essential to consider the characteristics of each pair, such as volatility and liquidity. Major pairs like EUR/USD, GBP/USD, and USD/JPY often provide more reliable signals due to higher trading volumes.
What timeframes work best with the Ichimoku and RSI strategy?
The strategy works well on higher timeframes like 4-hour and daily charts, offering more reliable signals and reducing market noise. However, it can also be adjusted for shorter timeframes, such as 1-hour or 15-minute charts, depending on your trading style and risk tolerance. It’s important to test the strategy on different timeframes to find what works best for you.
Do I need to adjust the default settings of Ichimoku and RSI?
The default settings of Ichimoku and RSI are generally effective for most trading scenarios. However, adjusting the settings can tailor the indicators to specific market conditions or personal preferences. For example, you might adjust the RSI period or the overbought/oversold levels to suit a particular currency pair or trading timeframe.


