In the ever-evolving world of forex trading, staying ahead requires not only skill but also the effective use of powerful analytical tools. Two such tools that have stood the test of time are the Ichimoku Cloud and Elliott Wave Theory. When used individually, each provides valuable insights into market trends and potential price movements. However, combining Ichimoku and Elliott Wave can elevate your trading strategy to new heights, offering a comprehensive and nuanced understanding of the market.
This in-depth guide will explore how the synergy of Elliott Wave and Ichimoku can enhance your trading decisions. We’ll delve into the core concepts of both methods, show you how to integrate them effectively, and provide detailed examples to illustrate their combined power. Whether you’re a novice trader or an experienced professional, mastering these techniques can significantly improve your market analysis and trading outcomes.
Furthermore, partnering with a regulated forex broker like Opofinance ensures that you have the support and tools necessary to implement these advanced strategies successfully. Opofinance offers a secure and efficient trading environment, allowing you to focus on executing your trading plan with confidence.
Understanding Ichimoku Cloud
Components of Ichimoku Cloud
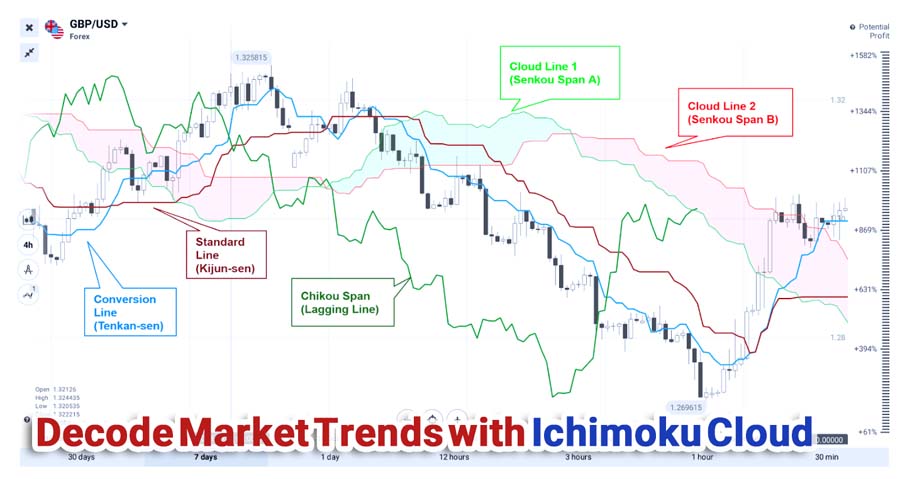
The Ichimoku Kinko Hyo, commonly known as the Ichimoku Cloud, is a comprehensive technical analysis indicator developed by Japanese journalist Goichi Hosoda in the late 1930s. Designed to provide a complete view of the market at a glance, the Ichimoku Cloud combines multiple indicators to offer insights into trend direction, momentum, and support and resistance levels. It consists of five key components:
- Tenkan-sen (Conversion Line):
- Calculation: (Highest High + Lowest Low) / 2 over the past 9 periods.
- Interpretation: Represents short-term market momentum and serves as a minor support/resistance level.
- Usage: Traders use the Tenkan-sen to gauge the trend’s strength and potential reversals in the short term.
- Kijun-sen (Base Line):
- Calculation: (Highest High + Lowest Low) / 2 over the past 26 periods.
- Interpretation: Reflects medium-term market momentum and acts as a major support/resistance level.
- Usage: The Kijun-sen is used to confirm trends and can signal potential trend changes when crossed by the Tenkan-sen.
- Senkou Span A (Leading Span A):
- Calculation: (Tenkan-sen + Kijun-sen) / 2, plotted 26 periods ahead.
- Interpretation: Forms one edge of the cloud (Kumo) and projects future support and resistance levels.
- Usage: A rising Senkou Span A indicates a bullish trend, while a falling line suggests a bearish trend.
- Senkou Span B (Leading Span B):
- Calculation: (Highest High + Lowest Low) / 2 over the past 52 periods, plotted 26 periods ahead.
- Interpretation: Forms the other edge of the cloud and, together with Senkou Span A, defines the cloud’s thickness.
- Usage: The position of Senkou Span B relative to Senkou Span A helps identify trend strength.
- Chikou Span (Lagging Span):
- Calculation: Current closing price plotted 26 periods back.
- Interpretation: Provides a visual representation of how current prices compare to previous prices.
- Usage: If the Chikou Span is above past prices, it confirms an upward trend; if below, it indicates a downward trend.
How to Interpret the Cloud for Trend Identification
The Kumo (Cloud) is the shaded area between Senkou Span A and Senkou Span B and is central to the Ichimoku system. It acts as a dynamic support and resistance area, providing valuable information about future price movements.
- Bullish Signals:
- Price Above the Cloud: Suggests a strong uptrend.
- Cloud Color: If Senkou Span A is above Senkou Span B, the cloud is bullish, often shaded green.
- Tenkan-sen Above Kijun-sen: Indicates bullish momentum.
- Chikou Span Above Price: Confirms the upward trend, as current prices are higher than past prices.
- Bearish Signals:
- Price Below the Cloud: Indicates a strong downtrend.
- Cloud Color: If Senkou Span A is below Senkou Span B, the cloud is bearish, often shaded red.
- Tenkan-sen Below Kijun-sen: Reflects bearish momentum.
- Chikou Span Below Price: Confirms the downward trend, as current prices are lower than past prices.
Understanding these signals allows traders to identify the prevailing market trend and make informed trading decisions.
Bullish vs. Bearish Signals Based on Price Position Relative to the Cloud
- Price Within the Cloud:
- Interpretation: The market is in a state of consolidation or indecision. The trend is considered neutral.
- Trading Strategy: Traders often wait for a clear breakout above or below the cloud before entering a trade.
- Cloud Thickness:
- Thick Cloud:
- Significance: Represents strong support or resistance levels.
- Implication: It is more challenging for the price to break through a thick cloud, indicating a potentially stable trend.
- Thin Cloud:
- Significance: Indicates weaker support or resistance.
- Implication: The price may break through a thin cloud more easily, suggesting possible volatility or trend reversals.
By analyzing the position of the price relative to the cloud and the cloud’s characteristics, traders can anticipate potential trend changes and adjust their strategies accordingly.
Read More: Ichimoku and MACD
Elliott Wave Theory Basics
Explanation of Elliott Wave Principles
Elliott Wave Theory, introduced by Ralph Nelson Elliott in the 1930s, is based on the observation that financial markets move in repetitive cycles or waves, driven by collective investor psychology and sentiment. Elliott identified that these patterns occur across various time frames and are fractal in nature, meaning they repeat on smaller and larger scales.
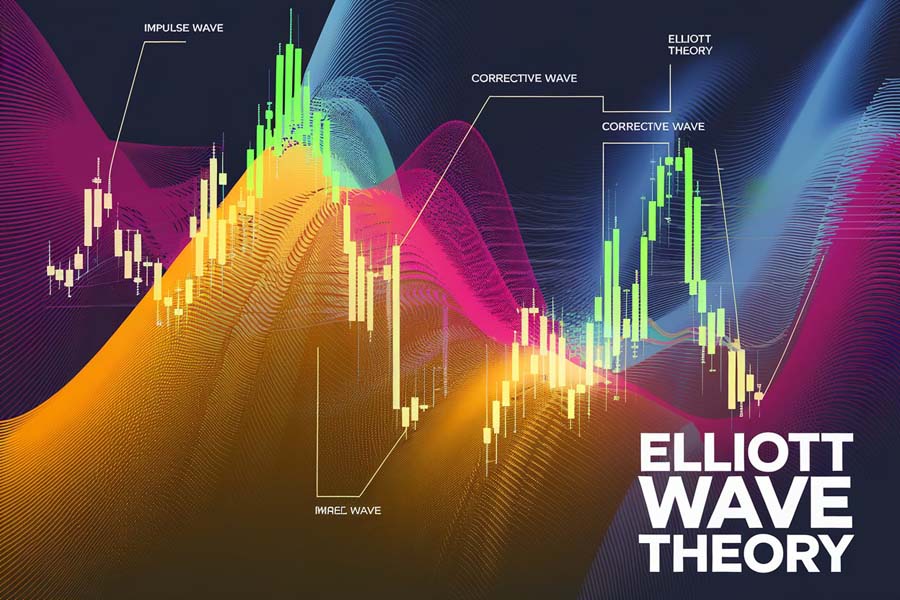
The theory posits that market movements can be categorized into two main types of waves:
- Impulse Waves: Move in the direction of the main trend.
- Corrective Waves: Move against the main trend.
Structure of Waves: Impulse and Corrective Waves
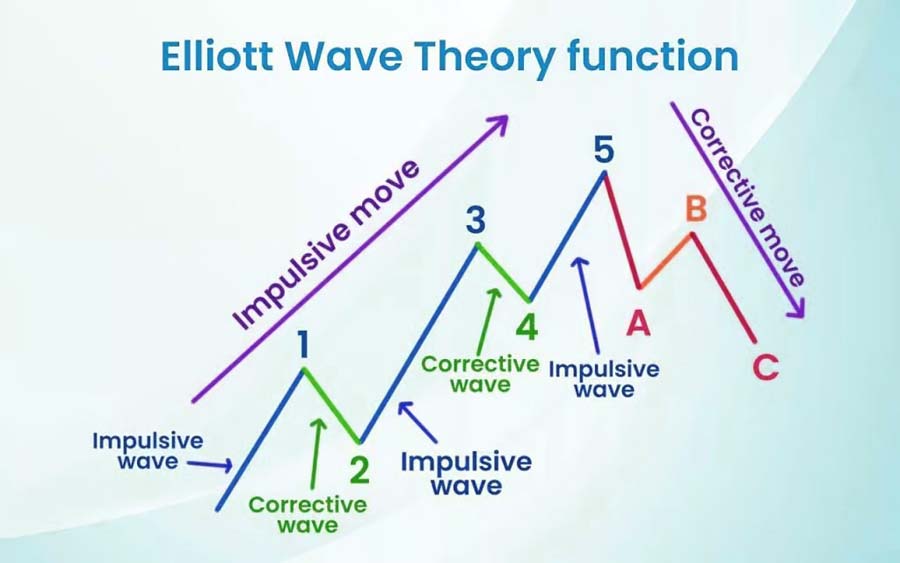
- Impulse Waves (Motive Waves):
- Structure: Consist of five sub-waves labeled 1 through 5.
- Characteristics:
- Wave 1: The initial move in the direction of the trend.
- Wave 2: A corrective wave that retraces part of Wave 1 but does not exceed its origin.
- Wave 3: Usually the strongest and longest wave, driven by increased momentum.
- Wave 4: Another corrective wave that retraces part of Wave 3 but does not overlap with Wave 1.
- Wave 5: The final impulse wave, often characterized by reduced momentum and potential divergences in technical indicators.
- Corrective Waves:
- Structure: Consist of three sub-waves labeled A, B, and C.
- Patterns:
- Zigzags: Sharp corrections with a 5-3-5 wave structure.
- Flats: Sideways movements with a 3-3-5 wave structure.
- Triangles: Contracting patterns indicating consolidation before a breakout.
Identifying Wave Patterns and Their Significance in Trading
- Fractal Nature of Waves:
- Each wave within a larger wave can be broken down into smaller waves following the same pattern.
- This fractal characteristic allows for multi-timeframe analysis, enhancing the precision of wave counts.
- Guidelines for Wave Identification:
- Wave 2 should not retrace more than 100% of Wave 1.
- Wave 3 cannot be the shortest among Waves 1, 3, and 5 and is often the most powerful.
- Wave 4 should not overlap with the price territory of Wave 1 in impulse waves.
- Fibonacci Relationships: Waves often exhibit lengths and retracements that align with Fibonacci ratios (e.g., 38.2%, 50%, 61.8%), assisting in predicting future price movements and potential reversal points.
- Trading Significance:
- Trend Identification: Recognizing whether the market is in an impulse or corrective phase helps determine the overall trend direction.
- Entry and Exit Points: Identifying wave completions can signal optimal times to enter or exit trades.
- Risk Management: Understanding wave structures aids in setting stop-loss levels and managing trade size.
By mastering Elliott Wave Theory, traders can anticipate market movements and enhance their trading strategies.
Combining Ichimoku Cloud with Elliott Wave
How to Use Ichimoku Signals to Confirm Elliott Wave Patterns
The integration of Elliott Wave and Ichimoku provides a powerful analytical framework that combines pattern recognition with momentum and trend indicators. Here’s how you can use Ichimoku signals to confirm Elliott Wave patterns:
- Validating Wave Counts:
- If Elliott Wave analysis suggests the start of an impulse wave (e.g., Wave 3), a corresponding bullish signal from the Ichimoku Cloud (such as price breaking above the cloud) confirms the analysis.
- Similarly, if a corrective wave is anticipated, bearish signals from the Ichimoku Cloud (like price falling below the cloud) can validate the expectation.
- Enhancing Trade Confidence:
- The convergence of signals from both Elliott Wave and Ichimoku increases the reliability of trade setups.
- Ichimoku indicators, such as the Tenkan-sen and Kijun-sen crossovers, can provide timely entry points within the wave structure identified by Elliott Wave analysis.
- Timing Entries and Exits:
- Use Ichimoku’s dynamic support and resistance levels (the cloud) to fine-tune entry and exit points determined by Elliott Wave counts.
- The Chikou Span can offer additional confirmation of trend direction and momentum.
Strategies for Trading Based on Both Indicators
Buy Signals: Conditions for Entering Trades
Scenario:
- Elliott Wave Analysis:
- Identification of the completion of Wave 2 and the beginning of Wave 3 in an uptrend.
- Wave 2 retraced to a key Fibonacci level (e.g., 61.8%), suggesting a strong potential for Wave 3.
- Ichimoku Signals:
- Price breaks above the Ichimoku cloud, indicating a bullish trend.
- The Tenkan-sen crosses above the Kijun-sen, confirming upward momentum.
- The Chikou Span is above the price and the cloud, supporting the bullish outlook.
Action Plan:
- Entry:
- Place a buy order when the price closes above the cloud and the Tenkan-sen crosses above the Kijun-sen.
- Stop-Loss:
- Set below the Kijun-sen or the recent swing low to manage risk.
- Take-Profit:
- Target levels can be set using Fibonacci extensions (e.g., 161.8% of Wave 1) or projected Wave 3 length based on Elliott Wave analysis.
Sell Signals: Conditions for Exiting Trades
Scenario:
- Elliott Wave Analysis:
- Completion of Wave 5, indicating that the uptrend may be ending and a corrective phase is likely.
- Potential for a significant retracement in the form of Waves A, B, and C.
- Ichimoku Signals:
- Price falls below the Tenkan-sen and Kijun-sen, signaling a loss of bullish momentum.
- The Tenkan-sen crosses below the Kijun-sen, providing a bearish crossover.
- The Chikou Span crosses below the price, confirming the downward shift.
Action Plan:
- Exit:
- Close existing long positions to secure profits and avoid potential losses during the corrective phase.
- Alternative Strategy:
- Consider entering a short position if bearish signals are strong and align with Elliott Wave expectations for a downward movement.
Read More: Ichimoku and RSI
Examples of Successful Trade Setups Using Both Indicators
Example 1: Capitalizing on an Uptrend in AUD/USD
Elliott Wave Analysis:
- Wave 2 completed after retracing 50% of Wave 1, a common Fibonacci retracement level.
- Anticipation of a strong Wave 3 upward movement.
Ichimoku Confirmation:
- Price breaks and closes above the Ichimoku cloud.
- The Tenkan-sen crosses above the Kijun-sen below the cloud, providing an early bullish signal.
- The Chikou Span moves above the price line and the cloud.
Trade Execution:
- Entry: Placed a buy order at the close of the breakout candle above the cloud.
- Stop-Loss: Set below the Kijun-sen and the recent swing low.
- Take-Profit: Targeted the 161.8% Fibonacci extension of Wave 1.
Outcome:
- The trade captured the strong upward movement of Wave 3, resulting in significant profits.
Example 2: Profiting from a Downtrend in EUR/USD
Elliott Wave Analysis:
- Completion of Wave 5 suggests the end of an uptrend.
- Expectation of a corrective ABC pattern moving downward.
Ichimoku Signals:
- Price breaks below the Ichimoku cloud, indicating a bearish trend.
- The Tenkan-sen crosses below the Kijun-sen, confirming downward momentum.
- The Chikou Span moves below the price line, supporting the bearish outlook.
Trade Execution:
- Entry: Placed a sell order after the bearish crossover and cloud breakout.
- Stop-Loss: Set above the Kijun-sen and the recent swing high.
- Take-Profit: Aimed for the length of Wave A projected from the end of Wave B.
Outcome:
- The trade successfully captured the downward movement of the corrective phase, resulting in profitable returns.
These examples illustrate how combining Elliott Wave and Ichimoku can enhance the accuracy of trade entries and exits, leading to improved trading performance.
Practical Applications in Trading

Day Trading vs. Long-Term Strategies Using Ichimoku and Elliott Wave
Day Trading Applications
- Time Frames: 5-minute to 1-hour charts.
- Approach:
- Focus on minor Elliott Waves.
- Use Ichimoku signals for quick entries/exits.
- Considerations:
- Be mindful of market volatility.
- Use tight stop-losses.
Long-Term Trading Applications
- Time Frames: Daily to weekly charts.
- Approach:
- Analyze major Elliott Wave cycles.
- Rely on Ichimoku cloud for trend direction.
- Considerations:
- Wider stop-losses to accommodate market swings.
- Patience for trends to develop.
Scanning Techniques for Identifying Trade Opportunities
- Automated Scanners:
- Use trading platforms to scan for Ichimoku breakouts.
- Identify potential Elliott Wave patterns.
- Manual Analysis:
- Regularly review charts of preferred instruments.
- Look for confluence of Ichimoku and Elliott Wave signals.
Efficient scanning helps traders find high-probability setups by combining ichimoku and elliott wave analysis.
Read More: Ichimoku and EMA
Real-Time Analysis and Trade Examples
Live Trading Steps
- Identify Trend:
- Use Ichimoku cloud to determine trend direction.
- Apply Elliott Wave Counts:
- Analyze recent price action for wave patterns.
- Confirm Signals:
- Look for Ichimoku signals that support Elliott Wave analysis.
- Execute Trade:
- Enter position based on combined signals.
- Manage Risk:
- Set appropriate stop-loss and take-profit levels.
Real-time application of elliott wave and ichimoku strategies enhances trading effectiveness.
Pro Tips for Advanced Traders
- Integrate Fibonacci Retracements:
- Align Fibonacci levels with Elliott Waves and Ichimoku support/resistance.
- Adjust Ichimoku Settings:
- Customize periods (e.g., 7, 22, 44) to suit different markets.
- Multi-Time Frame Analysis:
- Confirm signals across multiple time frames.
- Stay Informed:
- Keep up with market news that may impact technical analysis.
- Practice Discipline:
- Stick to your trading plan and manage emotions.
Advanced traders can refine their strategies by delving deeper into ichimoku and elliott wave techniques.
Opofinance: Your Trusted Partner in Trading
When implementing advanced trading strategies like combining Ichimoku and Elliott Wave, having a reliable and supportive broker is essential. Opofinance, an ASIC-regulated forex broker, offers a range of services and features designed to meet the needs of discerning traders.

Advantages of Trading with Opofinance
- Social Trading Service:
- Learn from Experts: Access a network of experienced traders and copy their trades in real-time.
- Community Engagement: Participate in discussions and share insights with other traders.
- Featured on MT5 Brokers List:
- Advanced Trading Platform: Utilize MetaTrader 5 (MT5), renowned for its robust charting tools and technical indicators, including Ichimoku and Elliott Wave tools.
- Customization and Automation: Take advantage of MT5’s capabilities for algorithmic trading and custom indicator development.
- Safe and Convenient Deposits and Withdrawals:
- Multiple Payment Options: Enjoy flexibility with various funding methods, including bank transfers, credit/debit cards, and e-wallets.
- Secure Transactions: Benefit from encryption and security protocols that protect your financial information.
- Exceptional Customer Support:
- Professional Assistance: Receive prompt and knowledgeable support from a dedicated team.
- Educational Resources: Access tutorials, webinars, and articles to enhance your trading skills.
- Regulated Environment:
- ASIC Regulation: Trade with confidence knowing that Opofinance adheres to strict regulatory standards, ensuring transparency and client protection.
By choosing Opofinance as your trading partner, you gain access to the tools, resources, and support necessary to effectively implement your Ichimoku and Elliott Wave strategies.
Conclusion
Mastering the combination of Ichimoku Cloud and Elliott Wave Theory can significantly enhance your trading performance. This powerful synergy offers:
- Comprehensive Market Analysis:
- A holistic view of market trends, momentum, and potential future price movements.
- The ability to anticipate market shifts with greater accuracy.
- Improved Trade Execution:
- More precise entry and exit points based on the convergence of signals from both methods.
- Enhanced risk management through well-defined stop-loss and take-profit levels.
- Versatility and Adaptability:
- Applicability across various markets, including forex, stocks, commodities, and cryptocurrencies.
- Suitability for different trading styles, from day trading to long-term investing.
By integrating these methodologies into your trading arsenal and partnering with a reputable broker like Opofinance, you position yourself to navigate the financial markets with confidence and skill.
Embark on your journey to trading excellence by harnessing the combined power of Elliott Wave and Ichimoku strategies.
Key Takeaways
- Synergistic Analysis:
- Combining Ichimoku and Elliott Wave provides a multidimensional perspective of the market, enhancing the accuracy of your analysis.
- Signal Confirmation:
- Using both indicators together strengthens trade signals and reduces the likelihood of false entries.
- Adaptable Strategies:
- These techniques can be tailored to suit various markets and trading styles, offering flexibility in your approach.
- Continuous Improvement:
- Ongoing learning and refinement of your strategies are essential for long-term success.
- Reliable Brokerage Support:
- Partnering with a regulated and supportive broker like Opofinance enhances your trading experience and facilitates the implementation of advanced strategies.
Can I apply Ichimoku and Elliott Wave strategies to markets other than forex?
Yes, both Ichimoku and Elliott Wave are versatile tools applicable to various financial markets, including stocks, commodities, indices, and cryptocurrencies. Each market may have its own characteristics, so it’s important to adjust your analysis and strategies accordingly.
How do I manage risk when combining these indicators?
Effective risk management involves setting appropriate stop-loss levels based on technical analysis, such as support and resistance identified by Ichimoku and Elliott Wave. Additionally, you should determine your position size based on your risk tolerance and avoid overleveraging.
Do I need advanced trading software to use these indicators effectively?
While basic versions of Ichimoku and Elliott Wave tools are available on many trading platforms, advanced software like MetaTrader 5 (MT5), offered by Opofinance, provides enhanced features. These include more sophisticated charting capabilities, custom indicators, and automated trading options, which can improve your analysis and execution.


