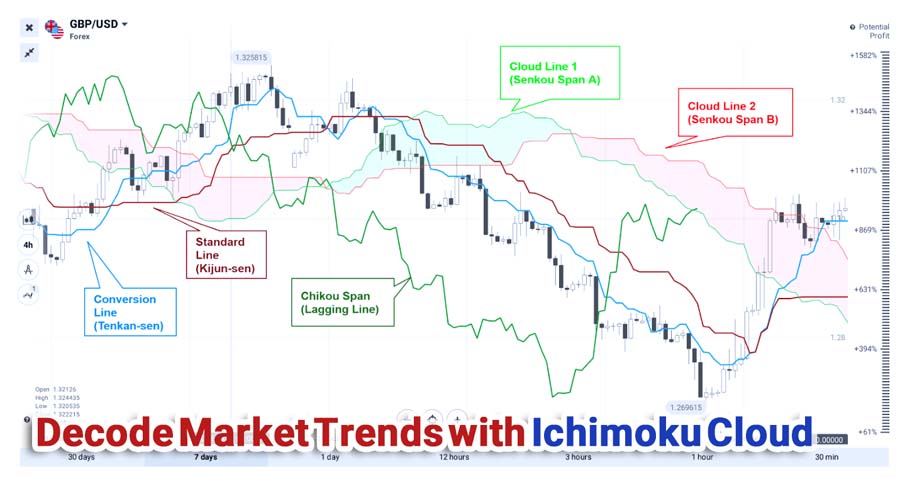
The Ichimoku Cloud is a technical analysis tool designed to provide a comprehensive view of market conditions, allowing traders to assess trend direction, strength, and key levels of support and resistance with a single glance. Created by Japanese journalist Goichi Hosoda, the Ichimoku Cloud—or Ichimoku Kinko Hyo, meaning “equilibrium at a glance”—was meticulously crafted over several decades to offer traders a highly visual, reliable system that reveals the market’s equilibrium points and future movement potential. Today, it’s widely used by traders globally, including those working with a regulated forex broker, due to its unique ability to simplify complex market analysis into a straightforward framework.

This article is a complete guide to mastering the Ichimoku Cloud, covering everything from its core components to advanced strategies. You’ll gain insights into what the Ichimoku Cloud tells you about the market, learn how to trade the Ichimoku Cloud effectively, and explore Ichimoku Cloud strategies for various market conditions. Whether you’re new to this tool or looking to refine your skills, this guide will enhance your understanding and trading success.
Why Traders Love the Ichimoku Cloud

Comprehensive Market Overview in One Tool
Unlike traditional indicators that focus on a single aspect of the market, the Ichimoku Cloud combines five components, offering a well-rounded market perspective. This tool allows traders to understand trend direction, momentum, and key levels of support and resistance in one glance, making it ideal for fast-moving markets like forex. Instead of overlaying multiple indicators, traders get a complete view from the Ichimoku Cloud alone.
Read More: Ichimoku and EMA
Versatile Across Markets and Timeframes
The Ichimoku Cloud’s flexibility is one of the reasons it’s so popular among forex and cryptocurrency traders, stock market analysts, and even commodity investors. Initially developed for Japanese markets, the tool is now used worldwide, with settings adaptable across multiple timeframes and asset classes. This adaptability makes the Ichimoku Cloud an excellent choice for traders working with a regulated forex broker, enabling them to implement effective Ichimoku Cloud strategies whether they are day trading or holding long-term positions.
Reliable in Identifying Trends and Momentum
The Ichimoku Cloud is particularly effective in trend and momentum analysis. By combining five interrelated components, it helps traders identify strong trends and potential reversals with a high degree of reliability. Elements like Tenkan-sen/Kijun-sen crossovers and cloud thickness signal trend strength and sustainability, making the Ichimoku Cloud a go-to tool for many traders.
Built-in Risk Management Features
The Ichimoku Cloud also assists traders in managing risk by visually defining support and resistance levels. Cloud boundaries, the Kijun-sen line, and the projected support/resistance zones help traders make informed decisions about entry, exit, and stop-loss placements, reducing unnecessary risk and promoting disciplined trading strategies.
“The Ichimoku Cloud’s unique, all-in-one design provides traders with a holistic view of market dynamics, making it invaluable for quick yet thorough technical analysis.”
Core Components of the Ichimoku Cloud: An In-Depth Look
Each component of the Ichimoku Cloud serves a unique function, and together, they offer a complete view of market conditions.

1. Tenkan-sen (Conversion Line)
The Tenkan-sen, or Conversion Line, is a short-term momentum indicator that reflects the immediate trend.
- Formula: (9-period high + 9-period low) / 2
- Purpose: Identifies short-term trends and momentum shifts.
- Applications:
- Detecting potential trend changes early.
- Acting as a short-term support or resistance level.
- Gauging trend strength based on the steepness of the line.
“The Tenkan-sen captures short-term momentum, allowing traders to recognize emerging trends promptly.”
2. Kijun-sen (Base Line)
The Kijun-sen, or Base Line, is a medium-term indicator that reflects equilibrium and the market’s balance over a longer period.
- Formula: (26-period high + 26-period low) / 2
- Purpose: Acts as a key level for determining trend direction and entry points.
- Applications:
- Confirming trend continuation or potential reversal.
- Serving as a guide for setting stop-loss levels.
- Functioning as a reliable support or resistance line in trending markets.
“The Kijun-sen is crucial for establishing the market’s equilibrium, offering insights into trend direction and ideal entry points.”
3. Senkou Span A (Leading Span A)
The Leading Span A, also known as Senkou Span A, is one of the boundaries of the cloud, providing a future outlook of support and resistance.
- Formula: (Tenkan-sen + Kijun-sen) / 2, plotted 26 periods ahead.
- Purpose: Offers predictive support and resistance, helping traders anticipate price movements.
- Applications:
- Assessing future support or resistance levels.
- Serving as an indicator of trend strength based on the cloud’s thickness.
- Helping identify the likely range of price movement.
“Leading Span A gives a forward-looking view of support and resistance, allowing traders to anticipate market reaction zones.”
4. Senkou Span B (Leading Span B)
The Leading Span B, or Senkou Span B, is the second cloud boundary and reveals more about the market’s longer-term trend.
- Formula: (52-period high + 52-period low) / 2, plotted 26 periods ahead.
- Purpose: Establishes long-term support/resistance levels and trend durability.
- Applications:
- Confirming the overall trend and market direction.
- Indicating strong support or resistance zones.
- Helping visualize market volatility through cloud thickness.
“The Senkou Span B outlines long-term trend direction and serves as a significant marker for major support and resistance.”
5. Chikou Span (Lagging Span)
The Chikou Span, or Lagging Span, plots the current price 26 periods behind, offering context by comparing it to past prices.
- Formula: Current closing price, plotted 26 periods behind.
- Purpose: Validates trend strength and highlights historical support and resistance.
- Applications:
- Confirming the prevailing trend.
- Identifying potential support/resistance based on past price behavior.
- Providing confirmation for potential reversals.
“The Chikou Span helps traders confirm trends and reversals by comparing current and historical prices, bringing context to market moves.”
Read More: Ichimoku and RSI
What Does the Ichimoku Cloud Tell You?
The Ichimoku Cloud is designed to provide traders with a well-rounded view of the market, offering insights into trend direction, momentum, support and resistance levels, and potential future price movement. By analyzing these various aspects simultaneously, the Ichimoku Cloud simplifies complex market data, allowing traders to make informed decisions quickly.
Key Insights from the Ichimoku Cloud
- Trend Direction
The cloud itself, made up of Senkou Span A and Senkou Span B, is a primary indicator of the trend:- Bullish Trend: When the price is above the cloud, it generally signals a bullish (upward) trend.
- Bearish Trend: When the price is below the cloud, it indicates a bearish (downward) trend.
- Consolidation or Uncertain Trend: If the price moves within the cloud, it suggests consolidation, a period where the market may not have a strong directional bias.
The cloud color also helps, with green typically indicating a bullish cloud (Senkou Span A above Senkou Span B) and red for a bearish cloud (Senkou Span B above Senkou Span A).
- Momentum and Trend Strength The Tenkan-sen (Conversion Line) and Kijun-sen (Base Line) indicate short-term and medium-term momentum, respectively:
- A steep Tenkan-sen shows strong short-term momentum, while a flatter line may signal a lack of momentum or potential reversal.
- When the Tenkan-sen crosses above the Kijun-sen, it signals a potential bullish momentum shift. Conversely, if it crosses below, it may indicate bearish momentum.
The cloud thickness also speaks to trend strength:
- Thicker clouds suggest a stronger, more durable trend that is less likely to reverse.
- Thin clouds may imply a weaker trend, indicating that a reversal is possible.
- Support and Resistance Levels Both Leading Span A (Senkou Span A) and Leading Span B (Senkou Span B) act as dynamic support and resistance levels:
- In an uptrend, the upper boundary of the cloud acts as support, with prices often finding support above the cloud.
- In a downtrend, the lower cloud boundary acts as resistance, with prices typically staying below this level.
These levels are projected 26 periods ahead, offering a unique, forward-looking perspective on potential support or resistance zones.
- Future Price Projections By plotting the Senkou Spans forward, the Ichimoku Cloud helps traders predict where support and resistance may develop in the future, allowing for proactive trading decisions. When the cloud is thick, it suggests the trend is likely to persist; if it narrows, a reversal or pause may be near.
- Historical Confirmation and Trend Validation The Chikou Span (Lagging Span) provides historical context:
- If the Chikou Span is above the price line, it suggests the bullish trend is strong, while below the price line suggests bearish strength.
- This lagging span helps confirm the trend direction, indicating if current prices align with past price action.
“The Ichimoku Cloud tells you not only where the market is currently but also projects potential support, resistance, and trend direction, allowing for well-informed, forward-looking trades.”
Summing Up: How to Use This Information in Trading
The Ichimoku Cloud provides insights that are both current and predictive:
- Trend and Momentum Confirmation: Identify the direction and strength of the trend before entering or exiting trades.
- Support/Resistance Zones: Use cloud boundaries to set stop-losses or take-profit points, reducing risk.
- Future Price Levels: Utilize forward-projected support/resistance to position trades in anticipation of market movement.
- Trend Reversal Indicators: Rely on cloud thickness and Chikou Span positioning for signals that the current trend may be weakening or reversing.
By combining these aspects, the Ichimoku Cloud enables traders to view the market holistically, making it an invaluable tool for identifying opportunities and managing risk.
Advanced Trading Strategies with Ichimoku Cloud

Multi-Timeframe Analysis for Greater Accuracy
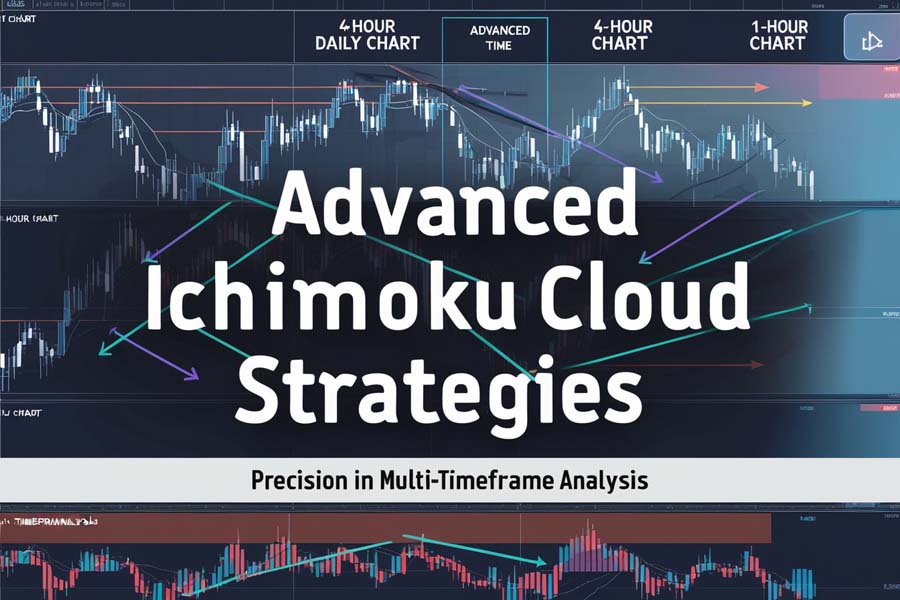
Multi-timeframe analysis enhances accuracy by aligning signals across various timeframes, giving traders a well-rounded perspective on market conditions.
Steps for Multi-Timeframe Analysis:
- Choose Key Timeframes:
- Daily Chart: Sets the primary trend direction.
- 4-Hour Chart: Refines entry and exit timing within the broader trend.
- 1-Hour Chart: Fine-tunes exact entry points.
- Confirm Trends Across Timeframes:
- Ensure price is above the cloud in all timeframes for a bullish trend and below for a bearish trend.
- Verify that Tenkan-sen and Kijun-sen crossovers align, enhancing trade reliability.
- Optimize Entry and Exit:
- Set entries based on 1-hour signals that align with the daily and 4-hour trends.
- Exit based on cloud boundaries or support/resistance levels for maximum accuracy.
Read More: ichimoku entry and exit
Trend Trading: Capitalizing on Momentum
The Ichimoku Cloud is ideal for trading with the trend, allowing traders to confirm the direction and strength of price movements.
Trend Trading Rules:
- Entry Conditions:
- Bullish Setup: Price above the cloud, with Tenkan-sen crossing above Kijun-sen and Chikou Span confirming the trend.
- Bearish Setup: Price below the cloud, with Tenkan-sen crossing below Kijun-sen and Chikou Span aligning with the trend.
- Exit Points and Risk Management:
- Place stop-losses near the Kijun-sen or cloud boundary.
- Set profit targets at historical support/resistance levels.
- Signal Confirmation:
- Cloud thickness reflects trend strength; a thicker cloud indicates a stronger trend, enhancing entry accuracy.
Range Trading in Consolidation Phases
During consolidation, the Ichimoku Cloud can define support and resistance levels, making range trading more effective.
Range Trading Steps:
- Identify Consolidation:
- A flat, thick cloud typically signals consolidation, presenting range-trading opportunities.
- Entry and Exit:
- Buy near lower cloud boundary; sell near upper boundary.
- Use cloud boundaries for setting stop-losses, minimizing risk in a range-bound market.
- Manage Positions During Ranges:
- Exit if no breakout occurs, avoiding overexposure in a non-trending market.
Momentum Trading: Capturing Quick Price Moves
Momentum trading focuses on rapid price changes, making it well-suited for breakout strategies with the Ichimoku Cloud.
Steps for Momentum Trading:
- Identify Breakouts:
- Look for Tenkan-sen/Kijun-sen cross near cloud boundary, signaling a potential breakout.
- Enter as price breaks above or below the cloud.
- Manage Position with Scaling:
- Scale position as price extends from the cloud.
- Use trailing stops to lock in profits, adjusting with Kijun-sen.
- Profit-Taking Strategy:
- Set targets at historical support/resistance; scale out as price reaches significant levels.
“Momentum trading with the Ichimoku Cloud captures rapid movements, allowing traders to capitalize on strong price shifts in either direction.”
Pro Tips for Advanced Traders
- Cloud Thickness Analysis: Thick clouds indicate robust trends; thin clouds suggest weaker trends. Watch for cloud thickness to anticipate potential reversals.
- Use of RSI for Momentum Confirmation: Pairing the Ichimoku Cloud with the RSI can confirm trend strength, especially in momentum trades.
- Timeframe Hierarchy for Entry Precision: Begin with a broader timeframe to confirm trend direction, then drill down to shorter frames for entry and exit accuracy.
- Risk Management Based on Cloud Width: Set larger stops in thick clouds, as this reflects volatility, adjusting position sizes for better risk control.
“These advanced tips refine your Ichimoku Cloud strategies, increasing both precision and confidence in your trades.”
Ichimoku Cloud Variations and Customizations
Alternative Parameter Settings
While traditional settings (9, 26, 52) are effective, shorter periods (e.g., 6, 13, 26) are popular for more volatile assets like cryptocurrencies. Adjust settings based on your market’s specific characteristics.
Custom Techniques Based on Market Type
Different markets may benefit from tailored settings. Forex traders may use the standard settings, while stock traders may prefer longer-term configurations to align with market trends.
Pros and Cons of Customization
Customizing the Ichimoku Cloud increases flexibility but can lead to reduced accuracy if too far from traditional settings. Balance customization with traditional values to maintain consistency.
Common Mistakes and How to Avoid Them
Misinterpreting Cloud Signals
A common mistake is relying too heavily on a single crossover, such as the Tenkan-sen/Kijun-sen cross, without considering other signals. The Ichimoku Cloud strategy is powerful because it combines multiple indicators. Using just one component can lead to inaccurate signals, so always verify trends with the cloud thickness, Chikou Span, and other components for comprehensive analysis.
Ignoring Timeframe Alignment
Ignoring multiple timeframes can lead to conflicting signals. Ensure that trends align across your chosen timeframes (e.g., daily, 4-hour, and 1-hour charts) to confirm a reliable setup. Misalignment can lead to unexpected price reversals, so it’s essential to confirm trend consistency across different periods.
Overtrading During Consolidation
Overtrading in sideways markets can lead to losses, as consolidating markets lack clear trends. A flat or thick cloud often indicates consolidation. It’s best to wait for a breakout signal or strong trend confirmation before entering trades, as trading within a consolidation can result in smaller, less reliable profits.
“Avoiding these pitfalls ensures a disciplined approach to the Ichimoku Cloud, helping traders make better-informed, more profitable decisions.”
Opofinance Services – A Top ASIC-Regulated Forex Broker for Ichimoku Cloud Traders
Opofinance stands out as a trusted, ASIC-regulated forex broker, known for its comprehensive services and dedication to helping traders succeed with advanced trading tools, including the Ichimoku Cloud. With a commitment to security, functionality, and accessibility, Opofinance offers a user-friendly platform that allows traders to fully customize and leverage the Ichimoku Cloud for detailed market analysis. This makes it an ideal choice for both new and experienced traders seeking reliable insights across various markets.
Advanced MT5 Platform Integration: Opofinance’s MetaTrader 5 (MT5) platform supports in-depth Ichimoku Cloud analysis, offering an array of features specifically optimized for this powerful tool. Traders can tailor their settings to suit specific market conditions, whether in forex, commodities, stocks, or cryptocurrencies. The MT5 platform allows real-time chart analysis, strategy testing, and access to robust historical data, helping traders refine their Ichimoku strategies with precision.
Social Trading and Educational Support: Understanding that learning from experts can be invaluable, Opofinance offers social trading services, where beginners and advanced traders alike can follow and replicate the strategies of seasoned professionals. This feature not only enables less experienced traders to learn directly from the best but also facilitates the sharing of Ichimoku Cloud techniques, enhancing the trading community’s collective knowledge and effectiveness.
Secure, Hassle-Free Transactions: Ensuring the safety and convenience of deposits and withdrawals, Opofinance has built its transaction processes with secure protocols and ease of access. This allows traders to focus on market opportunities without being hindered by financial concerns, providing peace of mind essential for disciplined trading.

As an official member of the MT5 broker network, Opofinance delivers an ideal combination of advanced tools, educational resources, and a secure trading environment. Whether you are new to the Ichimoku Cloud or a seasoned expert, Opofinance equips you with everything needed to make informed, strategic decisions and elevate your trading experience.
Conclusion
The Ichimoku Cloud is a comprehensive trading tool that provides traders with invaluable insights into trend, momentum, and support/resistance. Its unique design allows traders to understand what the Ichimoku Cloud tells you about market dynamics and provides a foundation for crafting powerful Ichimoku Cloud strategies. Through the use of advanced strategies, including multi-timeframe analysis, trend trading, and momentum trading, traders can maximize profitability while managing risk effectively. Whether you’re exploring how to trade the Ichimoku Cloud for the first time or enhancing your approach, this guide offers a complete, practical resource.
With disciplined practice and adherence to its comprehensive structure, the Ichimoku Cloud can help you make better-informed, profitable decisions in any financial market.
What does the Ichimoku Cloud tell you about market conditions?
The Ichimoku Cloud reveals trend direction, momentum, and potential future support and resistance, offering a quick, comprehensive view of market dynamics.
What is the Ichimoku Cloud strategy?
An Ichimoku Cloud strategy uses signals from all five components to identify trend direction and reversals, often confirming setups with multi-timeframe analysis for reliability.
How can you trade the Ichimoku Cloud effectively?
To trade the Ichimoku Cloud effectively, align timeframes, confirm multiple signals, and use cloud thickness to gauge trend strength. Pair with risk management strategies for optimized outcomes.


