

Struggling to pinpoint profitable entries and exits on your 4-hour trading charts? You’re not alone. Many traders seek that elusive edge, and the answer often lies in understanding and optimizing technical indicators. So, what are the best EMA settings for the 4-hour chart? While there’s no single magic number, this comprehensive guide will reveal how to leverage Exponential Moving Averages (EMAs) – specifically the 20-period EMA, 50-period EMA, and 200-period EMA – to identify trends, potential support and resistance, and ultimately, enhance your trading strategy. Whether you’re a seasoned trader or just starting with a forex trading broker, mastering these settings can significantly improve your medium-term trading success.

EMA & 4-Hour Chart: An Introduction
In the dynamic world of trading, staying ahead of the curve requires the right tools and knowledge. Technical indicators play a crucial role in this, helping traders analyze price movements and make informed decisions. Among these, the Exponential Moving Average (EMA) stands out as a powerful tool, particularly when applied to the 4-hour chart. Let’s delve into why EMAs are so valuable and why the 4-hour timeframe is a sweet spot for many traders.

Understanding EMA Fundamentals
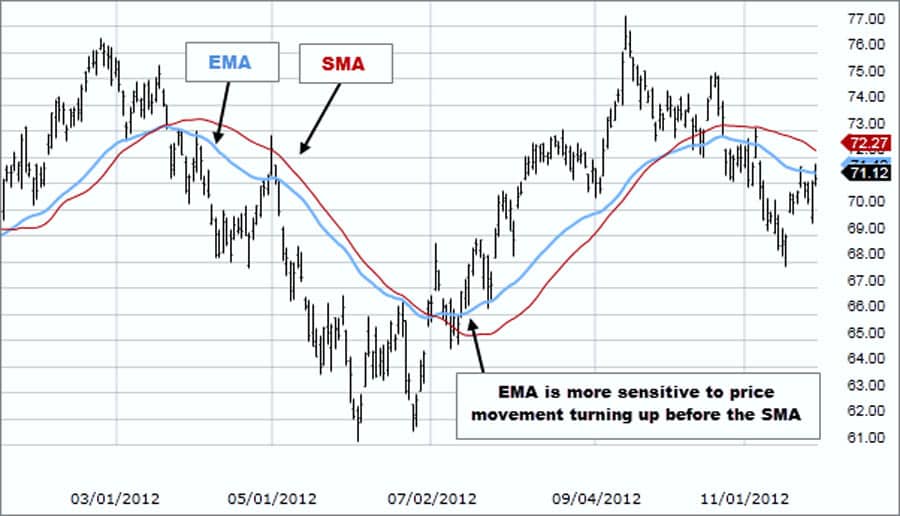
The Exponential Moving Average (EMA) is a type of moving average that gives more weight and significance to the most recent price data. This makes it more responsive to new information compared to the Simple Moving Average (SMA), which gives equal weight to all data points in the period. Imagine trying to navigate a busy street; you’d pay more attention to the cars right in front of you than those further down the road.
Similarly, the EMA prioritizes recent price action, providing a more timely reflection of current market sentiment. This responsiveness is a significant advantage, allowing traders to react faster to potential trend changes. This enhanced sensitivity allows for quicker identification of shifts in market momentum, potentially leading to earlier entry and exit points compared to using an SMA.
The 4-Hour Chart Advantage
The 4-hour chart occupies a strategic position between the shorter-term (e.g., 15-minute, 1-hour) and longer-term (daily, weekly) timeframes. This makes it an excellent choice for medium-term trading strategies. It filters out much of the noise and volatility present on shorter timeframes, providing a clearer picture of the underlying trend. At the same time, it offers more trading opportunities than longer-term charts, striking a balance that suits traders who aren’t day trading but also aren’t holding positions for months on end.
Think of it as the “Goldilocks” timeframe – not too short, not too long, but just right for capturing significant price swings without being overwhelmed by intraday fluctuations. This timeframe allows for a more considered approach to trading, reducing the impact of short-term market fluctuations while still providing ample opportunities for profit.
Read More: 4 hour forex trading strategy
Decoding Exponential Moving Averages
To effectively utilize EMA settings for the 4-hour chart, a solid understanding of what EMAs are and how they function is essential. Let’s break down the core concepts.
EMA: Definition and Calculation
The EMA is calculated using a formula that applies a weighting factor to the most recent price. While the exact calculation can seem complex, the key takeaway is that it emphasizes recent price data. This responsiveness is what differentiates it from the SMA. Essentially, the EMA reacts more quickly to new price movements, making it a valuable tool for identifying potential trend changes sooner. The formula involves a smoothing factor that determines the weight given to the latest price. This factor ensures that the EMA adapts more rapidly to current market conditions.
EMA vs. SMA: Key Differences
As mentioned earlier, the primary difference between EMA and SMA lies in the weighting of data points. The SMA calculates the average price over a specific period by giving equal weight to all prices within that period. In contrast, the EMA assigns more significance to recent prices. This results in the EMA being more sensitive to current price action, leading to faster signals. For instance, if there’s a sudden price surge, the EMA will react more quickly than the SMA, potentially providing an earlier indication of a trend change. This difference in responsiveness can be crucial for traders looking to capitalize on short-term price movements or identify trend reversals early.
Advantages of EMA in Trading
The responsiveness of the EMA offers several key advantages for traders. Firstly, it can help identify potential trend reversals earlier than the SMA. Secondly, it can act as dynamic support and resistance levels, with price often finding temporary support or resistance around the EMA line. Finally, EMA crossovers, where two EMAs with different periods cross, can provide valuable buy or sell signals. These advantages make the EMA a versatile and powerful tool in a trader’s arsenal. The ability of the EMA to act as dynamic support and resistance is particularly useful, as these levels adjust with price movements, providing traders with constantly updated potential entry and exit points.
The 4-Hour Chart’s Trading Significance
The 4-hour chart holds a unique position in the spectrum of trading timeframes. Understanding its significance can significantly impact your trading strategy and outcomes.
Capturing Medium-Term Trends
The 4-hour chart effectively filters out the intraday noise that can be prevalent on shorter timeframes. Each candlestick represents four hours of price action, providing a broader perspective on market movements. This makes it ideal for identifying and capitalizing on medium-term trends that can last for several days or even weeks. By focusing on this timeframe, traders can avoid being whipsawed by short-term volatility and gain a clearer understanding of the prevailing market direction. This clarity allows for more confident trading decisions, as the underlying trend is less obscured by short-term fluctuations.
Balancing Short and Long-Term Strategies
The 4-hour chart offers a sweet spot for traders who find shorter timeframes too hectic and longer timeframes too slow. It allows for more frequent trading opportunities compared to daily or weekly charts, while still providing a more reliable view of the trend than hourly or shorter charts. This balance makes it suitable for swing traders who aim to capture profits from price swings lasting a few days. It also allows for a more manageable trading schedule compared to day trading, making it a popular choice for individuals with other commitments. The 4-hour chart provides a good balance between the need for timely entry and exit points and the desire to avoid the constant monitoring required by shorter timeframes.
Read More: Moving Average Indicator in Forex
Optimal EMA Settings for 4-Hour Charts
Now, let’s get to the core of the matter: identifying the best EMA settings for the 4-hour chart. While personal preferences and trading styles play a role, certain EMA periods are widely recognized for their effectiveness.
Recommended EMA Periods
Three EMA periods stand out as particularly useful on the 4-hour chart:
The 20-Period EMA: Short-Term Trend Focus
The 20-period EMA is a popular choice for traders looking to identify short to medium-term trends. Its sensitivity allows it to react relatively quickly to price changes, making it useful for spotting potential entry and exit points within a prevailing trend. Think of it as a nimble indicator, quick to adapt to market shifts. When the price is consistently above the 20-period EMA, it suggests an upward trend, while price consistently below suggests a downward trend. This EMA is particularly effective in capturing the momentum of shorter-term price swings and can be a valuable tool for traders aiming to capitalize on these movements.
The 50-Period EMA: Medium-Term Trend Identification
The 50-period EMA provides a slightly longer-term perspective compared to the 20-period EMA. It’s often used to confirm the direction of medium-term trends and can act as dynamic support or resistance. When the price approaches the 50-period EMA during an uptrend, it can often find support and bounce back up. Conversely, during a downtrend, it can act as resistance, with the price struggling to break above it. This makes it a valuable tool for identifying potential areas to enter or exit trades. The 50-period EMA offers a more stable view of the trend, filtering out some of the shorter-term fluctuations that the 20-period EMA might reflect.
The 200-Period EMA: Long-Term Trend Gauge
The 200-period EMA is a widely followed indicator for gauging the overall long-term trend. It’s considered a significant level by many traders and investors. When the price is consistently above the 200-period EMA, it generally indicates a long-term bullish trend, while price consistently below suggests a long-term bearish trend. The 200-period EMA can also act as a strong support or resistance level, particularly on higher timeframes, and its influence can often be seen on the 4-hour chart as well.
Savvy traders often use the 200-period EMA as a filter, only taking long positions when the price is above it and short positions when the price is below it. This EMA provides a crucial context for trading decisions, ensuring that trades are aligned with the dominant long-term market direction.
Read More: Best macd settings for 4 hour chart
Leveraging EMA Crossover Strategies
One of the most popular ways to utilize EMAs is through crossover strategies. These strategies involve observing when two EMAs with different periods intersect, potentially signaling a change in trend.

Understanding EMA Crossovers
EMA crossovers are based on the principle that shorter-period EMAs react faster to price changes than longer-period EMAs. When a shorter-period EMA crosses above a longer-period EMA, it suggests that the recent price momentum is shifting upwards, potentially indicating the start of an uptrend. Conversely, when a shorter-period EMA crosses below a longer-period EMA, it suggests that recent price momentum is shifting downwards, potentially signaling the beginning of a downtrend. These crossovers provide visual cues on the chart, making it easier to identify potential shifts in market sentiment.
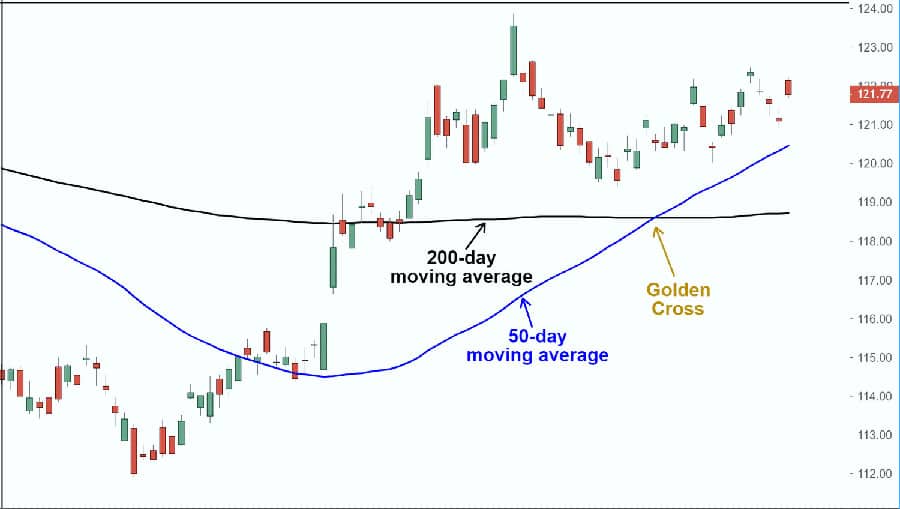
The Bullish Golden Cross
The Golden Cross is a bullish signal that occurs when a shorter-period EMA, such as the 20-period EMA, crosses above a longer-period EMA, such as the 50-period EMA or 200-period EMA. This crossover suggests that the short-term trend is gaining strength relative to the longer-term trend, potentially indicating the start of a significant upward move. Traders often look for confirmation from other indicators or price action before acting on a Golden Cross signal. The Golden Cross is a widely recognized and followed pattern, often attracting significant attention from market participants.
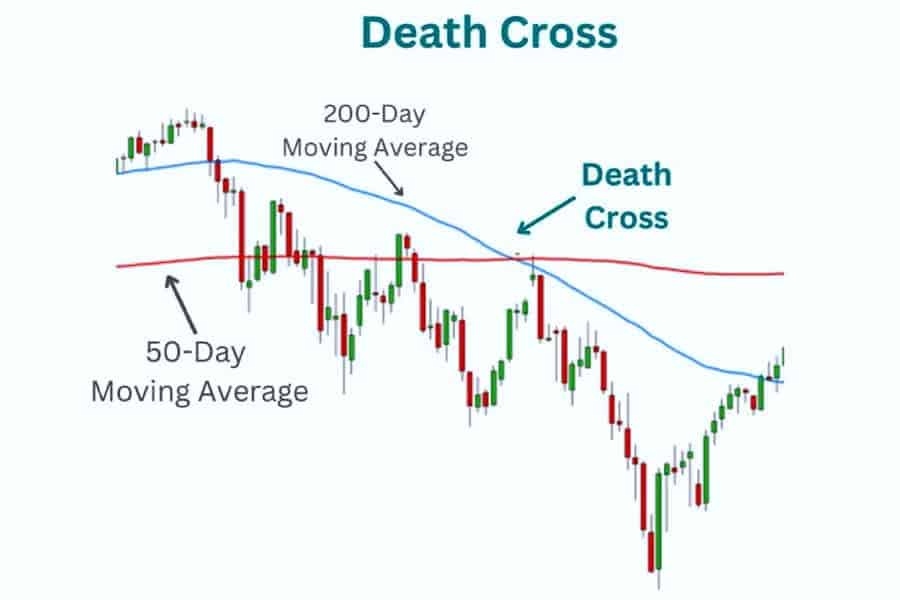
The Bearish Death Cross
The Death Cross is the bearish counterpart to the Golden Cross. It occurs when a shorter-period EMA crosses below a longer-period EMA. This crossover suggests that the short-term trend is weakening relative to the longer-term trend, potentially signaling the beginning of a significant downward move. Similar to the Golden Cross, traders often seek confirmation before entering trades based on a Death Cross signal. The Death Cross can be a powerful indicator of potential bearish momentum and is closely watched by traders looking for opportunities to profit from downward price movements.
Applying Crossovers on the 4-Hour Chart
On the 4-hour chart, EMA crossover strategies can be particularly effective for identifying medium-term trend changes. For example, a 20 and 50-period EMA crossover can provide timely entry points for swing trades. When the 20-period EMA crosses above the 50-period EMA, it can signal a potential buying opportunity. Conversely, when the 20-period EMA crosses below the 50-period EMA, it can signal a potential selling opportunity. Remember, it’s crucial to consider other factors and avoid relying solely on crossovers for trading decisions. While crossovers provide valuable signals, they should be used in conjunction with other forms of analysis to increase the probability of successful trades.
Combining EMA with Complementary Indicators
While EMAs are powerful on their own, their effectiveness can be further enhanced by combining them with other technical indicators. This multi-indicator approach can help filter out false signals and provide more robust trading confirmations.

Enhancing EMA Signals
Using multiple indicators that complement each other can significantly improve your trading accuracy. Let’s explore how the Relative Strength Index (RSI) and Moving Average Convergence Divergence (MACD) can work in synergy with EMA.
RSI for Overbought/Oversold Assessment
The Relative Strength Index (RSI) is a momentum oscillator that measures the speed and change of price movements. It ranges from 0 to 100. Readings above 70 typically indicate overbought conditions, suggesting a potential price pullback, while readings below 30 suggest oversold conditions, hinting at a possible price bounce. Combining RSI with EMA signals can help confirm potential reversals. For instance, if the price is above the 20-period EMA (suggesting an uptrend) and the RSI is also showing oversold conditions, it could present a high-probability buying opportunity. The RSI helps to identify potential turning points in the market, adding another layer of confirmation to EMA-based signals.
MACD for Momentum and Trend Strength
The Moving Average Convergence Divergence (MACD) is a trend-following momentum indicator that shows the relationship between two moving averages of a security’s price. It consists of the MACD line, the signal line, and a histogram. Crossovers of the MACD line above the signal line can indicate bullish momentum, while crossovers below can suggest bearish momentum.
Divergence between the MACD and price action can also provide valuable signals. Using the MACD in conjunction with EMA crossovers can provide stronger confirmation of trend changes. For example, if a Golden Cross occurs and the MACD is also showing bullish momentum, it strengthens the buy signal. The MACD provides insights into the strength and direction of a trend, complementing the information provided by EMA crossovers.
The Power of Multi-Indicator Confluence
Relying on a single indicator can sometimes lead to false signals. A multi-indicator approach, where you use several indicators that confirm each other, can significantly improve the reliability of your trading signals. By combining EMAs with indicators like RSI and MACD, you gain a more comprehensive view of market conditions, leading to more informed and potentially more profitable trading decisions. It’s about building confluence – having multiple indicators pointing in the same direction. This approach reduces the risk of acting on misleading signals and increases the probability of successful trades.
Backtesting and EMA Optimization
Before implementing any EMA settings in your live trading, it’s crucial to backtest them. Backtesting involves applying your chosen settings to historical data to see how they would have performed in the past. This process is vital for understanding the effectiveness of your strategy and optimizing your parameters.
The Importance of Backtesting
Different currency pairs exhibit different characteristics and volatility. What works well for one pair might not be optimal for another. Therefore, backtesting your chosen EMA settings on the specific currency pairs you intend to trade is essential. This allows you to fine-tune your parameters and identify the settings that have historically yielded the best results for those particular pairs. It’s about tailoring your strategy to the specific nuances of the assets you’re trading. Backtesting provides valuable insights into the historical performance of your strategy, allowing you to assess its potential profitability and identify areas for improvement.
Tools for EMA Period Optimization
Several tools and methods can be used for backtesting and optimizing EMA periods. Many trading platforms offer built-in backtesting capabilities, allowing you to easily test different EMA combinations on historical data. You can also use spreadsheet software or dedicated backtesting software for more in-depth analysis. The goal is to identify the EMA periods that provide the most accurate and timely signals for your chosen currency pairs and trading style. Experiment with different combinations and analyze the results to find your optimal settings. By systematically testing different EMA periods, you can identify the settings that have historically provided the most reliable signals for your specific trading style and the assets you trade.
Avoiding Common EMA Mistakes
While EMAs are powerful tools, they are not foolproof. Traders often make common mistakes that can diminish their effectiveness. Being aware of these pitfalls can help you avoid them and improve your trading outcomes.
Over-Reliance on EMA Signals
One of the biggest mistakes traders make is relying solely on EMA signals without considering the broader market structure. EMAs should be used in conjunction with an understanding of support and resistance levels, trendlines, and chart patterns. For example, a Golden Cross occurring within a strong resistance zone might be a less reliable signal than one occurring within a clear uptrend. Always consider the context of the market before acting on EMA signals. Understanding the overall market environment and identifying key support and resistance levels can help you filter out potentially false EMA signals.
Ignoring Higher Timeframe Context
Another common mistake is focusing solely on the 4-hour chart without considering the trends on higher timeframes, such as the daily or weekly charts. The trend on a higher timeframe often has a stronger influence on price action. For instance, if the daily chart shows a strong downtrend, taking long positions based on a 4-hour chart EMA crossover might be risky. Always look to higher timeframes for trend confirmation before making trading decisions on the 4-hour chart. This helps align your trades with the overall market direction. Analyzing higher timeframes provides a broader perspective on the prevailing trend, helping you to avoid trading against the dominant market direction.
Pro Tips for Advanced EMA Trading
For experienced traders looking to take their EMA strategies to the next level, consider these advanced techniques:
- Dynamic EMA Period Adjustments: Experiment with slightly adjusting your EMA periods based on market volatility. In periods of high volatility, slightly longer periods might filter out noise better.
- Multiple EMA Ribbons for Trend Clarity: Use a series of closely spaced EMAs (e.g., 8, 13, 21) to create a “ribbon” effect. This can provide a more visual representation of trend strength and potential reversal points.
- EMA Confluence with Fibonacci Retracements: Look for areas where EMA levels coincide with Fibonacci retracement or extension levels. This confluence can create stronger support or resistance zones.
Opofinance Services
- ASIC Regulated Broker: Trade with confidence knowing Opofinance is regulated by the Australian Securities and Investments Commission (ASIC), ensuring a secure and transparent trading environment.
- Officially Featured on MT5 Brokers List: Access the powerful MetaTrader 5 platform through Opofinance, a broker officially recognized on the MT5 brokers list.
- Safe and Convenient Deposits and Withdrawals: Enjoy peace of mind with a variety of secure and convenient methods for depositing and withdrawing funds.
- Explore Social Trading: Connect and learn from other traders with Opofinance’s social trading features, potentially gaining insights and strategies to enhance your own trading.

Ready to elevate your trading experience? Explore the benefits of trading with Opofinance today!
Conclusion
Mastering the best EMA settings for the 4-hour chart is a journey that requires understanding, experimentation, and consistent application. By focusing on the 20-period EMA, 50-period EMA, and 200-period EMA, and understanding how to use them in isolation and in combination with other indicators, you can significantly enhance your ability to identify trends and potential trading opportunities. Remember that backtesting and adapting your strategy to specific currency pairs are crucial for long-term success. Avoid common pitfalls like over-reliance on EMAs and ignoring higher timeframe trends. Embrace a holistic approach to technical analysis, and the EMA will become a powerful ally in your trading endeavors.
Key Takeaways
- The 20-period EMA is useful for capturing short to medium-term trends.
- The 50-period EMA helps identify medium-term trends and potential support/resistance.
- The 200-period EMA is crucial for recognizing long-term trend direction.
- EMA crossovers can provide timely entry and exit signals.
- Combining EMAs with RSI and MACD can enhance signal reliability.
- Backtesting your EMA settings is essential for optimization.
- Always consider market structure and higher timeframe trends.
What Are the Best EMA Settings for the 4-Hour Chart?
The most effective EMA settings for the 4-hour chart are the 20-period EMA for short-term trends, the 50-period EMA for medium-term trend identification, and the 200-period EMA for gauging long-term market direction. These settings help traders pinpoint entry and exit points while aligning with market momentum.
How Do EMA Crossovers Signal Trading Opportunities?
EMA crossovers occur when a shorter-period EMA (e.g., 20) crosses above or below a longer-period EMA (e.g., 50). A bullish crossover indicates potential upward momentum, while a bearish crossover signals downward momentum. These crossovers are valuable for identifying potential trend shifts.
Can EMAs Be Combined with Other Indicators for Better Results?
Yes, combining EMAs with complementary indicators like RSI (for momentum) and MACD (for trend strength) can enhance trading accuracy. This multi-indicator approach helps filter out false signals and provides a more comprehensive view of market conditions.


