

The quest for the best indicators for breakout strategy often leads traders down a complex path, but the answer is more about synergy than a single magic tool. While there is no standalone “best” indicator, a combination of volume, volatility, and momentum indicators offers the most reliable signals. Volume is paramount for confirmation, while tools like Bollinger Bands and the Relative Strength Index (RSI) are exceptional for timing and momentum. This guide delves into the top indicators, showing you how to combine them effectively, a crucial skill when trading with a leading regulated forex broker.

Key Takeaways
- No Single Best Indicator: The most effective approach is combining multiple indicators for confirmation. The best indicator for breakout strategy is actually a well-chosen toolkit.
- Volume is King: A breakout without a significant volume spike is often a false signal or “fakeout.” Volume provides the ultimate validation.
- Volatility Creates Opportunity: Indicators like Bollinger Bands and Keltner Channels help identify periods of consolidation that often precede powerful breakouts.
- Momentum Confirms Strength: The RSI and MACD help confirm that there is enough force behind a price move to sustain the breakout.
- Context is Crucial: The effectiveness of any breakout strategy depends on understanding market structure, primarily support and resistance levels.
- Risk Management is Non-Negotiable: Every breakout strategy must incorporate strict stop-loss and take-profit rules to protect capital.
Core Principles of Breakout Trading
Before diving into specific indicators, it’s essential to grasp the foundational principles that govern successful breakout trading. These concepts provide the context needed to interpret indicator signals correctly. Without understanding the ‘why’ behind a market move, even the best tools are rendered ineffective. From my experience, traders who master these fundamentals are far more consistent than those who solely hunt for indicator signals.

Understanding Support and Resistance
Support and resistance are the cornerstones of breakout trading. Support is a price level where a downtrend can be expected to pause due to a concentration of demand. Conversely, resistance is a price level where an uptrend is likely to pause due to a concentration of supply. A breakout occurs when the price decisively moves through one of these levels. Identifying these key zones on your chart is the first and most critical step in preparing for a breakout trade. These aren’t just lines on a chart; they represent the collective psychology of the market.
Importance of Volume in Confirming Breakouts
Volume is the fuel behind market moves. A price break above resistance or below support on low volume is suspicious and has a high probability of being a “fakeout”—a trap that lures in unsuspecting traders before the price reverses. A genuine breakout, however, is almost always accompanied by a significant surge in trading volume. This spike indicates strong conviction from institutional and retail traders, suggesting that the new price level is likely to hold. Ignoring volume is one of the most common and costly mistakes a breakout trader can make.
Role of Volatility in Breakout Setups
Volatility is a measure of how much the price of an asset fluctuates. In the context of breakouts, periods of low volatility are often the calm before the storm. When a market consolidates and trades within a tight range, energy is being built up. Indicators that measure volatility can alert you to these “squeezes,” signaling that a significant price expansion—a breakout—could be imminent. Learning to read the rhythm of market volatility is key to positioning yourself ahead of major moves.
Read More: Most Effective Forex Trading Indicators
Top Indicators for Breakout Strategy
Now that we’ve covered the core principles, let’s explore the technical tools of the trade. The following are, in my professional opinion, the most effective breakout strategy indicators when used thoughtfully and in combination. Each serves a unique purpose, from anticipating moves to confirming their strength. Finding the best indicator for breakout strategy for your personal style will involve experimenting with these powerful options.
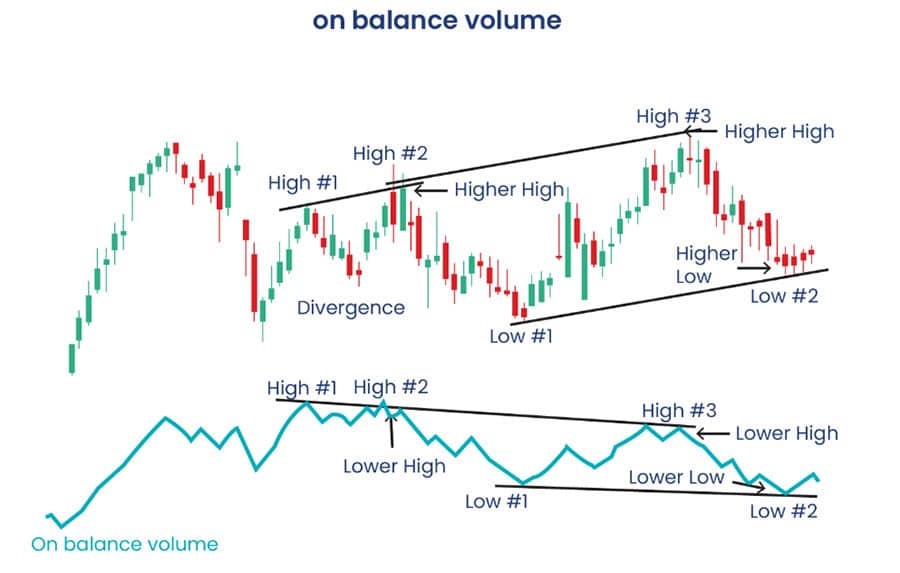
On-Balance Volume (OBV): Momentum Fuel
The On-Balance Volume (OBV) is a powerful momentum indicator that uses volume flow to predict price changes. It’s a running total of volume, adding volume on up days and subtracting it on down days. What makes OBV exceptional for breakouts is its ability to act as a leading indicator. Often, OBV will break its own trendline or a key level before the price does. This divergence can be a huge tell. If you see the price testing a resistance level while the OBV is already making new highs, it suggests that smart money is accumulating positions, and a price breakout is highly probable.
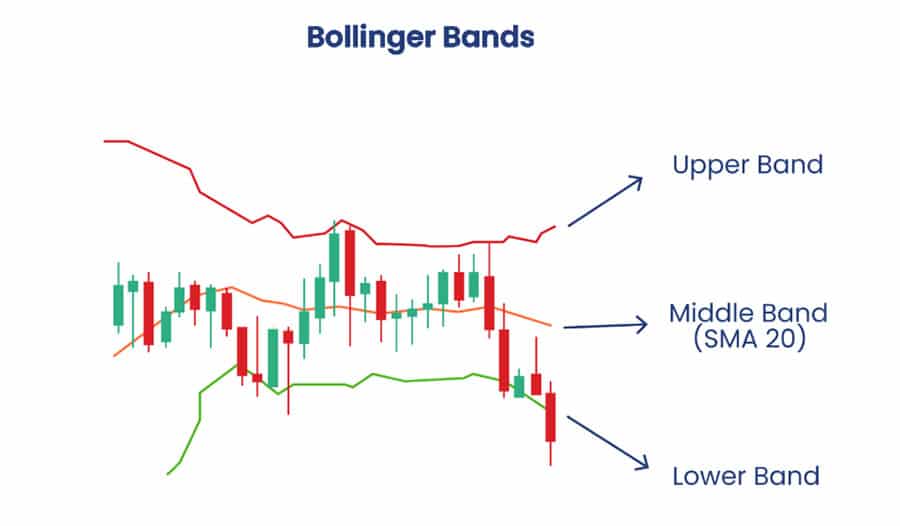
Bollinger Bands: Measuring Volatility
Created by John Bollinger, Bollinger Bands consist of a middle band (typically a 20-period Simple Moving Average) and two outer bands set at two standard deviations away. Their primary function in a breakout strategy is to identify periods of low volatility. When the bands narrow and move closer together, it’s known as a “squeeze.” This signals that the market is consolidating and building energy. The subsequent breakout often occurs with significant force. The entry signal is typically a strong candle closing outside of the bands, signaling the start of a new trend. This is a classic method for finding the best breakout trading indicators‘ setup.
Moving Averages: Trend and Confirmation
Moving averages are fundamental tools for identifying trend direction and dynamic support/resistance levels. A breakout is often confirmed when the price closes decisively above a key moving average.
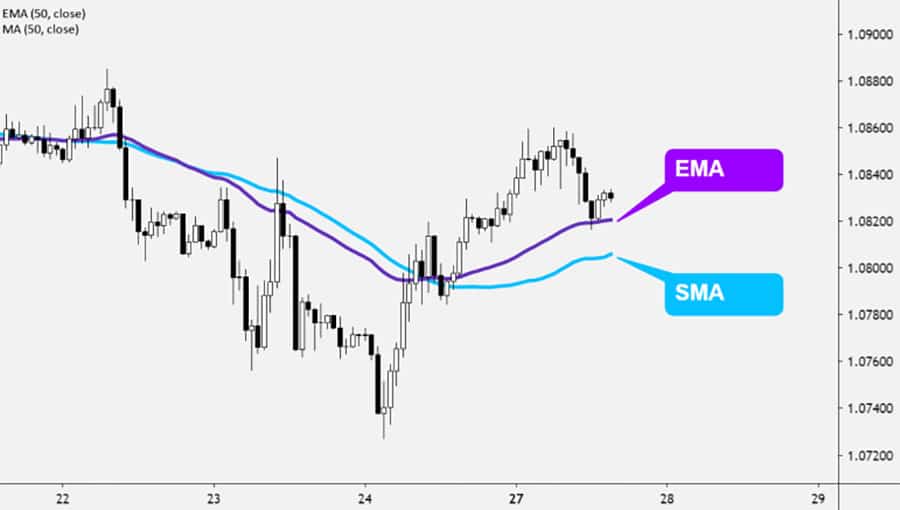
- Simple Moving Average (SMA) vs Exponential Moving Average (EMA): The SMA gives equal weight to all prices in its calculation, making it smoother. The EMA gives more weight to recent prices, making it more responsive to new information. For long-term trend breakouts, the 50-period and 200-period SMAs are industry standards. For shorter-term strategies, traders often use the 9-period and 21-period EMAs.
- The Golden Cross and Death Cross: A classic breakout signal is the “Golden Cross” (the 50 SMA crossing above the 200 SMA), indicating a new bull market. The opposite, a “Death Cross” (50 SMA crossing below the 200 SMA), signals a new bear market.
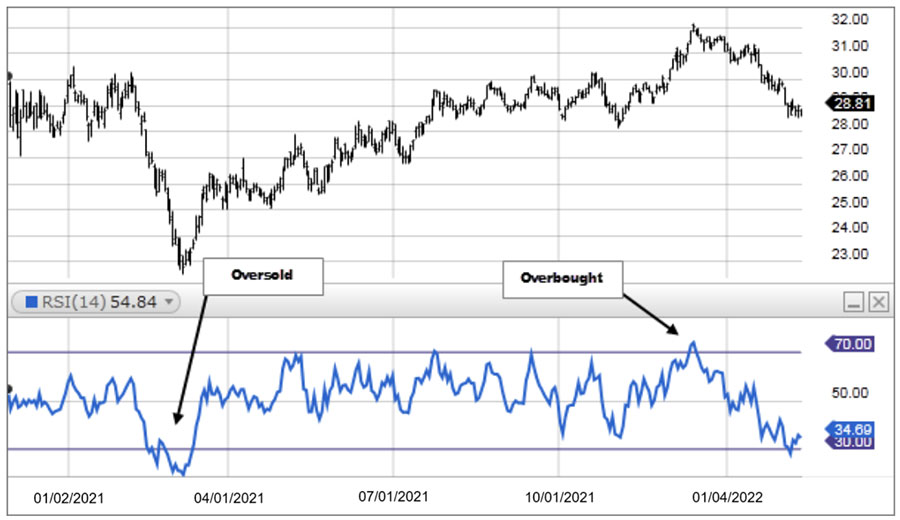
Relative Strength Index (RSI): Momentum Shift
The RSI is a momentum oscillator that measures the speed and change of price movements, oscillating between 0 and 100. While it’s commonly used to identify overbought (>70) and oversold (<30) conditions, it’s also excellent for confirming breakout strength. In a breakout strategy, we look for the RSI to cross above 50 during an upward breakout or below 50 during a downward breakout. This shows that momentum is shifting in favor of the move. Furthermore, an RSI reading moving out of the oversold zone and into bullish territory can add strong confirmation to a long breakout trade.
Volume Indicators: Validating Strength
Beyond OBV, a simple volume histogram on your chart is one of the most crucial breakout trading strategy indicators. As mentioned, volume confirmation is non-negotiable. When a price breaks a key level, you must look at the volume bars at the bottom of your chart. You’re looking for a conspicuous spike—a bar that is significantly taller than the preceding bars. This indicates a high level of participation and conviction. A breakout on anemic or average volume should be viewed with extreme skepticism. It is often the sign of a trap.
Additional Useful Indicators
While the indicators above form the core of a solid breakout toolkit, several others offer unique advantages:
- Donchian Channels: These channels simply plot the highest high and the lowest low over a set period (e.g., 20 days). A breakout is signaled when the price closes above the upper channel or below the lower channel. It’s a very straightforward and mechanical way to identify breakouts from a defined range.
- Keltner Channels: Similar to Bollinger Bands, Keltner Channels use Average True Range (ATR) to plot volatility-based bands around an EMA. They are often considered less prone to false signals than Bollinger Bands. A price closing firmly outside the channel is a strong breakout signal.
- MACD (Moving Average Convergence Divergence): The MACD can confirm a breakout through its histogram and signal line crossover. When a bullish breakout occurs, you want to see the MACD line crossing above its signal line and the histogram turning positive, indicating rising bullish momentum.
Raed More: Breakout Trading Strategy
Proven Breakout Trading Strategies
Knowing the indicators is one thing; applying them in a cohesive strategy is another. A strategy provides a clear set of rules for entry, exit, and risk management. Here are some proven strategies that effectively combine the indicators we’ve discussed. The key is to find a strategy that resonates with your trading style and risk tolerance. Finding the best indicator for breakout strategy often comes down to how well it fits into a structured plan like these.
Moving Average Breakout Strategy
This strategy uses a combination of short-term and long-term moving averages to identify entries. A common setup is using the 20-period EMA and the 50-period SMA.
- Entry Rule (Bullish): Wait for the price to consolidate above the 50 SMA. The entry is triggered when a candle closes decisively above the 20 EMA, with the 20 EMA also being above the 50 SMA. Volume should be increasing.
- Entry Rule (Bearish): Wait for the price to consolidate below the 50 SMA. The entry is triggered when a candle closes decisively below the 20 EMA, with the 20 EMA also being below the 50 SMA. Volume should be increasing.
- Exit Rule: A stop-loss can be placed below the 50 SMA for a long trade, or above it for a short trade. The take-profit could be a predetermined risk-reward ratio (e.g., 2:1) or the next major resistance/support level.
Bollinger Bands Breakout Strategy
This volatility-based strategy focuses on the “squeeze” to anticipate a powerful move. It’s one of the most popular applications and a strong contender for the best indicator for breakout strategy when volatility is the main focus.
- Setup: Identify a period where the Bollinger Bands are exceptionally narrow. This indicates low volatility and consolidation. The longer the squeeze, the more powerful the potential breakout.
- Entry Rule (Bullish): Enter a long position when a strong candle closes above the upper Bollinger Band.
- Entry Rule (Bearish): Enter a short position when a strong candle closes below the lower Bollinger Band.
- Confirmation: The breakout should be accompanied by a significant volume spike. The RSI should also cross above 50 (for bullish) or below 50 (for bearish) to confirm momentum.
- Exit Rule: The stop-loss is often placed near the middle band (the 20-period SMA).
Volume-Based Breakout Strategy
This strategy prioritizes volume as the primary signal, using price action for context. It is designed to catch only the most powerful, institutionally-backed moves.
- Setup: Identify a clear support or resistance level that has been tested multiple times.
- Entry Rule: Watch the volume histogram closely as the price approaches the key level. Enter a trade only when the price breaks the level on a volume bar that is at least two to three times the average volume of the last 20 bars. The candle itself should be strong and close far from the breakout level.
- Confirmation: Using OBV can add a layer of confidence. A rising OBV leading into a resistance break is a very strong signal.
- Exit Rule: Place the stop-loss just on the other side of the broken support/resistance level.
Channel Breakout Strategy
This approach involves drawing trendlines to create a price channel (either ascending, descending, or horizontal).
- Setup: Connect at least two swing highs and two swing lows to form a channel.
- Entry Rule: Enter a trade when the price closes decisively outside the channel’s trendline. For an ascending channel, a break below the lower trendline is a short signal. For a horizontal channel (a range), a break above is a long signal, and a break below is a short signal.
- Confirmation: As always, confirm with a volume spike. The Donchian Channel indicator automates this process by plotting the range for you.
Pennant and Flag Patterns
These are classic continuation patterns. A flag or pennant forms after a strong price move (the “pole”), representing a brief consolidation before the trend continues.
- Setup: Identify a sharp, high-volume move (the pole) followed by a period of low-volume consolidation that forms a small rectangle (flag) or triangle (pennant).
- Entry Rule: Draw trendlines around the flag or pennant. Enter a trade when the price breaks out of the pattern in the same direction as the initial pole.
- Confirmation: The breakout from the pattern should happen on a surge of volume. The best indicator for breakout strategy here is often the volume histogram itself.
Gap Breakout Strategy
Price gaps, especially in the stock market at the open, create immediate and powerful breakout opportunities. A gap is a space between the closing price of one period and the opening price of the next.
- Setup: Look for a significant price gap up or down at the market open.
- Entry Rule (Gap and Go): If a stock gaps up and continues to show strength in the first few minutes (e.g., breaks above the high of the first-minute candle), it’s a potential long entry. The opposite is true for a gap down.
- Confirmation: The volume on the opening minutes must be exceptionally high.
- Exit Rule: This is a fast-moving strategy. Stop-losses must be tight, often placed just below the low of the opening range.
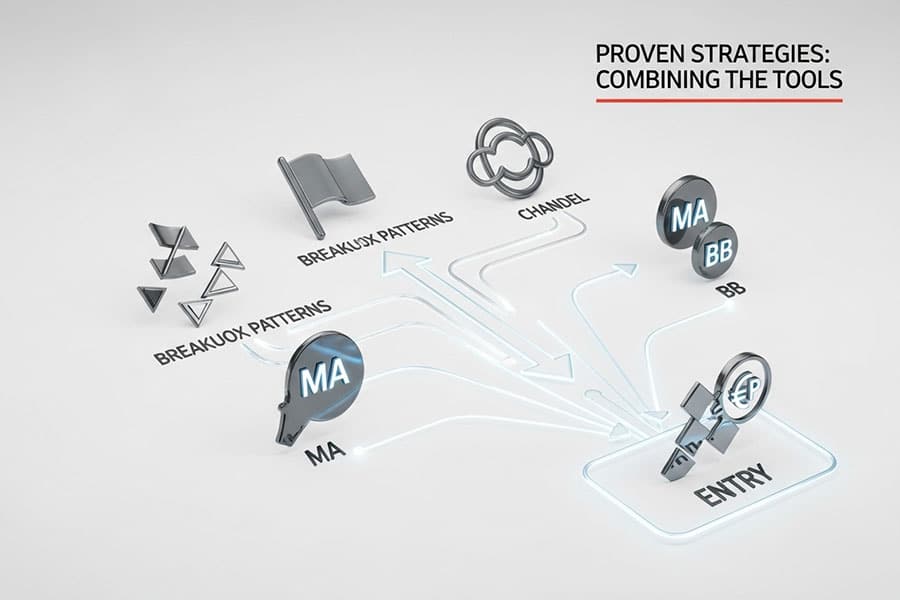
Combining Indicators for Higher Accuracy
The secret to a truly robust system lies not in finding the single best indicator for breakout strategy, but in creating a confluence of signals. Using multiple, non-correlated indicators helps filter out bad trades and increases the probability of success. Each indicator acts as a check on the others, ensuring that the volume, volatility, and momentum are all aligned before you risk your capital.
Why Using Multiple Indicators Improves Confirmation
Think of it as building a case for a trade. If the price breaks resistance, that’s one piece of evidence. If it does so after a Bollinger Band squeeze, that’s a second piece (volatility confirmation). If the breakout occurs on a massive volume spike, that’s a third, very strong piece of evidence. And if the RSI simultaneously crosses above 50, that’s your momentum confirmation. When all these elements align, the probability of a successful trade increases dramatically compared to trading off a single signal. This multi-layered approach is the hallmark of professional breakout trading strategy indicators usage.
Example Combination: OBV + Bollinger Bands + RSI
Here’s a practical example of a powerful combination for a bullish breakout:
- Setup (Bollinger Bands): First, we spot a Bollinger Band squeeze on the daily chart, indicating that volatility is low and a big move is likely coming. The price is consolidating near a key resistance level.
- Anticipation (OBV): We then look at the OBV. While the price is still below resistance, we notice the OBV has already broken its own trendline and is making higher highs. This suggests accumulation and anticipates the price breakout.
- Trigger (Price Action): The entry trigger is a strong daily candle closing decisively above the upper Bollinger Band and the key resistance level.
- Confirmation (RSI & Volume): At the time of the breakout, we check two final things. The volume histogram shows a significant spike, and the RSI has crossed above 50, confirming momentum is now bullish. With all these conditions met, the trade has a very high probability of success.
Avoiding False Breakouts with Filters
False breakouts, or “fakeouts,” are the bane of every breakout trader. The best way to avoid them is to use strict filters. Your primary filter should always be volume. Never trade a breakout without volume confirmation. Your secondary filter should be a momentum indicator like the RSI or MACD. If the price breaks out but momentum is weak or diverging negatively, it’s a red flag. A third filter can be the candle’s close. For a daily chart breakout, wait for the daily candle to close above the level. Don’t jump the gun mid-day, as the price can easily fall back below the level before the close.
Raed More: Opening Range Breakout Trading Strategy
Risk Management and Practical Tips
Even the best indicator for breakout strategy and the most confirmed setup can fail. Trading is a game of probabilities, not certainties. Therefore, disciplined risk management is not just a suggestion; it is the single most important factor that will determine your long-term survival and profitability as a trader. Ignore it at your peril.
Setting Stop Loss and Take Profit Levels
Your stop-loss is your predefined exit point if the trade goes against you. For a breakout trade, it should be placed logically.
- Stop Loss Placement: For a bullish breakout above resistance, a logical place for the stop-loss is just below the broken resistance level. This level should now ideally act as support. For a bearish breakout below support, place the stop-loss just above the broken support level, which should now act as resistance.
- Take Profit Placement: Take-profit levels can be set at the next major support or resistance level, or by using a fixed risk-to-reward ratio. For example, if your stop-loss is 50 pips away, you might set your first take-profit at 100 pips (a 2:1 ratio).
Managing Risk During High Volatility
Breakouts are, by nature, high-volatility events. This can be a double-edged sword. While it provides profit potential, it also increases risk. During these times, you might consider reducing your position size. If you normally risk 2% of your account on a trade, you might reduce it to 1% or 1.5% for a highly volatile breakout setup. This allows you to participate in the move while protecting your capital from unexpectedly sharp reversals.
Importance of Backtesting and Demo Trading
Before you risk real money on any strategy, you must validate it. Backtesting involves applying your strategy’s rules to historical price data to see how it would have performed. This helps you refine your rules and build confidence. After backtesting, the next step is demo trading. Practice your strategy in a live market environment with virtual money. This allows you to get a feel for the strategy’s dynamics and iron out any execution issues without financial risk. There is no substitute for this screen time.
Common Mistakes to Avoid
In my years of trading and mentoring, I’ve seen traders make the same costly mistakes over and over. Being aware of these common pitfalls is the first step to avoiding them. Even with the best indicator for breakout strategy, these errors can sabotage your results.
Ignoring Volume Confirmation
This is worth repeating because it is the single most common mistake. A trader gets excited by a price move, sees it cross a key level, and jumps in, only to see the price immediately reverse. They failed to look down at the volume histogram. A breakout without a volume surge is a trap. Always demand volume confirmation.
Trading Without Clear Support/Resistance
Another frequent error is trading breakouts from insignificant, “mid-air” levels. A breakout is only meaningful if it occurs from a well-defined and significant support or resistance level—one that has been tested multiple times and is visible on higher timeframes. Trading a breakout from a minor, choppy area is a low-probability endeavor.
Overtrading During Low Volatility
Patience is a virtue in trading. Some traders feel they need to be in a trade at all times. They try to force breakouts during periods of low volatility when the market is directionless and choppy. This leads to getting “chopped up” by small, meaningless moves, resulting in numerous small losses that quickly add up. If there’s no volatility and no clear setup, the best trade is often no trade at all.
Opofinance Services
To effectively implement these strategies, partnering with a reliable broker is essential. Opofinance, an ASIC-regulated broker, provides the tools and environment necessary for modern traders to succeed in finding and executing breakout opportunities.
- Advanced Trading Platforms: Gain an edge with a suite of platforms including the industry-standard MT4 and MT5, the sophisticated cTrader, and the user-friendly OpoTrade app.
- Innovative AI Tools: Leverage cutting-edge technology with the AI Market Analyzer, AI Coach for personalized feedback, and instant AI Support to enhance your trading decisions.
- Social & Prop Trading: Engage with a community of traders through social trading features or take on the challenge of proprietary trading to manage larger capital.
- Secure & Flexible Transactions: Experience hassle-free banking with safe and convenient deposit and withdrawal methods, including crypto payments, all with zero fees charged by Opofinance.
Explore a superior trading experience and unlock your potential with a trusted partner. Start trading with Opofinance today!
Conclusion
Ultimately, the best indicator for breakout strategy is not a single tool, but a carefully selected combination tailored to your trading style. The key is to build a confluence of evidence. By confirming a breakout with strong volume, measuring the pre-breakout volatility with Bollinger Bands, and validating the move’s strength with momentum indicators like the RSI or OBV, you dramatically increase your odds of success. Remember to combine this technical analysis with disciplined risk management and a deep understanding of market structure. This holistic approach is what separates consistently profitable traders from the crowd and is the true path to mastering the art of breakout trading.
How do you confirm a true breakout?
A true breakout is best confirmed by three factors: 1) A strong candle closing decisively beyond a significant support/resistance level. 2) A substantial spike in trading volume compared to recent averages. 3) Confirmation from a momentum indicator like the RSI crossing the 50 level.
Can you trade breakouts without indicators?
Yes, this is known as “price action trading.” Traders focus solely on chart patterns (like flags and triangles), candlestick analysis, and support/resistance levels. However, they almost always still use a volume histogram, as volume is considered a direct reflection of market action, not a derivative indicator.
What timeframe is best for breakout trading?
Breakouts occur on all timeframes, but higher timeframes (like 4-hour, daily, and weekly charts) generally produce more reliable signals with fewer false breakouts. The key support and resistance levels on these charts are respected by more market participants, leading to more significant moves when they break.
Is breakout trading profitable?
Yes, breakout trading can be highly profitable due to its potential to catch the beginning of major trends, leading to excellent risk-to-reward opportunities. However, its profitability depends entirely on a trader’s discipline, risk management, and ability to distinguish valid setups from false breakouts.
What is a “fakeout” in breakout trading?
A “fakeout” (or false breakout) occurs when the price momentarily moves past a support or resistance level, luring breakout traders into a position, only to quickly reverse direction. These are often characterized by a lack of volume on the initial break and are a primary reason why confirmation from multiple indicators is so crucial.


