

Let’s be honest. The search for the single best indicator for day trading can feel like an endless, frustrating rabbit hole. You’ve probably spent countless hours watching videos and reading articles, each proclaiming a different tool as the “holy grail.” It’s a journey that often leads to cluttered charts and crippling indecision. The truth, however, is both simpler and more empowering: no such magical tool exists. In my years of trading and mentoring, I’ve seen that the real secret isn’t finding one perfect indicator, but skillfully building a personalized toolbox of complementary indicators. This approach allows you to adapt, confirm your trading ideas with confidence, and see the market with greater clarity. Whether you’re navigating the forex market with a trusted online forex broker or trading volatile stocks, understanding how to combine these tools is the leap from being a struggling trader to a consistently profitable one. This guide will demystify the most effective indicators and show you, from experience, how to build your winning strategy.
Key Takeaways
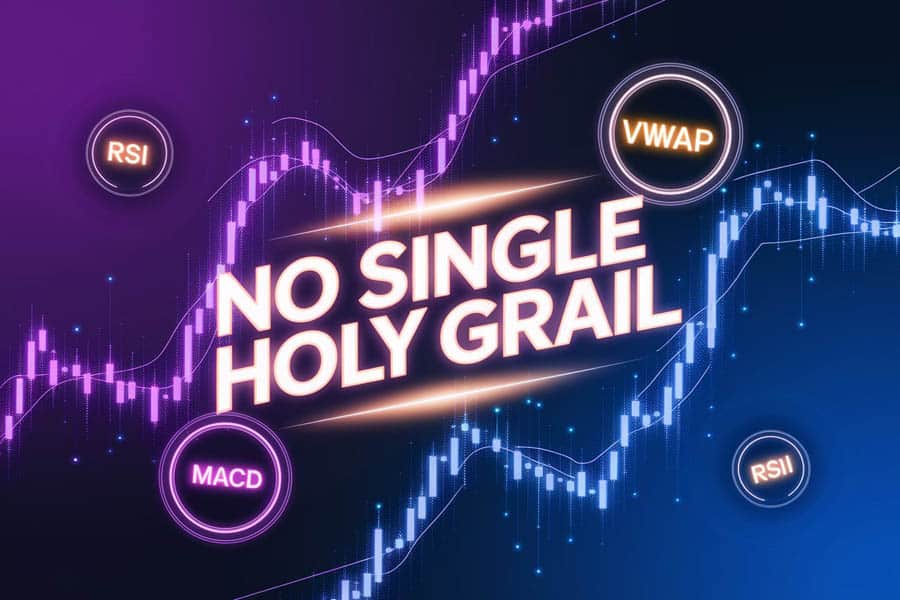
- There is No “Holy Grail”: True trading success comes from skillfully combining a few reliable indicators, not from a futile search for one “perfect” tool. The quest for a single best indicator for day trading is a trap; the goal is a robust system.
- Context is Everything: The usefulness of any indicator is entirely dependent on the market context. An indicator that shines in a trending market might give constant false signals in a sideways, choppy market.
- Confluence is Your Edge: The most reliable, high-probability trades happen at a point of confluence—where multiple, non-correlated indicators all point to the same conclusion.
- Indicators Are Confirmation Tools, Not Crystal Balls: Use indicators to build a hypothesis and confirm what price action is already telling you. They are reactive tools that should be used to support your decisions, not make them for you.
- Risk Management is Paramount: Indicators can help you find excellent entry and exit points, but they are rendered useless without an iron-clad risk management plan that includes stop-losses and appropriate position sizing on every single trade.
Core Indicators: Your Trading Foundation
Before you even think about complex strategies, you need to build a solid foundation. The following three indicators provide a panoramic view of the market’s momentum, trend, and the footprint of institutional money. Mastering them is a non-negotiable first step. In fact, many professional traders find that a synergistic combination of these three often creates the best indicator for day trading setups because it covers the most critical elements of price analysis.
RSI: A Top Indicator for Day Trading Momentum
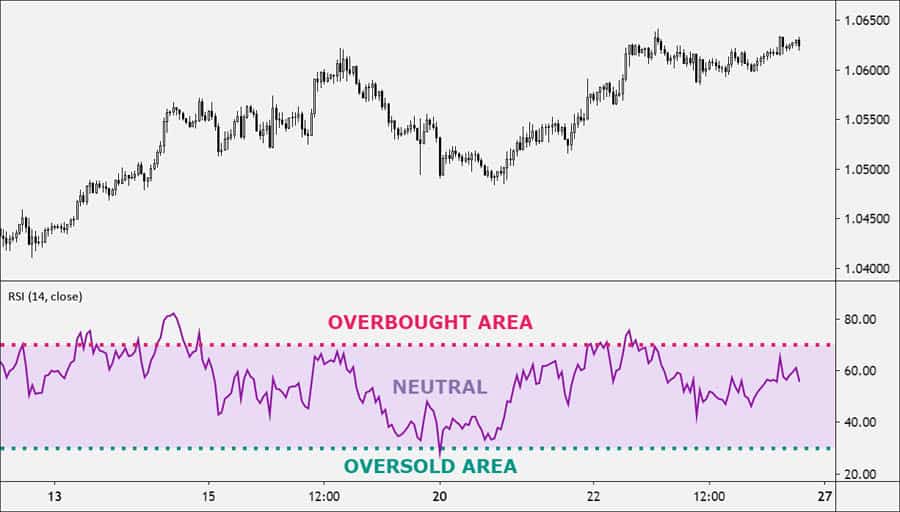
The Relative Strength Index (RSI) is a momentum oscillator. In simple terms, it measures how quickly and by how much price is changing. It oscillates between 0 and 100 and is a cornerstone for identifying overbought or oversold conditions. It’s a staple for a reason and a strong candidate for the most accurate indicator for day trading when it comes to purely gauging momentum.
How to Interpret RSI Values
The textbook definition says an asset is overbought above 70 and oversold below 30, suggesting a potential reversal. However, my experience has taught me that this is a dangerous oversimplification. In a powerfully trending market, the RSI can stay “overbought” for days while the price continues to scream higher. A trader who blindly sells at 70 will get steamrolled. The real art is in understanding divergence—this is where the RSI truly shines.
Practical Example: The Power of Divergence
Imagine a stock is in a clear uptrend. Price pushes up to a new high of $150. At this point, the RSI on your chart hits a peak of 80. The price then pulls back slightly before rallying again to a new, higher high of $155. You look down at your RSI, but this time, it only reaches 72. This is classic bearish divergence. Price made a higher high, but the momentum indicator made a lower high. It’s a massive red flag, telling you that the conviction behind this new high is weak. The upward thrust is running out of gas. This divergence is your signal to stop looking for buys and start looking for a confirmation to sell.
Pro-Tip: The 50-level on the RSI is your trend filter. When the RSI is consistently staying above 50, it confirms the market is in a bullish regime. Pullbacks that find support at or near the 50-level are often excellent continuation entry points. Conversely, if the RSI is struggling to get above 50, bulls are not in control. A clean cross of the 50-level can act as an early confirmation of a significant shift in market sentiment.
Common Mistake: The biggest error I see traders make with the RSI is acting on overbought/oversold signals in isolation. Don’t just sell because RSI is above 70. Ask yourself: Is there divergence? Is price action showing weakness (like a bearish engulfing candle)? Is this happening at a major resistance level? The RSI signal is a question, not an answer.
Read More: How to Become a Day Trader?
MACD: A Powerhouse for Trend and Momentum
The Moving Average Convergence Divergence (MACD) is a wonderfully versatile indicator that captures both trend direction and momentum. It consists of the MACD line, the signal line, and a histogram, which visualizes the distance between the two. The MACD is exceptional at helping you stay on the right side of the trend.
How to Identify High-Probability Signals
The most basic signal is the crossover. When the MACD line (the faster line) crosses above the signal line, it’s a bullish signal. When it crosses below, it’s bearish. But the real insight comes from where this crossover occurs. A bullish crossover that happens far below the zero line is much more significant than one that happens near the top of a rally. Furthermore, the histogram is your momentum gauge. When the histogram bars are getting taller, momentum is accelerating. When they start to shrink towards the zero line, momentum is decelerating, even if the price is still trending.
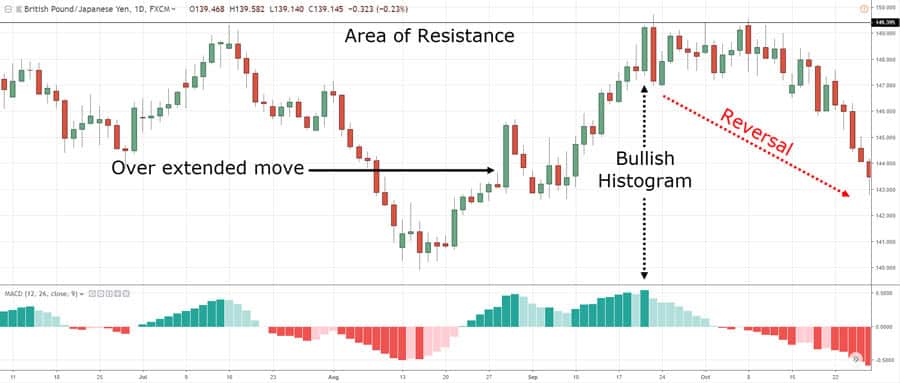
Practical Example: Gauging Trend Strength
Let’s say a currency pair has been in a strong uptrend. The MACD line is well above the signal line, and both are above the zero line. You see the histogram bars are tall and positive. Now, the price continues to grind higher, but you notice the histogram bars are getting shorter and shorter. This is your early warning. It tells you that the bullish momentum is fading. While the trend is still technically up, its engine is sputtering. This might be a signal to take partial profits or tighten your stop-loss, long before the MACD lines actually cross downwards.
Pro-Tip: Use MACD divergence just like you would with RSI. If the price is making a lower low in a downtrend, but the MACD is making a higher low (bullish divergence), it’s a powerful sign that the downtrend is losing its power and a bottom may be forming. Combining RSI divergence with MACD divergence at a key support level is an A+ reversal setup. This confluence is key to finding the most accurate indicator for day trading signals.
Common Mistake: Taking every single crossover as a valid signal, especially in a choppy market. The MACD is a trend-following indicator, which means it will get whipsawed and produce many false signals when the price is not moving in a clear direction. Always confirm the broader market context first. If the market is range-bound, the MACD is not the right tool for the job.
VWAP: The Best Indicator for Day Trading with “Big Money”
The Volume Weighted Average Price (VWAP) is an institutional benchmark. It’s the average price of a security for the day, weighted by volume. This is a critical distinction from a simple moving average. It gives more importance to price levels where significant trading occurred. For many professional desk traders, VWAP is the absolute top indicator for day trading because it shows them the day’s “fair value.”
Using VWAP as Your Intraday Compass
The logic is simple and powerful. Institutions and hedge funds often aim to buy assets below the VWAP and sell them above it to ensure they are getting a good price relative to the day’s volume. As retail traders, we can ride their coattails. If the price is trading above the VWAP, the intraday trend is considered bullish. If it’s below, it’s bearish. The VWAP line itself acts as a potent, dynamic level of support or resistance.
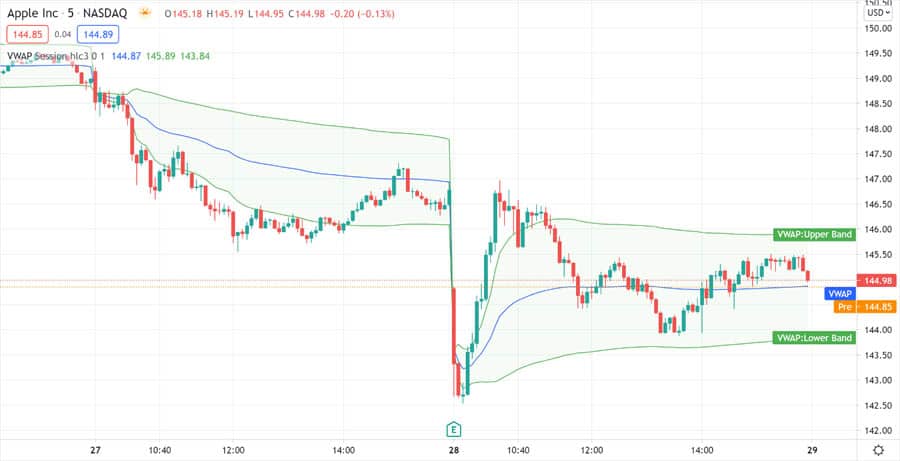
Practical Example: A Classic VWAP Reclaim
A stock gaps up at the market open and rallies, putting it well above the VWAP line. Around mid-morning, it starts to pull back towards the VWAP. Novice traders might panic and sell. A seasoned trader watches closely. The price touches the VWAP line, and you see a surge in volume as the price immediately bounces off it, forming a strong bullish candle (like a hammer). This is a textbook “VWAP reclaim.” It shows that institutional buyers were waiting at that fair value price to add to their positions. Entering a long trade on this bounce with a stop-loss just below the VWAP is a very high-probability setup.
Pro-Tip: For an advanced technique, add standard deviation bands to your VWAP. One or two standard deviation bands above and below the VWAP line can act as overbought/oversold levels for the session. In a ranging market, a move to the upper VWAP band can be a good spot to look for shorts, while a dip to the lower band can be a spot to look for longs, expecting a reversion back to the mean (the VWAP itself).
Common Mistake: Applying VWAP to anything other than an intraday chart. The VWAP calculation begins at the start of the trading day and ends at the close. It is not a continuous indicator like a moving average. Using VWAP on a daily, weekly, or monthly chart is completely meaningless and demonstrates a misunderstanding of what the tool represents.
Read More: Most Effective Forex Trading Indicators
Expanding Your Toolkit for Specific Scenarios
Once you’ve built your house on the solid foundation of RSI, MACD, and VWAP, you can start adding specialized tools to your workshop. The following indicators are designed to give you an edge in specific market conditions, from high-volatility breakouts to quiet, range-bound days. Choosing the right one is about diagnosing the market’s personality and finding the best indicator for day trading in that specific environment.
Bollinger Bands: The Volatility Visualizer
Bollinger Bands are a brilliant tool for understanding and profiting from market volatility. They consist of a middle band (a simple moving average) and two outer bands representing standard deviations. The space between the bands is a dynamic map of expected price movement.
Trading the Squeeze and the Walk
The bands expand when volatility is high and contract when it’s low. A period where the bands get extremely narrow is a “Bollinger Band Squeeze.” This indicates the market is coiling up and often precedes an explosive move. The breakout from this squeeze is a powerful entry signal. Conversely, in a very strong trend, the price will often “walk the band,” meaning it will continuously touch or ride along the upper or lower band. This is a sign of immense trend strength, not a signal to fade the move.
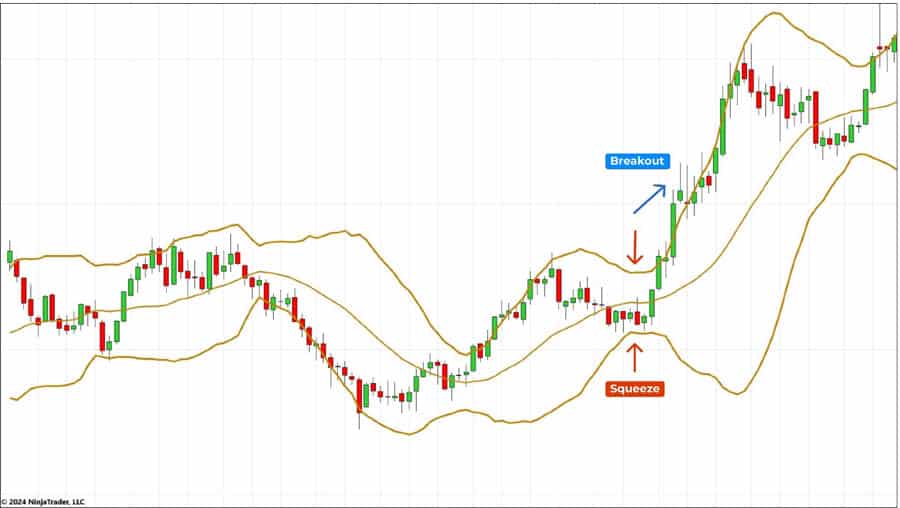
Practical Example: The Breakout Play
You see a forex pair has been trading in a tight range for hours. The Bollinger Bands are squeezed so tight they look almost like a single line. You set alerts above the upper band and below the lower band. Suddenly, a candle closes decisively above the upper band on a clear increase in volume. This is your trigger. You enter long, placing your stop-loss just below the middle band, targeting a move that is at least the width of the pre-squeeze range.
On-Balance Volume (OBV): Following the Money
On-Balance Volume (OBV) is a beautifully simple yet profound indicator. It’s a running cumulative total of volume, adding volume on days the price closes up and subtracting it on days the price closes down. Its core principle is that significant price moves are preceded by changes in volume. OBV helps you see what the “smart money” is doing before it’s obvious on the price chart.
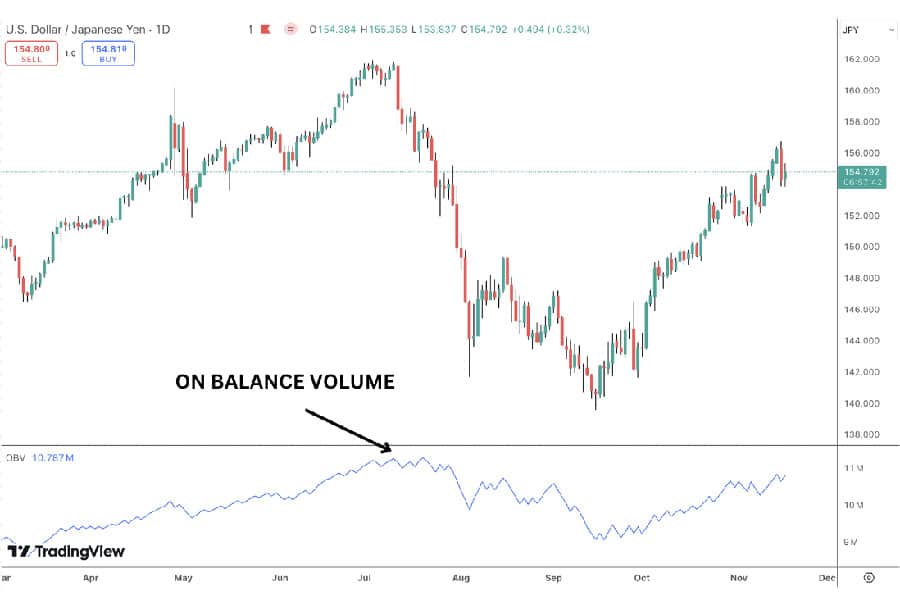
Confirming Trends and Spotting Divergence
The actual value of the OBV line doesn’t matter; its direction is everything. If the price is trending up and the OBV is also making higher highs, the trend is healthy and confirmed by volume. The real power comes from divergence. If the price is making new highs, but the OBV line is flat or making lower highs, it’s a huge warning sign that there is no real conviction behind the move. This makes OBV arguably the most accurate indicator for day trading based on volume flow.
Practical Example: Spotting a Weak Rally
A stock that was beaten down has started to rally. The price is climbing, and things look bullish. However, you glance at your OBV indicator and notice it’s barely ticking up; it’s essentially flat. This tells you that the rally is happening on very low volume. It’s likely a “trap” or a short-squeeze, not a genuine reversal backed by institutional buying. This insight from OBV would prevent you from getting caught on the wrong side when the weak rally inevitably fizzles out.
Fibonacci Retracement: The Market’s Hidden Geometry
The Fibonacci Retracement tool is based on the idea that financial markets move in predictable waves. After a strong directional move (an impulse), the market tends to pull back or “retrace” a certain percentage of that move before continuing in the original direction. These retracement levels act as invisible, yet widely respected, support and resistance zones.
Mapping Key Pullback Zones
The key levels every trader watches are 38.2%, 50%, and the “golden ratio” of 61.8%. To use it, you identify a clear swing low and swing high in an uptrend (or vice-versa in a downtrend) and draw the tool between these two points. The horizontal lines it projects onto your chart are potential areas where a pullback may pause or reverse.
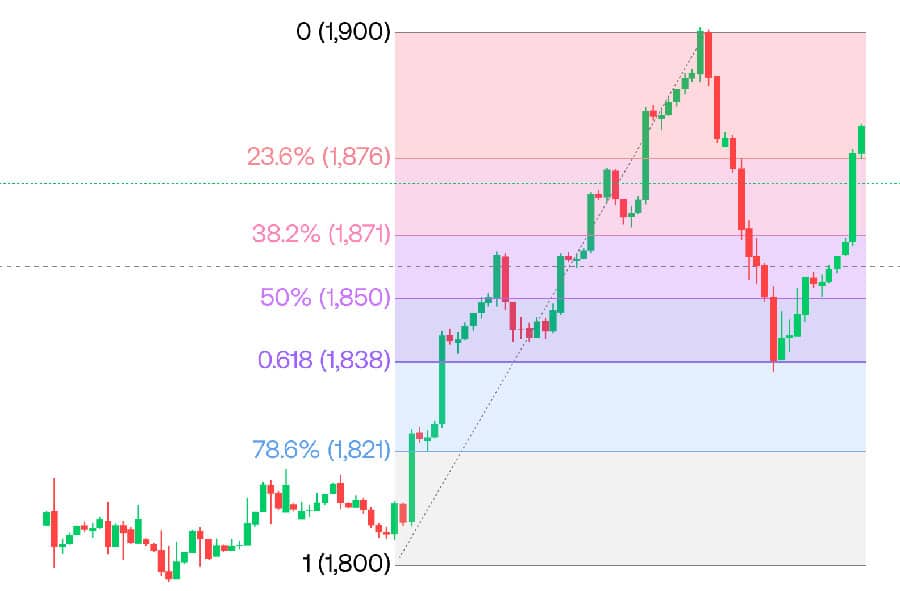
Practical Example: Buying the Dip Intelligently
A stock has a powerful rally from $200 to $220. It then begins to pull back. You apply the Fibonacci Retracement tool from the $200 low to the $220 high. You watch as the price slices through the 38.2% level but then stalls right at the $209 level, which is the 61.8% retracement. You see a bullish hammer candle form right on this Fibonacci level. This confluence of a key support level and a bullish price action signal gives you a high-confidence entry to join the next leg of the uptrend.
Stochastic Oscillator: The Range-Bound Specialist
The Stochastic Oscillator is another momentum indicator, similar to the RSI, but with a key difference. While RSI measures the velocity of price moves, the Stochastic measures the current price’s position relative to its high-low range over a set period. This makes it extremely sensitive and particularly effective in markets that are not trending, but instead chopping back and forth in a range.
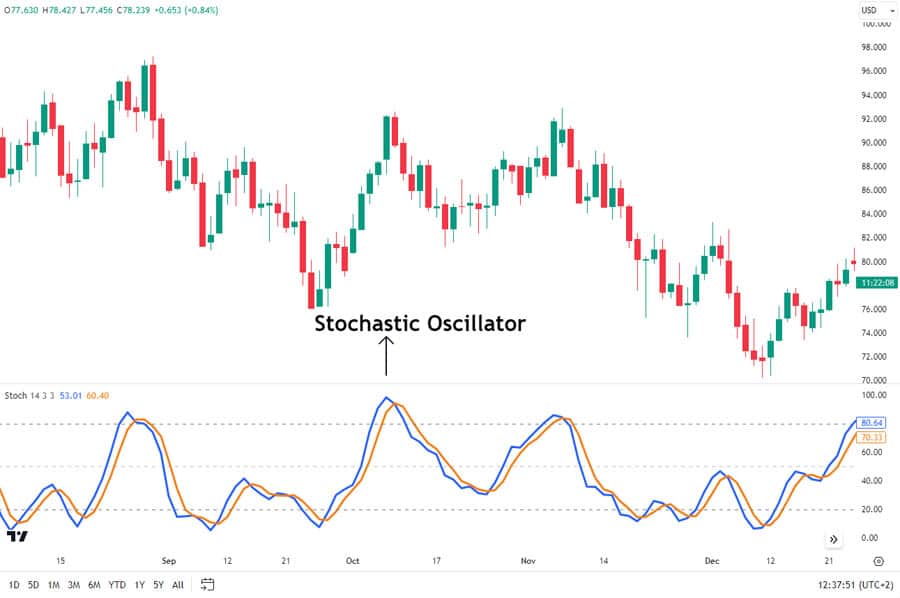
Identifying Quick Reversals
The indicator oscillates between 0 and 100, with readings above 80 considered overbought and below 20 considered oversold. In a market that is clearly stuck between a support and resistance level, a strategy of selling when the Stochastic reaches overbought conditions at resistance, and buying when it reaches oversold conditions at support, can be very effective. It often provides earlier signals than the RSI in these conditions, making it a top indicator for day trading ranging markets.
Practical Example: Sideways Market Profits
You’ve identified that an index is trading sideways between 4500 and 4550. The price drops and touches the 4500 support level. You look at your Stochastic Oscillator, and it has just dipped below the 20 line, indicating an oversold condition. You wait for the Stochastic lines to “hook” and cross back up above 20. This is your entry signal to go long, with a clear profit target near the 4550 resistance level.
Read More: Best Forex Indicators for Day Trading
The Synergy Secret: Building a High-Probability System
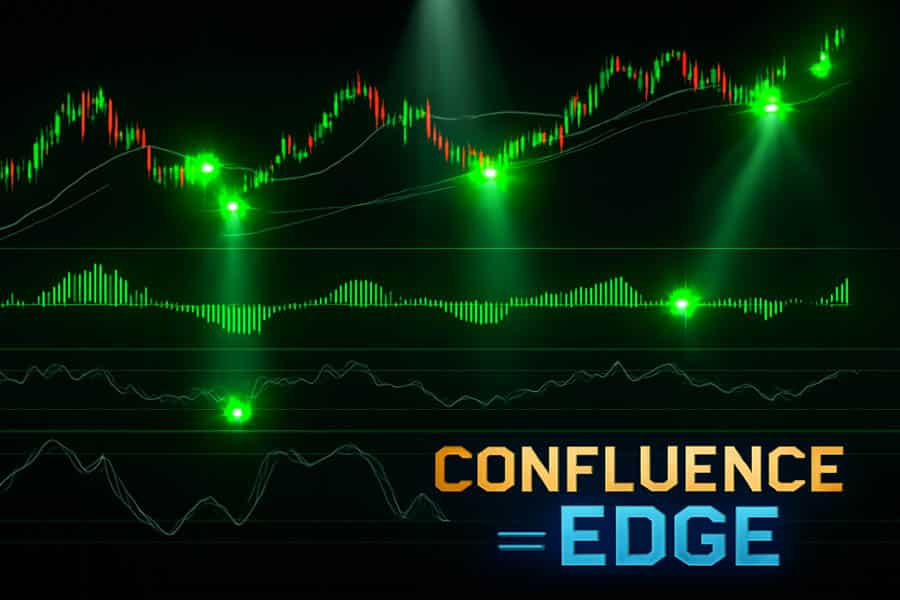
The moment your trading truly elevates is when you stop searching for a single best indicator for day trading and start thinking like a detective, looking for clues that corroborate a story. This is the power of confluence. A trade signal backed by two or three non-correlated indicators is exponentially more powerful than a signal from just one. The key is to combine different types of indicators (e.g., one for trend, one for momentum, one for volume) to get a complete picture of the market.
Example Strategy 1: The High-Momentum Trend Trade
This strategy is designed to enter an established trend with precision, combining a higher timeframe view with our core indicators.
- Step 1 (Context): Check a higher timeframe chart (e.g., the hourly chart) to confirm the overall trend direction. Let’s say it’s clearly bullish.
- Step 2 (Trend Confirmation): On your trading timeframe (e.g., the 5-minute chart), confirm the trend is up with the MACD. You want to see the MACD line above the signal line and both well above the zero line.
- Step 3 (Low-Risk Entry): Don’t chase the price! Wait patiently for the price to pull back to a key area of value. This is our VWAP line.
- Step 4 (Trigger & Confluence): The entry is triggered when the price touches the VWAP, holds, and you see a strong bullish candle form. For extra confirmation, you want to see the RSI holding above the 50-level during this pullback, confirming that bullish momentum is still intact. This confluence of higher timeframe trend, MACD direction, a VWAP bounce, and RSI support is an A+ setup.
Example Strategy 2: The Confirmed Reversal Trade
This is a more advanced strategy for catching the turn in a trend, but by requiring multiple points of confirmation, we can trade it with confidence.
- Step 1 (The Warning Sign): You spot clear bearish divergence on the RSI. The price has just made a new high, but the RSI has posted a lower high. This is your alert that the trend is exhausted.
- Step 2 (Momentum Confirmation): You look to the MACD. You see that while the price was making its new high, the MACD histogram was also showing divergence, making a lower high. Now you have two momentum indicators telling you the move is weak.
- Step 3 (Price Action Confirmation): This is the crucial step. The divergence itself is NOT an entry signal. You must wait for the market to prove you right. You wait for a clear break of the recent trend structure, such as the price closing below the most recent swing low.
- Step 4 (The Entry): The trade is entered only after the price has broken its structure. This confirmation from price action itself is the final piece of the puzzle, ensuring you aren’t trying to catch a falling knife (or short a rocket ship).
Beyond the Indicators: The Real Keys to Success
Even with the best indicator for day trading strategy in the world, you will ultimately fail without a bedrock of discipline and sound trading principles. The indicators are your analytical tools, but your psychology and risk management are what will determine your long-term profitability.
Risk Management is Your Business Plan
Indicators are great for finding an entry point, but they can’t protect your capital. That’s your job. Every single trade you take must have a pre-defined stop-loss. Your indicators can help you place it intelligently. For instance, if you enter a long trade on a bounce from the VWAP, a logical stop-loss would be placed just below that VWAP line. If the trade goes against you and hits that stop, it means your trade thesis was wrong. Accept it, take the small loss, and move on to the next opportunity.
The Danger of “Analysis Paralysis”
I’ve seen it a thousand times: a trader discovers indicators and proceeds to load up their chart with seven different oscillators, five moving averages, and four other tools until the price is completely obscured. This inevitably leads to conflicting signals and a total inability to make a decision. This is “analysis paralysis.” Your goal is clarity, not complexity. Two to three well-chosen, complementary indicators will serve you infinitely better than a dozen redundant ones.
The Unwavering Importance of Backtesting
Once you develop a strategy using your chosen set of indicators, you MUST test it. Backtesting is the process of applying your exact entry, exit, and risk management rules to historical price data to see how it would have performed. This crucial step validates your approach, gives you statistics on its potential win rate and drawdown, and, most importantly, builds the deep-seated confidence you need to execute your system flawlessly when real money is on the line, especially during a losing streak.
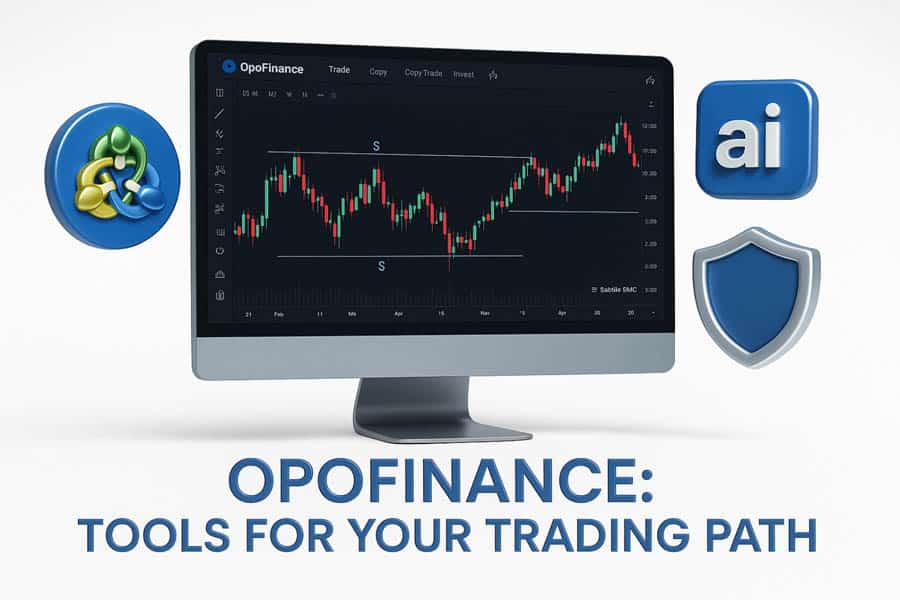
Opofinance Services
To effectively apply these advanced trading strategies, partnering with a reliable and technologically advanced broker is essential. Opofinance, an ASIC-regulated broker, offers a comprehensive trading ecosystem designed to empower traders at every level.
- Advanced Trading Platforms: Gain access to the industry’s most powerful platforms. Trade on the popular MT4 and MT5, the sophisticated cTrader, or Opofinance’s intuitive proprietary platform, OpoTrade.
- Innovative AI Tools: Leverage the power of artificial intelligence for a distinct market edge. Utilize the AI Market Analyzer for in-depth insights, the AI Coach to receive personalized feedback and refine your strategies, and AI Support for immediate assistance.
- Social & Prop Trading: Connect with a global community through Social Trading features, or test your skills and trade larger capital by participating in their Prop Trading program.
- Secure & Flexible Transactions: Enjoy fast, secure, and convenient deposits and withdrawals. Opofinance supports a wide range of methods, including cryptocurrency payments, and proudly states there are zero fees charged from their side on these transactions.
Explore the Opofinance Platform Today!
Conclusion: Crafting Your Path to Confident Trading
The long and often frustrating search for a single best indicator for day trading ends today. The real path forward is to embrace a new mindset: that of a craftsman. Instead of looking for a magic wand, you must learn to build a small, effective toolbox and master each tool within it. By building a foundation on RSI, MACD, and VWAP, and then learning to combine them with discipline, you create a robust framework for analysis. This approach, rooted in the principles of confluence, respect for price action, and, above all, unwavering risk management, is what will truly transform your trading. The top indicator for day trading will always be the system you have built, tested, and can execute with supreme confidence.


