

Let’s be honest. We’ve all been there. Staring at a chart that’s going nowhere fast. The price is drifting sideways, your trend-following strategies are getting shredded by small, meaningless moves, and the frustration is palpable. It feels like the market is mocking you. But what if I told you that these flat, “boring” markets hold some of the most reliable and profitable trading opportunities available? The secret isn’t to wait for a trend; it’s to adapt your toolkit. To thrive here, you need the best indicator for range trading.
While the idea of a single, magical indicator is tempting, my experience has shown that the real power lies in a specific combination of tools working in harmony. It’s about building a complete system. Accessing these tools through a top-tier online forex broker is your first practical step. This comprehensive guide will not just list indicators; it will reveal the ultimate trio for dominating a ranging market. We’ll explore how they work, why they work together, and how to build a rock-solid, actionable trading plan around them. By the end, you’ll see sideways markets not as a problem, but as a prime opportunity.
Key Takeaways
- Identify the Zone First: A ranging market is defined by clear horizontal support (floor) and resistance (ceiling) levels. Correctly identifying this “trading zone” is the foundational step before any indicator is even considered.
- The ‘Holy Trinity’ of Indicators: The most effective combination for consistent range trading is using the Relative Strength Index (RSI) for overbought/oversold entry signals, Bollinger Bands® for visualizing dynamic boundaries and volatility, and the Average Directional Index (ADX) to confirm the market is actually in a range.
- ADX is Your Gatekeeper: The ADX is arguably the best indicator for a ranging market because it filters your environment. A reading below 25 is a strong signal that there is no significant trend, giving you the green light to deploy your range-bound strategies.
- Build a Complete Trade Plan: A winning strategy involves more than just one signal. The process is: 1) Identify the range boundaries. 2) Confirm with ADX < 25. 3) Time your entry with RSI or Bollinger Bands near the boundaries. 4) Set a strict stop-loss just outside the range. 5) Define your profit target at the opposite boundary.
- Confluence Creates Confidence: The highest-probability trades occur when multiple indicators provide the same signal at the same time. This alignment is what separates professional traders from amateurs.
What is a Ranging Market? A Deep Dive
Before we can even talk about the best indicator for range trading, we need to be crystal clear on what we’re looking for. A ranging market, often called a “sideways” or “choppy” market, is a period where price action is contained between two parallel, horizontal levels. Imagine a basketball court: the floor is support, and the ceiling is resistance. The price is the ball, bouncing between these two boundaries.
Support is a price level where demand is strong enough to prevent the price from falling further. Buyers see value at this level and step in, pushing the price back up. Resistance is the opposite; it’s a price ceiling where supply is strong enough to stop the price from rising further. Sellers see the price as expensive and begin to offload their positions, causing the price to fall. A range forms when buyers and sellers are in a state of relative equilibrium—neither side has enough power to create a sustained directional move, or a trend.
The ‘Holy Trinity’: Your Best Indicators for a Ranging Market
From experience, I can tell you that one of the costliest mistakes a new trader can make is misidentifying the market environment. Applying a trend-following strategy (like buying a new high) in a ranging market will almost always lead to buying at the exact peak of the range, right before it reverses lower. Your strategy must match the market’s personality. Recognizing you’re in a range allows you to shift from a “buy high, sell higher” mindset to a “buy low, sell high” strategy, which is the essence of successful range trading.
Read More: Best forex strategy for ranging market
Over years of trading, you learn to filter out the noise and focus on what truly works. When it comes to sideways markets, I’ve found that a specific trio of indicators provides the most clarity and the most reliable signals. I call them the “Holy Trinity” of range trading because they work together to answer three critical questions: Is the market truly ranging? Where should I enter? And how strong is the signal? This combination is, without a doubt, the foundation for finding the best indicator for a ranging market.
The Oscillator King: Relative Strength Index (RSI)
The RSI is a cornerstone for many trading strategies, but it truly comes alive in a range. It’s a momentum oscillator that is indispensable for any serious range trader.
What It Is
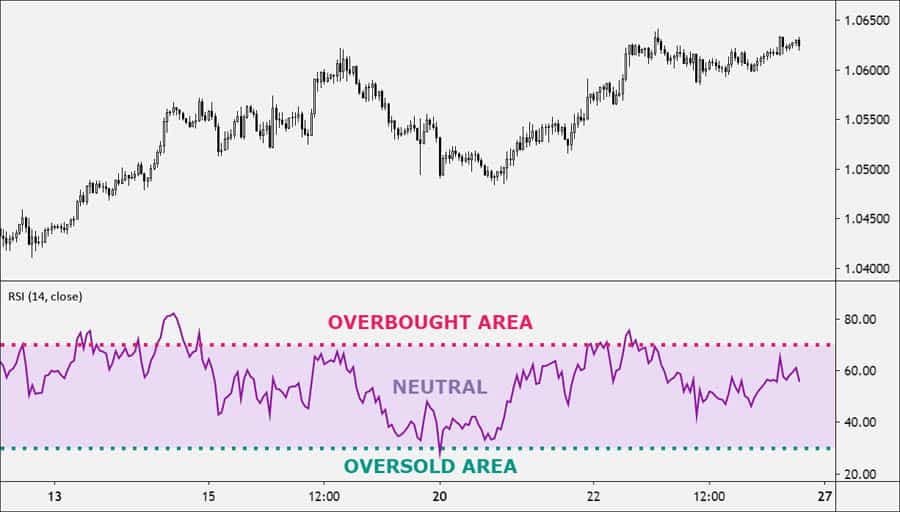
The RSI measures the speed and change of price movements on a scale of 0 to 100. It essentially compares the average gain on “up” days to the average loss on “down” days over a specific period, most commonly 14 periods. This calculation helps determine whether an asset is “overbought” (the price has moved too high, too fast, and is due for a pullback) or “oversold” (the price has moved too low, too fast, and is due for a bounce).
How It Works for Range Trading
The magic of the RSI in a range is its ability to pinpoint exhaustion points. The standard levels are 70 for overbought and 30 for oversold. Here’s the practical application:
- Identify the Range: First, you must have your support and resistance lines drawn.
- Wait for Price to Hit a Boundary: Let the price travel to the edge of the range. Don’t act while it’s in the middle.
- Look for the RSI Signal: As the price nears the resistance level (the ceiling), watch the RSI. When the RSI crosses above 70, it signals an overbought condition. This tells you that buying momentum is exhausted, which is a powerful confirmation to look for a short (sell) trade. Conversely, as the price approaches the support level (the floor), an RSI reading below 30 signals an oversold condition, suggesting selling momentum is fading and it’s time to look for a long (buy) trade.
Advanced Tip: RSI Divergence
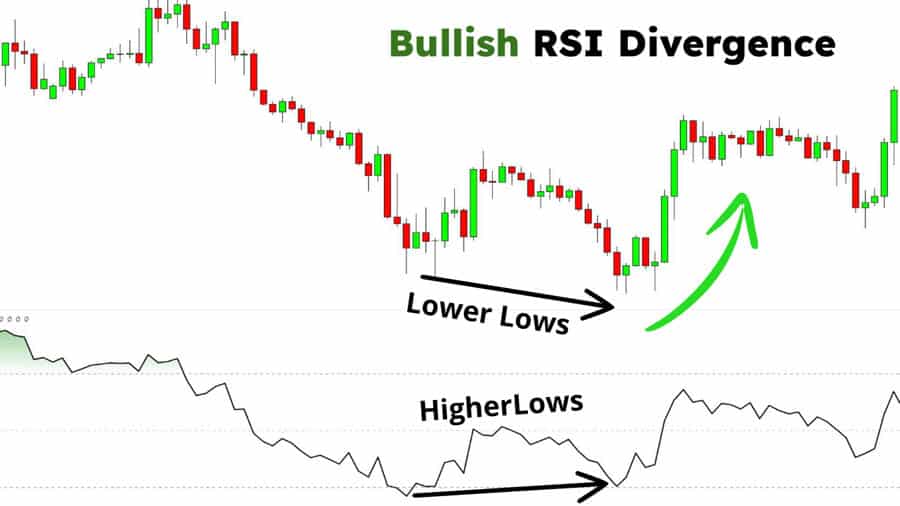
For an even more powerful signal, look for RSI divergence. This occurs when the price and the RSI are telling you different stories. For example, if the price makes a new low near the support boundary, but the RSI makes a higher low, this is called bullish divergence. It’s a very strong hint that the downward momentum is fading and a reversal is highly likely. This is a pro-level technique that dramatically increases the quality of your entry signals.
The Volatility Gauge: Bollinger Bands
Next up are Bollinger Bands®, a brilliant indicator that not only helps identify entry points but also provides crucial information about market volatility.
What It Is
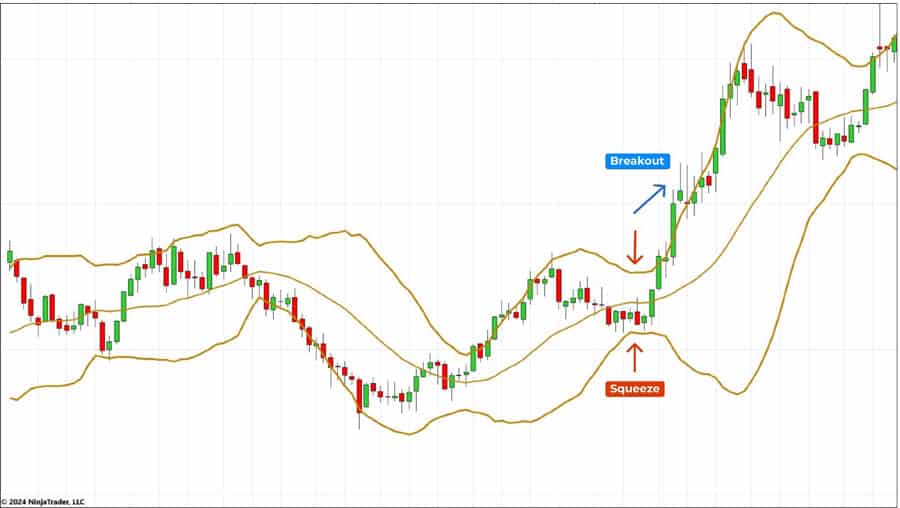
Bollinger Bands are composed of three lines plotted on the price chart. The middle line is a 20-period Simple Moving Average (SMA). The upper and lower bands are typically set at two standard deviations away from the middle band. Standard deviation is just a statistical measure of how spread out the prices are. In simple terms, the bands widen when the market is volatile and contract (or “squeeze”) when the market is quiet.
How It Works for Range Trading
In a sideways market, the price tends to be contained within the Bollinger Bands. The outer bands act as dynamic, floating levels of support and resistance.
- Entry Signals: A touch of the upper band suggests the price is relatively expensive, presenting a potential sell opportunity. A touch of the lower band suggests the price is relatively cheap, offering a potential buy opportunity. The signal is strongest when the price “tags” an outer band that also aligns with your pre-drawn horizontal support or resistance level.
- Volatility Clues: The width of the bands is a critical piece of information. When the bands are wide and running parallel, it confirms a stable range. When they begin to narrow and “squeeze” together, it’s a major warning sign. This “Bollinger Band Squeeze” indicates that volatility is extremely low and the market is coiling up for a potentially powerful breakout. This is your cue to become cautious with range trades and prepare for a new trend. The best indicator for range trading also tells you when to stop.
The Trend Confirmer: Average Directional Index (ADX)
The ADX is the final, and perhaps most critical, piece of our trinity. Its sole job is to answer one question: “Is there a trend?” For a range trader, the answer we want to hear is a resounding “No.”
What It Is
The ADX is a single line that measures the strength of a trend, not its direction. It’s calculated from two other lines, the Positive Directional Indicator (+DI) and the Negative Directional Indicator (-DI), but you only need to focus on the main ADX line. The ADX reading ranges from 0 to 100.
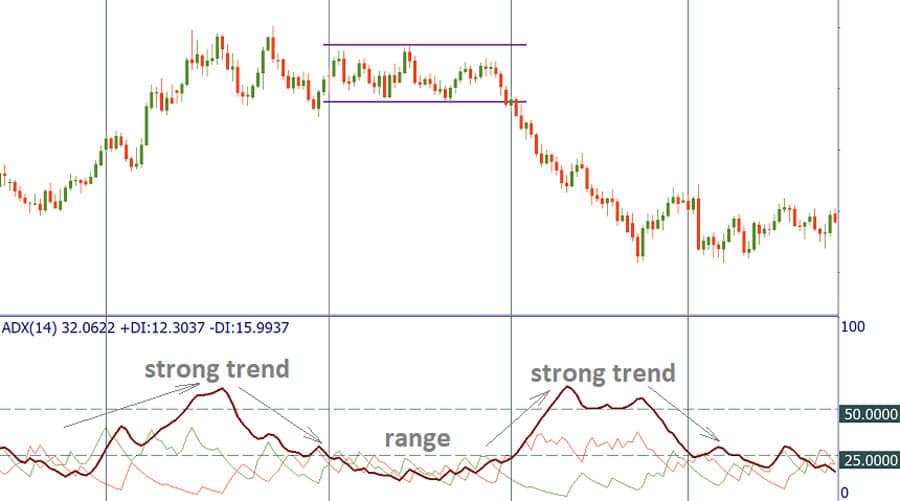
How It Works for Range Trading
This is where the ADX becomes the range trader’s best friend. It acts as a filter, preventing you from trying to trade bounces in a market that is secretly building momentum for a trend.
- The Golden Rule: ADX Below 25. When the ADX indicator is reading below 25, it is a strong confirmation that the market is in a non-trending, range-bound state. This is your green light. Seeing a low ADX reading should give you the confidence to execute your range trading setups.
- The Warning Sign: ADX Rising. If you are in a range trade and you see the ADX line start to hook upwards and cross above the 25 level, it’s a serious warning. This indicates that directional strength is building, and the range you are trading may be about to break. This is often a good time to tighten your stop-loss or consider taking profits.
Many experienced traders feel the ADX is the single best indicator for range trading precisely because it defines the environment so clearly. It stops you from fighting the market.
Read More: Range Scalping Strategy
Honorable Mentions for Range Trading Indicators
While the “Holy Trinity” provides a robust framework, other powerful range trading indicators can supplement your analysis and offer extra confirmation.
- Stochastic Oscillator: Very similar to the RSI, the Stochastic Oscillator is a momentum indicator that excels at identifying overbought and oversold conditions. It uses a scale of 0-100, with readings above 80 considered overbought and below 20 considered oversold. It is often more sensitive than the RSI, providing earlier signals, which can be beneficial but may also lead to more false positives. It’s excellent for traders who want quicker confirmation.
- Donchian Channels: This is a beautifully simple indicator. It plots the highest high and the lowest low over a set period (e.g., the last 20 candles). This creates a very clear channel that visually defines the range’s upper and lower boundaries. For traders who prefer a clean, price-action-based view, Donchian Channels are a fantastic tool for visualizing the playing field without complex calculations.
- Pivot Points: Pivot Points use the previous day’s high, low, and close prices to calculate a series of potential support and resistance levels for the current trading day. In a ranging market, you will often see the price bounce precisely between these calculated levels (e.g., between R1 and S1). They are predictive, not lagging, which makes them great for setting concrete profit targets and stop-loss levels in advance.
Your Step-by-Step Range Trading Strategy
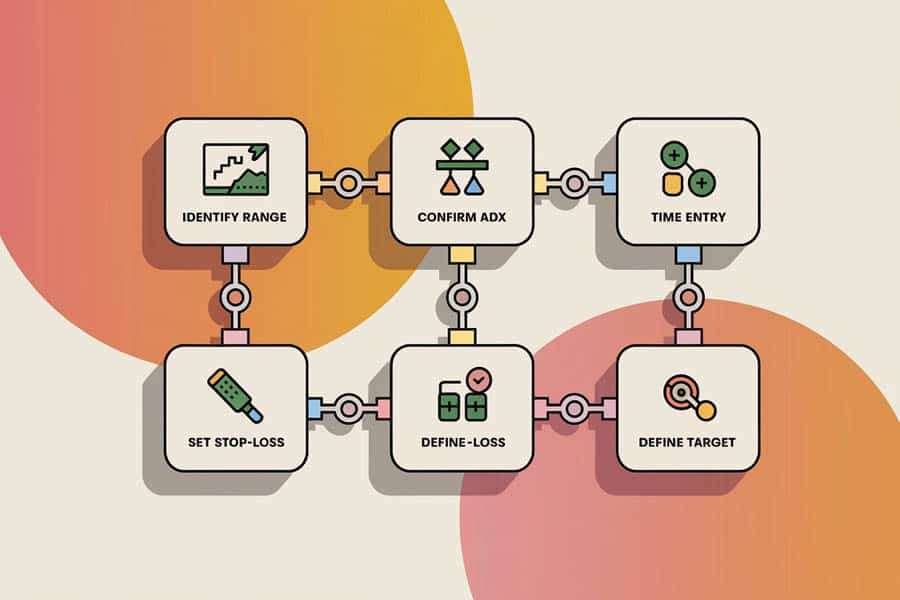
Knowledge is useless without application. Let’s assemble these tools into a complete, actionable range bound trading strategy. This is a practical blueprint that turns chart analysis into a structured trading plan.
Step 1: Identify a Valid Range
This is a manual, visual step, but it’s the most important. Open your chart (an H1 or H4 timeframe is often ideal) and look for price action bouncing between two horizontal points. A valid range should have at least two clear touches of resistance and two clear touches of support. The more touches, the more established and reliable the range is. Draw your horizontal support and resistance lines. This is your trading zone.
Step 2: Confirm with the ADX Filter
Now, apply your filter. Look at the ADX indicator. Is the reading below 25? Great, you have confirmation that you are in a weak-trending environment suitable for range trading. If the ADX is above 25 or rising sharply, close the chart and look for another opportunity. Do not try to force a range trade in a trending market.
Step 3: Time Your Entry with Precision
With the range identified and confirmed, it’s time to patiently wait for your entry. The highest-probability entries are at the edges, not the middle. Let’s create a protocol for a long (buy) trade:
- Wait for the price to fall and enter your pre-drawn support zone.
- Look for confirmation from your oscillator. Does the RSI dip below 30, or does the Stochastic dip below 20? This signals oversold momentum.
- For extra confirmation, look for a bullish reversal candlestick pattern, such as a hammer, a bullish engulfing pattern, or a pin bar. This shows that buyers are actively stepping in at that level.
The confluence of these three events—price at support, an oversold oscillator, and a reversal candle—is an A+ trading setup. The same logic applies in reverse for a short (sell) trade at resistance.
Step 4: Set Your Protective Stop-Loss
Every single trade needs a stop-loss. This is your get-out-of-jail-free card if the market proves you wrong. For a long trade at support, your stop-loss should be placed just below the support level. For a short trade at resistance, it goes just above the resistance level. An advanced technique is to use the Average True Range (ATR) indicator to determine the distance. For example, placing your stop-loss 1x the ATR value below the support line helps you avoid getting stopped out by random market noise.
Step 5: Define Your Profit Target
Range trading offers one major advantage: your profit targets are usually very clear. If you entered a long trade at support, your primary profit target is the resistance level at the top of the range. If you entered a short trade at resistance, your target is the support level at the bottom. A more conservative approach is to take partial profit at the midline of the range (often the 20-period moving average from the Bollinger Bands) and move your stop-loss to break-even, letting the rest of the position run towards the opposite boundary.
Read More: Range Trading
Pro-Tips for Advanced Range Traders
Once you’ve mastered the basics, you can incorporate more advanced concepts to refine your edge and truly master trading sideways markets.
The Unbeatable Power of Confluence
I can’t stress this enough. Confluence is the secret sauce. A single indicator signal is just a suggestion. A confluence of signals is a compelling argument. A high-quality trade setup isn’t just an oversold RSI signal. It’s an oversold RSI signal that occurs right at a major support level, which also happens to be the lower Bollinger Band, while the ADX is sitting quietly below 25. When you learn to wait for these “perfect storms,” your confidence and your win rate will increase dramatically.
Listen to What Volume is Telling You
Volume provides a window into the conviction behind price moves. In a strong, valid range, you’ll often see volume diminish as the price approaches a boundary. This suggests that the move is running out of steam and a reversal is likely. Conversely, if you see price approaching resistance on a sudden, massive spike in volume, be extremely cautious. This could be a “breakout volume” signature, signaling that the range is about to fail.
Trading the Deceptive False Breakout
Ranges must eventually end, and they often do so with a “false breakout” or “fakeout.” This is when the price pushes past a support or resistance level, tricking breakout traders into jumping in, only to quickly reverse and get sucked back into the range, trapping them. While frustrating for some, this is a powerful trading setup in itself. If you see the price break above resistance and then the next candle closes firmly back inside the range, it can be an excellent signal to take a short trade, placing your stop just above the high of the “fakeout.”
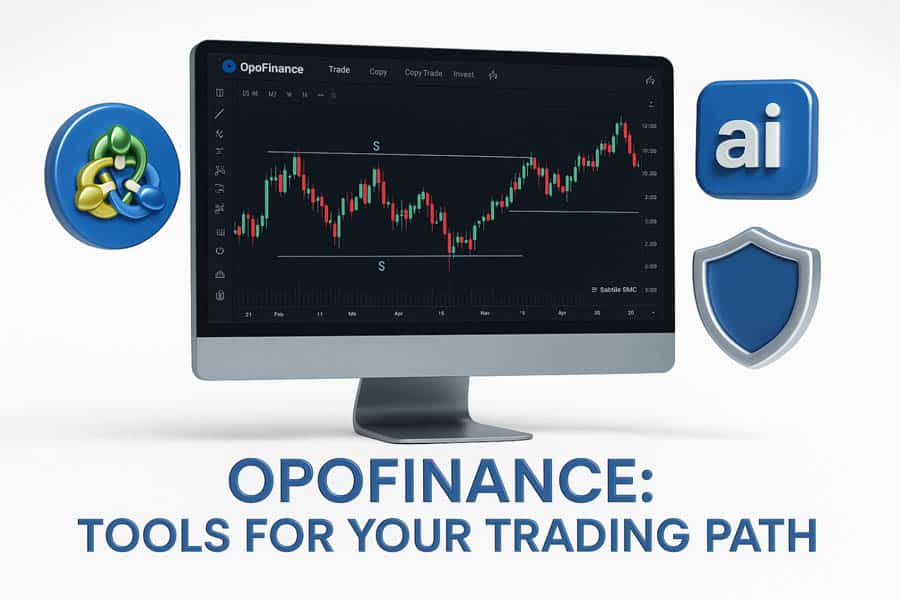
Opofinance Services
To effectively implement these strategies, you need a broker that provides the right tools and a secure environment. As an ASIC-regulated broker, Opofinance offers a platform built for traders looking to master any market condition, including ranges.
- Advanced Trading Platforms: Choose from industry-leading platforms like MT4, MT5, cTrader, and the proprietary OpoTrade platform, all equipped with the indicators discussed in this article.
- Innovative AI Tools: Gain a competitive edge with cutting-edge technology. Utilize the AI Market Analyzer to spot opportunities, an AI Coach to refine your strategy, and AI Support for instant assistance.
- Social & Prop Trading: Learn from the community with Social Trading or prove your skills and get funded through their Prop Trading program.
- Secure & Flexible Transactions: Experience peace of mind with safe and convenient deposit and withdrawal methods, including crypto payments. Opofinance charges zero fees on transactions, ensuring more of your profits stay with you.
Ready to take your range trading to the next level? Explore the powerful tools and secure environment at Opofinance.
Conclusion: Embrace and Conquer the Range
So many traders spend their careers chasing elusive trends, viewing sideways markets as nothing more than frustrating dead zones. This is a massive missed opportunity. With the correct mindset and a refined toolkit, these ranges can become the most predictable and consistently profitable environments you trade. We’ve established that the quest for a single best indicator for range trading is better served by a powerful combination. The ADX acts as your gatekeeper, confirming the range. Oscillators like the RSI and boundary indicators like Bollinger Bands provide your high-probability entry signals. By diligently following a structured strategy—identify, confirm, time, and manage—you can stop fighting the market’s natural rhythm and start profiting from it. The next step is up to you: open a demo chart, apply these tools, and practice until they become second nature.
Can I use the MACD indicator for range trading?
While the MACD (Moving Average Convergence Divergence) is a superb trend-following indicator, it is generally less effective in a ranging market. Its signals, which rely on moving average crossovers, can create frequent false entries and exits in a sideways environment.
How do I know when a ranging market is about to end?
Look for clues like a “Bollinger Band squeeze,” where the bands narrow significantly, indicating a build-up of energy for a breakout. Also, monitor the ADX; if it starts to rise from below 25 towards 30, it signals that a trend may be starting to form.
What are the best timeframes for range trading?
Range trading can be applied to any timeframe, but it’s often most effective on hourly (H1), 4-hour (H4), and daily (D1) charts. These higher timeframes tend to have more reliable support and resistance levels compared to the noise on very short-term charts.
Is range trading better than trend trading?
Neither is inherently “better”; they are different strategies for different market conditions. The most successful traders are versatile—they use trend-following strategies when the market is directional and switch to range-bound strategies when the market is moving sideways.
What is the biggest mistake to avoid in a ranging market?
The single biggest mistake is entering a trade in the middle of the range. The highest probability entries are always at the edges—buying near support or selling near resistance. Entering in the middle offers a poor risk-to-reward ratio.


