

Are you struggling to pinpoint profitable entry and exit points on your daily charts? Imagine having a reliable compass to navigate market trends with greater precision. The Moving Average Convergence Divergence (MACD) indicator can be that compass, but only when its settings are finely tuned for the 1-day timeframe.
Seeking the best MACD settings for 1 day chart to elevate your trading performance? This in-depth guide will dissect the intricacies of the MACD, specifically focusing on identifying the optimal MACD settings for daily chart analysis. We will explore how to precisely calibrate this essential indicator for the daily timeframe, empowering you to make more informed and strategic trading decisions. Whether you are an experienced trader or just beginning your journey, a thorough understanding of MACD configuration for 1-day timeframe analysis is paramount. Selecting the right recommended MACD parameters for daily trading can significantly enhance your profitability, especially when partnering with a trustworthy forex broker.
Understanding MACD

The MACD indicator is a momentum oscillator that reveals crucial insights into the direction, strength, momentum, and potential duration of a trend in an asset’s price. At its core, it quantifies the relationship between two exponential moving averages (EMAs) of a security’s price. Understanding its components is the first step to mastering its application.
MACD Components
The MACD is built upon three key components, each playing a distinct role in generating trading signals:
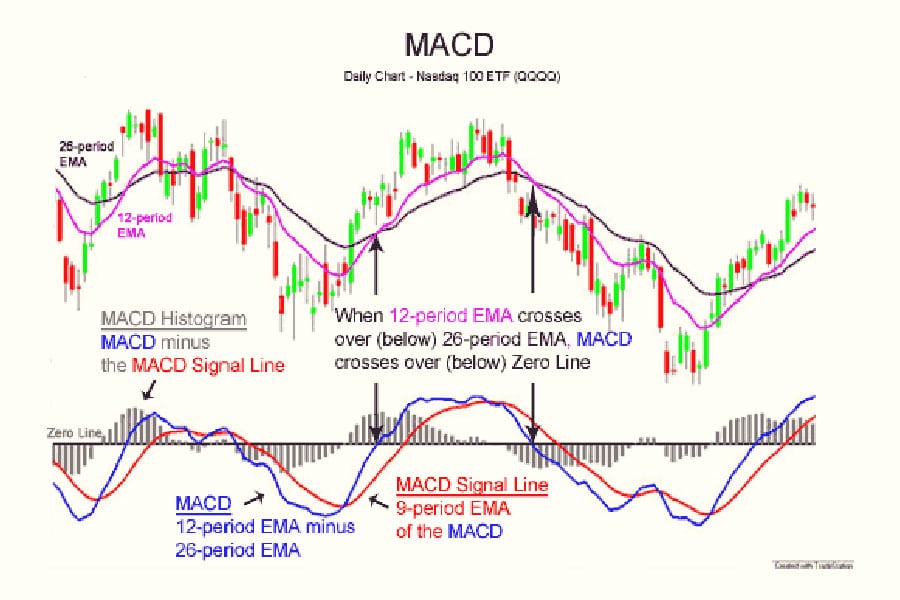
- Fast EMA: Typically set at 12 periods, this shorter-term EMA is highly sensitive to recent price fluctuations. Its responsiveness makes it a leading indicator, reacting quickly to emerging price movements. Think of it as the agile scout, quickly identifying potential shifts in momentum.
- Slow EMA: Usually set at 26 periods, this longer-term EMA reacts more deliberately to price changes. It provides a broader perspective on the prevailing trend, smoothing out short-term volatility. This acts as the strategic planner, offering a view of the bigger picture.
- Signal Line: A 9-period EMA of the MACD line itself, the signal line smooths the MACD’s oscillations. Crossovers between the MACD line and the signal line are often interpreted as potential buy or sell signals. This acts as a trigger, highlighting potential action points based on the MACD’s momentum.
Optimal Daily Chart Settings
The question on every trader’s mind: are the default optimal MACD settings for daily chart analysis truly the best? For many traders focusing on the daily timeframe, the 12, 26, 9 configuration provides a balanced and effective starting point. These settings are designed to capture medium-term trends with reasonable accuracy, filtering out much of the short-term noise inherent in shorter timeframes. Imagine it as a well-calibrated instrument, capable of detecting significant shifts in market sentiment that play out over days and weeks.
However, the “best” settings are not universal. They are intrinsically linked to your individual trading style, the specific characteristics of the instruments you trade, and your risk tolerance. Let’s delve into alternative MACD configuration for 1-day timeframe analysis that might be more appropriate for specific trading strategies and objectives.
Adapting Settings to Your Strategy
While the default settings serve as a robust foundation, consider these adjustments to align the MACD with your specific trading approach:
Heightened Sensitivity: The 5, 34, 5 Configuration
For traders seeking to capture earlier signals and capitalize on shorter-term price swings within the daily trend, a more sensitive configuration like 5, 34, 5 can be advantageous. The shorter 5-period fast EMA will react swiftly to minor price changes, potentially signaling entry or exit points sooner than the default settings. The 34-period slow EMA still provides a valuable longer-term context, while the 5-period signal line enhances responsiveness.
This setup is akin to having a highly sensitive radar, capable of detecting subtle shifts in momentum. However, be aware that increased sensitivity can also lead to more frequent and potentially false signals, requiring strong confirmation from other indicators or price action analysis. Think of it as amplifying the signal, which can be beneficial but also requires careful interpretation to avoid noise.
Smoother Signals: The 15, 35, 10 Approach
Traders who prioritize fewer, more reliable signals and aim to filter out short-term market fluctuations might find a smoother configuration like 15, 35, 10 more suitable. The longer 15-period fast EMA and 35-period slow EMA will smooth the MACD line, reducing the occurrence of whipsaws and potentially filtering out insignificant price movements. The 10-period signal line further contributes to this smoother interpretation, providing more deliberate crossover signals. This approach is often favored by swing traders on the daily chart who are focused on capturing more substantial, sustained price movements that unfold over several days or weeks. It’s like using a strong filter, focusing on the most significant and reliable signals while minimizing distractions from short-term volatility.
The Power of Personalized Optimization
Ultimately, the most effective method for determining the recommended MACD parameters for daily trading that perfectly align with your individual trading style and the specific nuances of your chosen instruments is through rigorous backtesting. This involves systematically applying different MACD settings to historical price data and meticulously analyzing the resulting signals and their profitability.
Consider using trading software or platforms that allow for backtesting and optimization. Observe how the indicator performed across various market conditions – trending, ranging, and periods of high volatility. This hands-on, data-driven approach provides invaluable insights into which settings have historically yielded the most favorable results for your specific strategies and the assets you trade. Remember, what proves effective for one asset or under specific market conditions may not be optimal for another. This personalized optimization is akin to tailoring a suit – ensuring a perfect fit for your specific needs and preferences.
Customizing Your MACD
The process of adjusting your MACD settings is not arbitrary; it’s a strategic decision-making process influenced by a confluence of key factors. A deep understanding of these factors empowers you to make informed choices and precisely fine-tune the indicator to gain a significant edge in your trading.

Factors Influencing MACD Settings
- Trading Style: Your trading style forms the cornerstone of your MACD configuration. Scalpers operating on intraday charts require vastly different settings compared to swing traders analyzing daily charts or long-term investors examining weekly or monthly trends. Day traders might opt for slightly faster settings on the daily chart to capture intraday momentum, while long-term investors might utilize significantly longer periods to identify overarching trends. Your trading style dictates the timeframe you’re focused on and the frequency of signals you require.
- Asset Class: The inherent characteristics of different asset classes play a crucial role in determining optimal MACD settings. For instance, cryptocurrency markets are generally characterized by higher volatility compared to established stock markets. Consequently, you might need to adjust your MACD settings to account for these differences. A more volatile asset might benefit from longer periods to filter out excessive noise, while a less volatile asset might respond effectively to shorter periods that capture subtle shifts in momentum. Consider the typical price swings and volatility patterns of the assets you trade.
- Market Volatility and Conditions: Market conditions are dynamic and constantly evolving. During periods of heightened volatility, characterized by rapid and unpredictable price swings, employing longer MACD periods can help to avoid being whipsawed by erratic price movements and false signals. Conversely, in calmer, trending markets with more predictable price action, shorter periods might enable you to identify entry and exit points more promptly and efficiently. Adapt your settings to the prevailing market environment to maximize the indicator’s effectiveness.
The Indispensable Role of Validation
It is absolutely crucial to emphasize that you should never implement new MACD settings in live trading with real capital without first conducting thorough backtesting and validation. Backtesting involves applying your chosen settings to a substantial amount of historical price data and simulating trades based on the generated signals. This process allows you to objectively assess the historical performance of your chosen settings, identify potential weaknesses or pitfalls, and evaluate the overall risk-reward profile. Furthermore, after rigorous backtesting, consider forward testing your settings on a demo account or with very small position sizes in a live trading environment.
This allows you to validate your backtesting results in real-time market conditions without risking significant capital. This cautious and methodical approach is paramount for protecting your trading capital and building confidence in the reliability and effectiveness of your chosen MACD configuration for 1-day timeframe analysis. Think of it as a pilot running simulations before taking flight – ensuring everything is functioning optimally before the real test.
Combining MACD with Other Tools
While the MACD is a powerful and versatile indicator in its own right, its effectiveness can be significantly amplified when used in synergy with other technical analysis tools and indicators. This confluence of signals from multiple sources can provide stronger confirmation of trading opportunities and reduce the probability of acting on false or misleading signals.

Enhancing Signal Confirmation
- Relative Strength Index (RSI): The RSI is a momentum oscillator that measures the velocity and magnitude of recent price changes. Combining the MACD with the RSI can be particularly effective in confirming the strength and sustainability of a trend. For example, if the MACD generates a bullish crossover signal, and the RSI is simultaneously above the 50 level (indicating positive momentum), it strengthens the conviction of the buy signal. Conversely, a bearish MACD crossover coupled with an RSI reading below 50 reinforces the sell signal. The RSI adds a layer of momentum confirmation to the MACD’s trend-following signals.
- Bollinger Bands: Bollinger Bands are volatility indicators that plot bands at standard deviations away from a simple moving average. When the MACD signals a potential breakout (e.g., a bullish crossover), and the price is also approaching or breaking above the upper Bollinger Band, it suggests a higher probability of a strong upward move fueled by increasing volatility. Conversely, a bearish MACD crossover occurring near the lower band could indicate a potential breakdown with increasing selling pressure. Bollinger Bands provide context regarding volatility and potential price extremes, complementing the MACD’s momentum analysis.
- Moving Averages (MA): Simple or exponential moving averages can serve as valuable tools for identifying the prevailing trend direction. If the price is trading consistently above a longer-term moving average (e.g., the 200-day MA), indicating an overall uptrend, and the MACD subsequently generates a bullish crossover, it provides further confirmation of the bullish bias. Conversely, if the price is trading below a key moving average and the MACD signals a bearish crossover, it reinforces the downtrend scenario. Moving averages provide a broader trend context that can filter and validate MACD signals.
Strategic Confluence in Action
Consider this illustrative scenario: you are meticulously analyzing a daily chart of a particular stock. The price action has been consolidating within a defined range for several weeks. Suddenly, you observe the MACD line preparing to make a bullish crossover above the signal line. Simultaneously, you notice that the RSI is steadily climbing towards the 60 level, indicating increasing buying pressure and positive momentum. Furthermore, the price is approaching the upper band of the Bollinger Bands, suggesting a potential increase in volatility and a possible breakout.
This powerful confluence of confirming signals from the MACD, RSI, and Bollinger Bands provides a strong indication of a potential breakout to the upside, offering a higher-confidence entry point for a long position. Remember, the greater the number of independent indicators confirming a potential trading opportunity, the higher the probability of a successful trade outcome. This multi-indicator approach provides a more robust and reliable assessment of market conditions.
Pro Tips for Experienced Traders

For those with more experience in technical analysis, here are some advanced techniques to further refine your MACD application:
- Divergence Analysis: MACD divergence is a powerful concept that occurs when the price action of an asset and the MACD indicator move in opposing directions. Bearish divergence arises when the price makes a series of higher highs, but the MACD indicator simultaneously forms lower highs. This divergence can signal a potential weakening of the uptrend and a possible impending trend reversal to the downside. Conversely, bullish divergence occurs when the price makes lower lows, but the MACD indicator forms higher lows, suggesting a potential weakening of the downtrend and a possible reversal to the upside. Identifying and effectively trading divergences requires practice, keen observation skills, and a thorough understanding of price action, but it can offer high-probability trading opportunities with favorable risk-reward ratios.
- Zero Line Crossovers: Pay close attention to instances when the MACD line crosses above or below the zero line on the indicator. A decisive cross above the zero line signifies that the shorter-term EMA is now trading above the longer-term EMA, indicating a shift towards bullish momentum and potentially signaling the start of an uptrend. Conversely, a cross below the zero line suggests that the shorter-term EMA has fallen below the longer-term EMA, indicating bearish momentum and a potential downtrend. These zero line crossovers can be powerful signals, particularly when they are confirmed by other technical indicators or significant price action patterns.
- Histogram Interpretation: The MACD histogram provides a visual representation of the distance between the MACD line and the signal line. Increasing histogram bars indicate that the momentum in the direction of the MACD line is strengthening, suggesting a growing divergence between the two EMAs. Conversely, decreasing histogram bars suggest that the momentum is weakening, indicating a convergence of the EMAs. Analyzing the histogram can provide early clues about potential trend changes or the strength of an existing trend, often preceding the actual MACD line crossover. This can allow for earlier entry or exit decisions.
Avoiding Common MACD Mistakes
Even when utilizing the best MACD settings for 1 day chart analysis, traders can inadvertently fall into common pitfalls that diminish the indicator’s effectiveness. Recognizing and actively avoiding these mistakes is crucial for maximizing the MACD’s potential and improving your trading outcomes.
- Over-reliance on a Single Indicator: While the MACD is a valuable and versatile tool, it is essential to remember that no single indicator is infallible. Relying solely on MACD signals without considering other crucial factors such as price action patterns, key support and resistance levels, overall market sentiment, and fundamental analysis is a risky approach that can lead to suboptimal trading decisions. Always strive to use the MACD in conjunction with other forms of analysis to gain a more comprehensive and balanced perspective of market conditions.
- Using Excessively Sensitive Settings: While faster MACD settings can provide earlier signals, potentially allowing you to enter trades sooner, they also inherently generate a higher number of false signals, particularly in choppy or sideways market conditions characterized by erratic price movements. Exercising caution when using extremely short periods for the EMAs and the signal line is crucial, as these settings can lead to frequent whipsaws and unnecessary losses due to acting on misleading signals.
- Failure to Adapt to Market Dynamics: Market conditions are constantly evolving, and the characteristics of different assets can change over time. Sticking rigidly to a single set of MACD parameters regardless of the prevailing market volatility, the specific behavior of the asset you are trading, or significant shifts in market structure can significantly hinder your trading performance. Being adaptable and willing to periodically review and adjust your MACD settings based on the current market environment is essential for maintaining the indicator’s effectiveness and optimizing your trading strategy.
Opofinance: Empowering Your Trading Journey
Are you seeking a reputable and regulated online forex broker to effectively implement your refined MACD trading strategies? Consider Opofinance, an ASIC-regulated broker dedicated to providing a secure, transparent, and efficient trading environment for its clients.
- ASIC Regulation: Trade with confidence and peace of mind knowing that Opofinance adheres to the rigorous regulatory standards set forth by the Australian Securities and Investments Commission (ASIC), a leading financial regulator.
- Social Trading Platform: Benefit from the collective knowledge and experience of other traders through Opofinance’s innovative social trading platform. Learn from the strategies of seasoned professionals and potentially mirror their trades to enhance your own trading performance.
- Official MT5 Broker Listing: Gain access to the powerful and widely acclaimed MetaTrader 5 (MT5) platform, a favorite among professional traders worldwide, through Opofinance.
- Secure and Convenient Transactions: Enjoy a seamless and hassle-free trading experience with a wide array of secure and convenient deposit and withdrawal methods, ensuring easy access to your trading funds.

Ready to take your trading to the next level? Explore the opportunities that await you with Opofinance today!
Conclusion
Mastering the application of the best MACD settings for 1 day chart analysis is a continuous process of learning, experimentation, and refinement. While the default settings provide a solid foundation for many traders, a deep understanding of how to customize these settings based on your individual trading style, the specific characteristics of the assets you trade, and the prevailing market conditions is paramount for unlocking the indicator’s full potential and achieving consistent profitability.
Remember that the most effective approach involves rigorous backtesting of different settings, combining the MACD with other complementary indicators to confirm signals, and continuously adapting your strategy to the ever-evolving dynamics of the market. By diligently applying these principles and remaining a committed student of the markets, you can significantly enhance your ability to identify and capitalize on profitable trading opportunities within the daily timeframe.
Key Takeaways
- The default MACD settings (12, 26, 9) offer a balanced starting point for daily chart analysis.
- Tailor your MACD settings to align with your specific trading style and objectives.
- Consider the unique volatility and characteristics of the assets you are trading when selecting settings.
- Always conduct thorough backtesting and validation of your chosen MACD settings before deploying them in live trading.
- Combining the MACD with other indicators like the RSI and Bollinger Bands can significantly improve the accuracy of your trading signals.
- Avoid the common pitfalls of over-reliance on the MACD and using excessively sensitive settings that can lead to false signals.
What is the practical interpretation of the MACD line crossing above the signal line?
When the MACD line crosses above the signal line, it is generally interpreted as a bullish signal, suggesting that upward momentum is increasing. This crossover often indicates a potential buying opportunity as the shorter-term moving average is rising faster than the longer-term moving average.
How can I use MACD divergence to anticipate potential trend reversals on the daily chart?
To use MACD divergence for anticipating trend reversals, look for instances where the price is making new highs (in an uptrend) but the MACD is making lower highs, or when the price is making new lows (in a downtrend) but the MACD is making higher lows. These divergences can signal a weakening of the current trend and a potential reversal.
Are there specific times of the day when MACD signals on the daily chart are more reliable?
While MACD signals on the daily chart are generally considered over the entire trading day, the closing hours of the trading session can sometimes provide more significant signals as they reflect the culmination of the day’s trading activity and sentiment. However, it’s crucial to consider the overall context and not solely rely on signals at specific times.


