

Tired of staring at charts, feeling like you’re missing the signals that could lead to profitable trades? Many traders find themselves lost in the noise of shorter timeframes, chasing fleeting opportunities. The good news is, mastering the Moving Average Convergence Divergence (MACD) indicator on the 4-hour chart can be a game-changer. This article dives deep into the best macd settings for 4 hour chart, providing you with actionable strategies and insights to elevate your trading game. We’ll explore why the 4-hour timeframe is so powerful and how to optimize your MACD settings for maximum effectiveness, even touching upon how a reliable forex broker can enhance your trading experience.
Intro to MACD
The Moving Average Convergence Divergence (MACD) is a cornerstone of technical analysis, beloved by traders for its ability to reveal trend direction, momentum shifts, and potential reversal points. Imagine it as a sophisticated speedometer for the market, showing you not just where the price is, but how fast it’s getting there. Developed by Gerald Appel in the late 1970s, the MACD has stood the test of time, proving its value across various asset classes.

MACD Explained
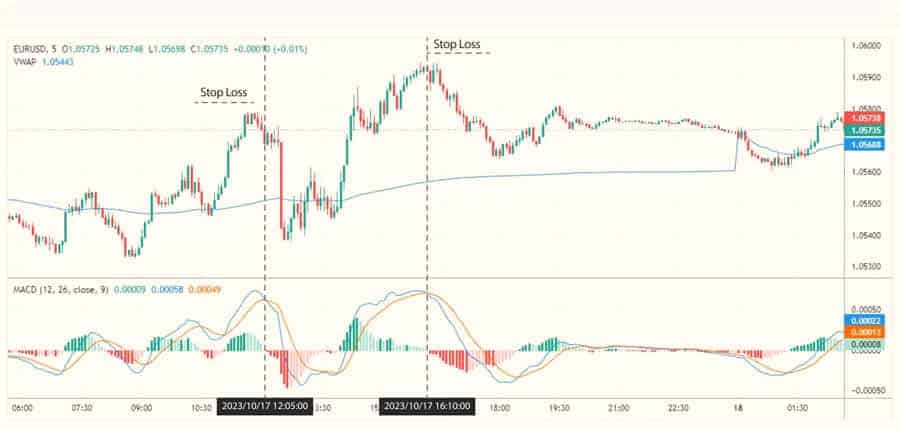
At its core, the MACD comprises two exponential moving averages (EMAs) and a signal line. The MACD line itself is the difference between a shorter-period EMA (typically 12 periods) and a longer-period EMA (typically 26 periods). This difference oscillates above and below a zero line. A signal line, usually a 9-period EMA of the MACD line, is then plotted on top. Crossovers between the MACD line and the signal line, as well as the MACD line crossing the zero line, generate potential trading signals. The histogram, often displayed alongside the MACD, visually represents the distance between the MACD line and the signal line, offering further insights into momentum.
Why MACD Matters
Traders gravitate towards the MACD for several compelling reasons:
- It’s incredibly versatile, working across different markets, from forex to stocks to cryptocurrencies.
- It provides a clear visual representation of momentum shifts. When the MACD line is rising and above the signal line, it suggests bullish momentum. Conversely, when it’s falling below the signal line, bearish momentum is indicated.
- The zero line acts as a crucial pivot point, with crosses above suggesting a shift towards an uptrend and crosses below signaling a potential downtrend.
This ability to distill complex price action into easily interpretable signals makes the MACD an invaluable tool for both novice and experienced traders. It truly helps you get a handle on market movements.
Optimizing MACD Settings
While the default MACD settings (12, 26, 9) are a good starting point, they aren’t universally optimal. Different timeframes exhibit varying degrees of price volatility and trend duration. Shorter timeframes, like the 1-minute or 5-minute charts, are often plagued by market noise, leading to false signals with default settings. Conversely, longer timeframes, like the daily or weekly charts, might react too slowly to capture timely trading opportunities. The 4-hour chart strikes a sweet spot, offering a balance between filtering out short-term noise and capturing meaningful medium-term trends. Therefore, fine-tuning your macd settings for 4 hour chart is crucial to align the indicator’s sensitivity with the specific characteristics of this timeframe, leading to more accurate and profitable trading decisions.
Read More: 4 hour forex trading strategy
Why 4-Hour Charts for MACD?

The 4-hour chart holds a unique position in the trader’s toolkit, offering a compelling blend of advantages that make it particularly well-suited for MACD-based strategies. It bridges the gap between the rapid fluctuations of intraday charts and the slower, broader movements seen on daily charts.
4-Hour Timeframe Benefits
Several key benefits make the 4-hour chart a favorite among swing traders and those seeking to capture medium-term trends:
- It significantly reduces market noise compared to shorter timeframes. Erratic price swings and short-lived volatility spikes are less likely to trigger false signals on the 4-hour chart, leading to more reliable interpretations of the MACD.
- It provides a clearer picture of the underlying trend. The longer duration of each candle smooths out short-term fluctuations, making it easier to identify the dominant direction of price movement. This clarity is invaluable when using the MACD to confirm trend continuation or identify potential reversals.
- The 4-hour chart allows for a more balanced approach to trading, requiring less constant monitoring than intraday charts, making it suitable for individuals with other commitments.
It’s about finding that happy medium.
Balancing Noise and Clarity
The effectiveness of the 4-hour chart lies in its ability to filter out the “chatter” of the market while still being responsive enough to capture significant price movements. Each 4-hour candle represents a substantial period of trading activity, reflecting a more considered consensus among market participants than the fleeting price action seen on shorter timeframes.
This inherent smoothing effect reduces the likelihood of being whipsawed by temporary volatility. At the same time, the 4-hour timeframe is not so long that it delays signals excessively. It allows traders to identify developing trends relatively early, providing ample opportunity to enter positions before the move becomes overextended. This balance is crucial for the MACD, as it allows the indicator to generate signals that are both reliable and timely, making it an excellent choice for traders aiming for consistent profitability.
Default vs. Custom MACD Settings
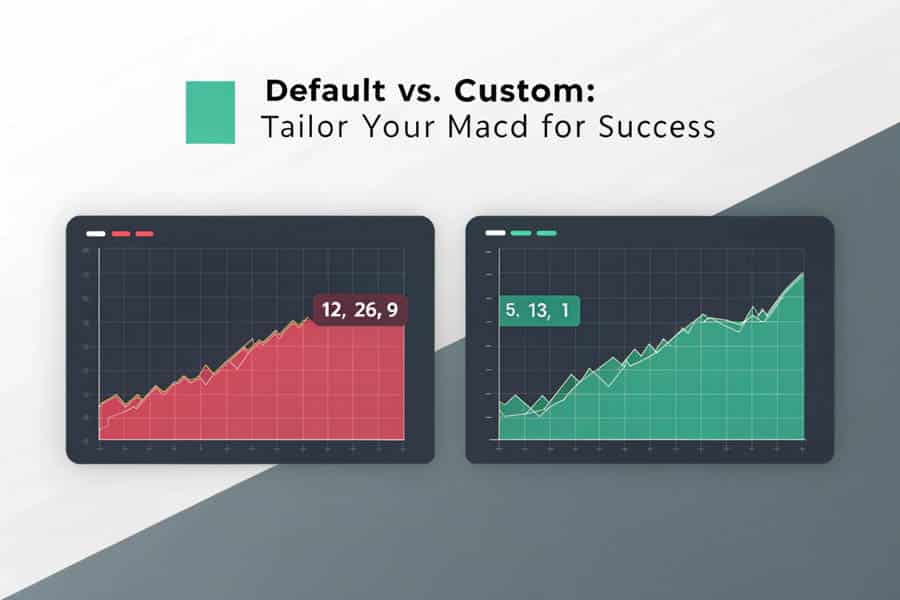
Understanding the nuances between default and customized MACD settings is paramount to maximizing the indicator’s potential on the 4-hour chart. While the standard settings serve as a general benchmark, tailoring them to the specific timeframe can significantly enhance their effectiveness.
Understanding Default Settings
The default MACD settings of 12 for the fast EMA, 26 for the slow EMA, and 9 for the signal line are widely used and often the first settings traders encounter. These values were originally chosen to represent approximately two weeks of trading data for the fast EMA and roughly a month for the slow EMA on a daily chart. The 9-period signal line acts as a smoother of the MACD line, helping to identify potential entry and exit points based on crossovers. While these settings can be effective in certain market conditions and on specific timeframes, they may not always be optimal for the 4-hour trading environment.
Limitations of Default on 4-Hour
On the 4-hour chart, the default MACD settings can sometimes be too slow to react to emerging trends. The 12 and 26-period EMAs, while effective at smoothing out noise, can lag behind significant price movements, potentially causing traders to miss early entry opportunities or hold onto losing positions for too long. This lag can be particularly problematic in fast-moving markets or when dealing with assets exhibiting high volatility.
Furthermore, the 9-period signal line, while intended to provide timely signals, can sometimes generate too many false crossovers on the 4-hour chart, leading to confusion and potentially unprofitable trades. Therefore, relying solely on default settings without considering customization can hinder your ability to effectively utilize the MACD on this timeframe. It’s like trying to fit a square peg in a round hole.
Why Customize MACD?
Customizing your macd settings for 4 hour chart offers several key advantages:
- By adjusting the periods of the fast and slow EMAs, you can fine-tune the indicator’s sensitivity to price changes.
- Shortening the periods, for example, makes the MACD more responsive to recent price action, potentially leading to earlier and more accurate signals.
- Conversely, lengthening the periods can further reduce noise and provide a smoother representation of the underlying trend.
- Similarly, adjusting the signal line period can impact the frequency of crossover signals.
Experimenting with different combinations allows you to find settings that are optimally aligned with the specific characteristics of the assets you are trading and the prevailing market conditions on the 4-hour chart. This tailored approach can significantly improve the accuracy and profitability of your MACD-based trading strategies.
Recommended MACD Setup
While there’s no one-size-fits-all solution, certain MACD settings tend to perform exceptionally well on the 4-hour chart, offering a compelling balance between responsiveness and reliability. These adjusted settings aim to capture medium-term trends more effectively while minimizing false signals.
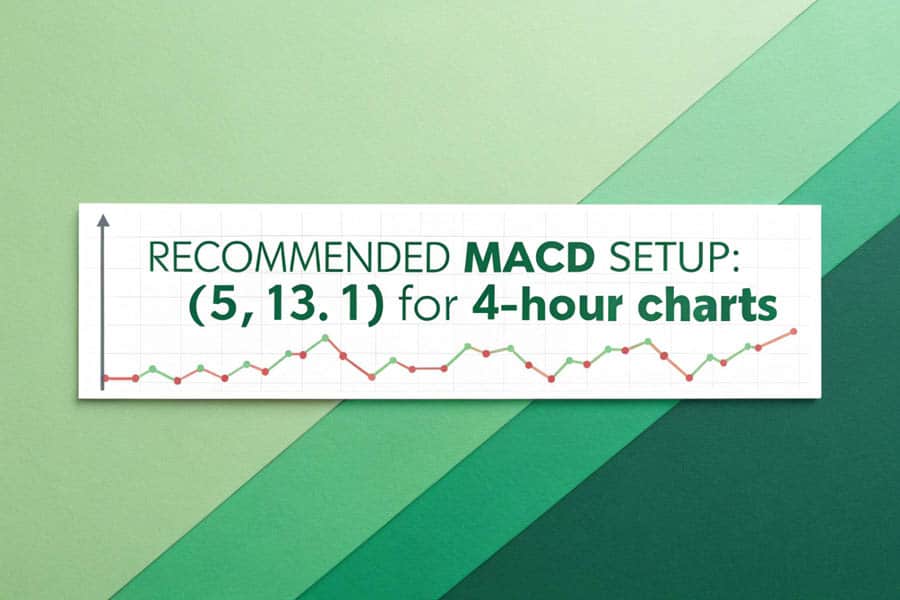
Optimal 4-Hour Settings
A popular and often effective customization for the 4-hour chart involves using a faster EMA of 5 periods, a slower EMA of 13 periods, and a signal line of just 1 period. These settings, often referred to as the (5, 13, 1) MACD, significantly increase the indicator’s sensitivity to price changes. The shorter EMA periods allow the MACD line to react more quickly to emerging trends, providing earlier entry signals. The 1-period signal line, in essence, makes the MACD line itself the primary signal generator, focusing on zero-line crossovers and the direction of the MACD line relative to zero. This configuration is particularly effective in capturing strong, sustained trends on the 4-hour chart.
Why These Settings Excel
The (5, 13, 1) MACD settings are well-suited for capturing medium-term trends on the 4-hour chart because they strike a balance between responsiveness and noise reduction. The shorter EMA periods allow the MACD to quickly identify shifts in momentum, enabling traders to enter positions early in a developing trend. The focus on zero-line crossovers and the MACD line’s direction provides clear signals aligned with the overall trend. While more sensitive than the default settings, these customized values still filter out much of the short-term noise prevalent on lower timeframes, leading to more reliable signals for swing trading and medium-term position holding. This configuration helps traders capitalize on significant price movements that unfold over several 4-hour periods.
Settings Across Timeframes
It’s important to understand how these recommended macd settings for 4 hour chart compare to settings that might be more appropriate for other timeframes. On a 1-hour chart, even faster settings might be considered to capture intraday movements, potentially using values like (3, 10, 1). However, this increased sensitivity comes at the cost of more false signals.
Conversely, on a daily chart, slower settings closer to the default (or even longer periods) might be preferred to focus on long-term trends and filter out daily fluctuations. The (5, 13, 1) configuration is specifically optimized for the 4-hour chart’s characteristics, providing a sweet spot for capturing medium-term swings without being overly reactive to short-term volatility. Choosing the right settings is crucial for aligning the MACD’s sensitivity with the specific timeframe you are trading.
Read More: MACD Indicator in Forex Trading
Setting Up MACD: A Step-by-Step Guide

Implementing your chosen MACD settings on your trading platform is a straightforward process. This guide will walk you through the steps on popular platforms, ensuring you can quickly and accurately configure the indicator for 4-hour chart analysis.
Configuring MACD on Your Platform
The process for adding and customizing the MACD indicator is similar across most popular trading platforms. Here’s how to do it on some common platforms:
MetaTrader 4 (MT4) and MetaTrader 5 (MT5)
- Go to “Insert” in the top menu.
- Select “Indicators”.
- Choose “Oscillators”.
- Click on “MACD”.
- A window will appear. Change the “Fast EMA” to 5, the “Slow EMA” to 13, and the “MACD SMA” to 1.
TradingView
- Click on “Indicators” at the top of the chart.
- Search for “MACD” and select it.
- Click on the settings cogwheel next to the MACD indicator on your chart.
- Modify the “Fast Length,” “Slow Length,” and “Signal Smoothing” values to 5, 13, and 1 respectively.
Remember to apply the changes to see the customized MACD on your 4-hour chart.
Adding Moving Averages for Confirmation
While the MACD is a powerful indicator on its own, combining it with other tools can significantly enhance the reliability of your trading signals. Adding moving averages, such as the 89-period EMA and the 200-period SMA, can provide valuable context and confirmation. The 89 EMA is often used to identify intermediate-term trends, while the 200 SMA is a widely followed indicator of the long-term trend. To add these:
- On MT4/MT5: Go to “Insert” -> “Indicators” -> “Trend” and select “Moving Average.” Configure the period and method (Exponential for EMA, Simple for SMA).
- On TradingView: Use the “Indicators” search again.
Look for confluence between MACD signals and the position of price relative to these moving averages. For example, a MACD buy signal above the 89 EMA and 200 SMA provides stronger confirmation of an uptrend. It’s about having multiple arrows in your quiver.
MACD Trading Strategies on 4-Hour Charts
Once you have your MACD configured with the optimal settings for the 4-hour chart, you can employ various trading strategies to capitalize on the signals it generates. These strategies focus on identifying trend continuation and potential reversals.
Riding the Trend
One of the most common trend continuation strategies involves looking for MACD line crossovers above the signal line when the MACD is already above the zero line, indicating bullish momentum within an existing uptrend. Conversely, look for MACD line crossovers below the signal line when the MACD is below the zero line, signaling bearish momentum in a downtrend. Histogram analysis can further refine these signals. As the histogram bars expand away from the zero line, it confirms increasing momentum in the direction of the trend. Conversely, shrinking histogram bars can suggest weakening momentum and a potential pullback or consolidation. Using these signals in conjunction with the overall trend direction identified by longer-term moving averages can lead to high-probability entries.
Spotting Reversals with Divergence
Divergence is a powerful concept that can signal potential trend reversals. Bullish divergence occurs when the price is making lower lows, but the MACD is making higher lows. This suggests that selling pressure is waning, and a potential upward reversal is brewing. Conversely, bearish divergence occurs when the price is making higher highs, but the MACD is making lower highs, indicating weakening buying pressure and a potential downward reversal. Identifying divergence on the 4-hour chart, especially when confirmed by other indicators or price action patterns, can provide high-reward, low-risk entry opportunities. However, it’s crucial to remember that divergence is a warning sign, not a guaranteed reversal, and should be used in conjunction with other confirmation signals.
Combining MACD with Other Tools
To further enhance the reliability of your MACD signals on the 4-hour chart, consider combining it with other complementary indicators. The Relative Strength Index (RSI) can help confirm overbought or oversold conditions, providing additional confluence for potential reversals identified by MACD divergence. For example, bearish divergence on the MACD coupled with an overbought RSI reading strengthens the case for a potential downtrend.
As mentioned earlier, moving averages like the 89 EMA and 200 SMA can help define the overall trend direction. Only consider taking MACD buy signals when the price is above these moving averages and sell signals when the price is below. This multi-indicator approach helps filter out false signals and increases the probability of successful trades by providing a more holistic view of market conditions.
Read More: Best ema settings for 4 hour chart
Avoiding Common MACD Mistakes
Even with the best macd settings for 4 hour chart, traders can fall into common pitfalls that hinder their success. Being aware of these mistakes can help you avoid them and improve your trading performance.
Don’t Fly Solo with MACD
One of the biggest mistakes traders make is relying solely on MACD signals without seeking confirmation from other indicators, price action analysis, or fundamental factors. The MACD, like any indicator, is not infallible and can generate false signals. Always look for confluence from other sources before entering a trade based on a MACD signal. Confirming signals with trendlines, support and resistance levels, candlestick patterns, or other indicators like the RSI can significantly increase the probability of a successful trade.
Sensitivity in Volatile Markets
While the (5, 13, 1) settings are generally effective, using overly sensitive MACD settings in highly volatile market conditions can lead to a barrage of false signals and whipsaws. In such environments, consider using slightly less sensitive settings or focusing on higher timeframe analysis. Understanding the current market volatility and adjusting your indicator settings accordingly is crucial for avoiding unnecessary losses.
The Bigger Picture Matters
Technical analysis, including the use of the MACD, should not be conducted in isolation. Ignoring the broader market context and fundamental factors can lead to poor trading decisions. Be aware of major economic news releases, geopolitical events, and overall market sentiment, as these factors can significantly impact price movements and invalidate technical signals. Always consider the fundamental backdrop before acting on MACD signals, especially on the 4-hour chart, which can be influenced by medium-term economic trends. Don’t get so caught up in the trees that you miss the forest for the trees.
Pro Tips for Optimizing MACD
For experienced traders looking to further refine their MACD strategies on the 4-hour chart, several advanced techniques can be employed to optimize performance and gain a competitive edge.
Multi-Timeframe Confirmation
A powerful technique is to use multiple timeframe analysis to confirm the trend direction identified on the 4-hour chart. For example, before taking a long position based on a MACD signal on the 4-hour chart, check the daily chart to ensure the overall trend is also bullish. This top-down approach helps filter out counter-trend signals and increases the probability of trading in the direction of the dominant trend. Consistency across multiple timeframes provides stronger confirmation and can lead to more confident trading decisions.
Adapting to Market Volatility
As mentioned earlier, adapting your MACD settings to prevailing market conditions can significantly improve their effectiveness. In periods of high volatility, consider slightly increasing the EMA periods to reduce sensitivity and filter out noise. Conversely, in low volatility environments, you might slightly decrease the periods to make the indicator more responsive to smaller price movements. This dynamic adjustment allows you to tailor the MACD to the specific characteristics of the current market, leading to more accurate signals.
Testing Your Strategy
Before deploying any MACD trading strategy with real capital, it’s crucial to rigorously backtest and forward test your approach. Backtesting involves applying your strategy to historical data to assess its performance and identify potential weaknesses. Forward testing, also known as paper trading, involves applying your strategy in real-time market conditions without risking actual capital. These processes allow you to fine-tune your settings, refine your entry and exit rules, and gain confidence in your strategy before risking your hard-earned money. Thorough testing is an essential step in developing a robust and profitable MACD trading system.
OpoFinance Services
- OpoFinance is an ASIC-regulated broker, providing a secure and trustworthy trading environment.
- Benefit from OpoFinance’s social trading service, allowing you to learn from and potentially copy the trades of experienced traders.
- OpoFinance is officially featured on the MT5 brokers list, offering access to a powerful and versatile trading platform.
- Enjoy safe and convenient deposit and withdrawal methods, ensuring seamless transactions.

Ready to elevate your trading experience? Explore OpoFinance today and discover the advantages of trading with a regulated and innovative broker.
Conclusion
Mastering the MACD indicator on the 4-hour chart can significantly enhance your trading prowess. By understanding the nuances of the indicator, optimizing your settings, and implementing robust trading strategies, you can unlock profitable opportunities in the market. Remember that consistent profitability requires discipline, patience, and a commitment to continuous learning. Embrace the power of the best macd settings for 4 hour chart and elevate your trading journey.
Key Takeaways
- The 4-hour chart offers a balanced perspective for MACD trading, reducing noise while capturing meaningful trends.
- Customizing MACD settings, such as using (5, 13, 1), can improve responsiveness on the 4-hour chart.
- Combine MACD signals with other indicators and price action for higher probability trades.
- Implement strict risk management, including stop-loss orders and favorable risk-reward ratios.
- Avoid over-reliance on MACD signals and always consider the broader market context.
How can I identify false MACD signals on the 4-hour chart?
To identify false MACD signals, look for confirmation from other indicators like RSI or volume. Also, analyze price action patterns and support/resistance levels. A MACD signal that aligns with these factors is more likely to be valid. Be wary of signals that occur during low volume periods or significant news events, as these can often be misleading.
Is it possible to use MACD divergence effectively on the 4-hour chart for all currency pairs?
While MACD divergence can be effective across various currency pairs on the 4-hour chart, its reliability can vary depending on the pair’s volatility and typical trading patterns. It’s crucial to backtest divergence strategies on specific pairs to understand their effectiveness. Higher probability divergence setups often occur at significant support or resistance levels and are confirmed by other indicators.
Besides crossovers, what other MACD signals can be useful on the 4-hour timeframe?
Besides crossovers, the slope and position of the MACD line relative to the zero line are valuable signals. When the MACD line is consistently above zero and trending upwards, it indicates strong bullish momentum. Conversely, a MACD line below zero and trending downwards suggests bearish momentum. Histogram analysis, showing the divergence between the MACD and signal lines, can also provide early indications of momentum shifts.


