Tired of missing out on those rapid-fire opportunities the market throws your way every few minutes? Do you find yourself staring at a 5-minute chart, feeling like you’re always a step behind? The secret to potentially unlocking consistent gains in this fast-paced environment might just lie in mastering a powerful tool with the right configuration.

This article serves as your comprehensive guide to understanding and implementing the best MACD settings for 5 minutes chart analysis. We’ll navigate the intricacies of this invaluable indicator, explore optimal MACD settings for 5-minute chart trading, and provide you with the knowledge to make informed, potentially profitable decisions. If you’re seeking a reliable online forex broker to put these strategies into action, you’re in the right place. The best MACD settings for 5 minutes chart can significantly enhance your trading, and this article will show you how.
Understanding MACD for Trading
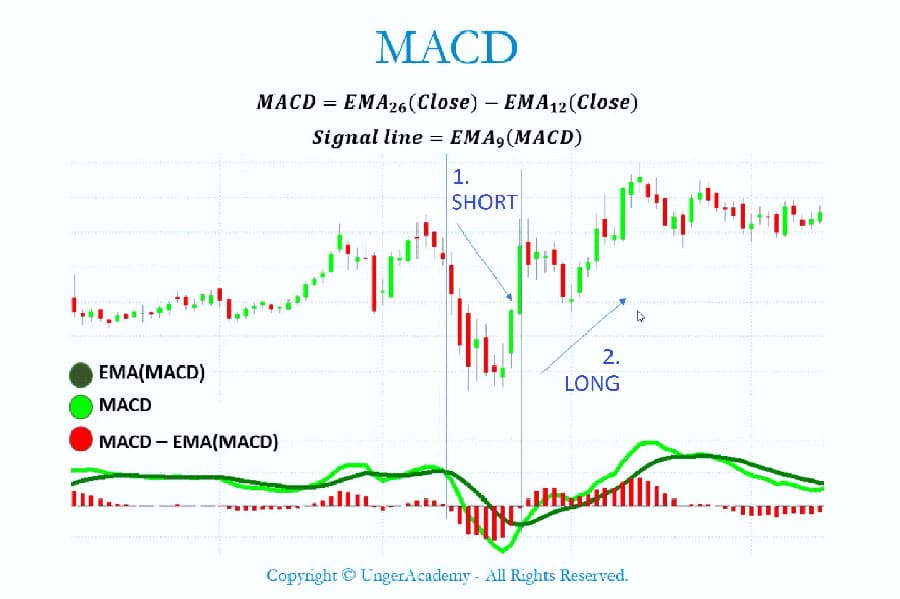
The Moving Average Convergence Divergence (MACD) stands as a cornerstone in the realm of technical analysis. It functions as a momentum oscillator, revealing the relationship between two moving averages of a security’s price. Developed by Gerald Appel in the late 1970s, the MACD is more than just a line on your trading platform; it’s a dynamic instrument capable of signaling potential shifts in trends, identifying momentum changes, and even pinpointing possible entry and exit junctures.
For traders who operate on shorter timeframes, particularly the 5-minute chart, the MACD’s responsiveness becomes exceptionally valuable. In this high-velocity environment, where mere seconds can differentiate between a profitable trade and a loss, the MACD’s capacity to swiftly reflect alterations in price momentum is of utmost importance. While longer-term traders might concentrate on broader, more sustained trends, those who utilize the 5-minute chart are often aiming to capitalize on smaller, more frequent price oscillations. This is precisely where grasping the best MACD parameters for 5-minute timeframe becomes absolutely critical for success.
MACD’s Role in Short-Term Trading
Imagine the 5-minute chart as a bustling marketplace, with prices constantly fluctuating, influenced by a multitude of factors. The MACD acts as your trusted guide, assisting you in discerning the underlying momentum that drives these short-term price movements. It helps you filter out the noise and identify potential opportunities that might otherwise go unnoticed. Therefore, understanding the best MACD settings for 5 minutes chart is paramount for navigating this dynamic landscape.
Decoding MACD Components
To effectively harness the power of the MACD, a thorough understanding of its core components is essential:
- MACD Line: This line represents the difference between two Exponential Moving Averages (EMAs) of the price. Typically, these are the 12-period EMA and the 26-period EMA. The calculation is as follows: MACD Line = 12-period EMA – 26-period EMA. This line oscillates above and below the zero line, indicating whether the shorter-term momentum is above or below the longer-term momentum.
- Signal Line: This is an EMA of the MACD line itself, commonly a 9-period EMA. It serves as a smoother representation of the MACD line. Crossovers between the MACD line and the signal line are frequently interpreted as potential signals to buy or sell.
- Histogram: The histogram provides a visual representation of the difference between the MACD line and the signal line. When the MACD line is positioned above the signal line, the histogram bars are positive (located above the zero line). Conversely, when the MACD line is below the signal line, the histogram bars are negative (situated below the zero line). The height of these bars indicates the strength of the divergence between the two lines.
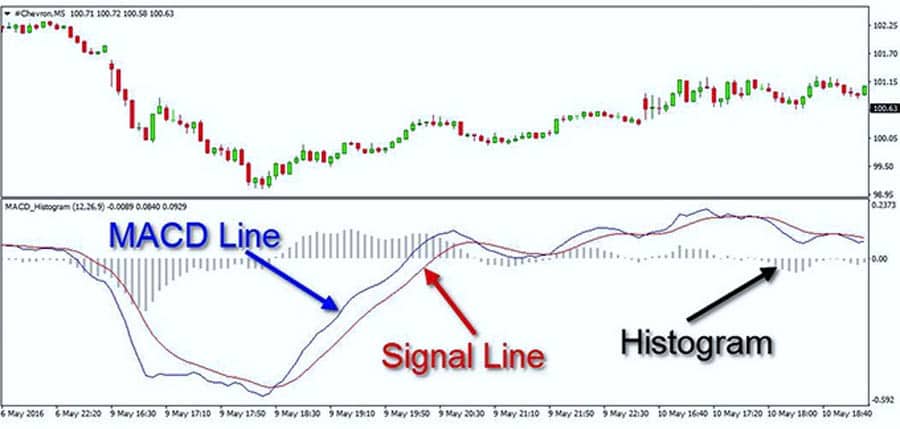
The interaction between these components offers valuable insights into the dynamics of the market. For instance, when the MACD line crosses above the signal line, it suggests that bullish momentum is on the rise. Conversely, when the MACD line crosses below the signal line, it indicates that bearish momentum is gaining strength. The histogram further clarifies these signals, illustrating the accelerating or decelerating nature of the momentum. Grasping how these components interact is fundamental to identifying the top MACD settings for 5-minute scalping.
Read More: 5-Minute Trading Strategy
Default MACD Settings: Are They Enough?
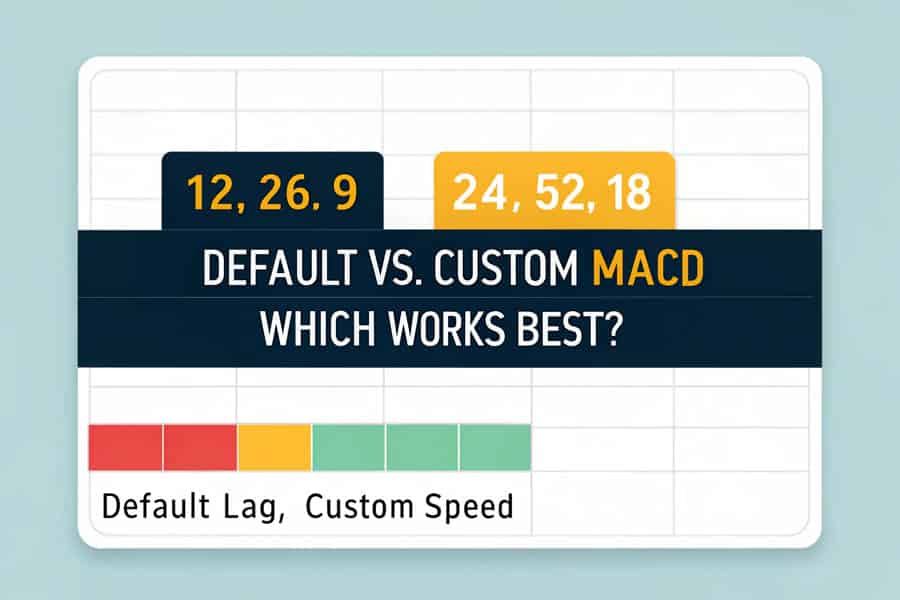
The standard, or default, MACD settings are 12, 26, and 9. These numbers correspond to the periods used for calculating the fast EMA, the slow EMA, and the signal line EMA, respectively. These settings were initially designed for daily charts and are widely employed for identifying trends over the medium term.
However, when applied to the rapid price fluctuations of a 5-minute chart, these default settings can present certain limitations that traders need to be aware of.
Limitations of Standard Settings
- Lagging Signals: The 26-period EMA, being a relatively slower-moving average, can cause the MACD to lag behind the actual price action on a 5-minute chart. This lag can lead to missed opportunities for entry or delayed signals for exit, potentially diminishing profitability.
- Whipsaws and False Signals: The heightened volatility and inherent noise within shorter timeframes can result in more frequent crossovers between the MACD line and the signal line. With the default settings, many of these crossovers might be misleading signals, leading to whipsaws – entering and exiting trades rapidly with small losses.
- Missed Short-Term Opportunities: The slower responsiveness of the default settings might cause you to overlook smaller, quicker price movements that are characteristic of trading on a 5-minute chart. Therefore, finding the best MACD settings for 5 minutes chart becomes crucial.
While the default settings serve as a useful starting point for understanding the MACD, relying solely on them for trading on a 5-minute chart can be disadvantageous. To effectively navigate the complexities of this timeframe, adjustments are often necessary to generate more responsive and accurate signals. This is where exploring alternative best macd settings for 5 min chart becomes essential for traders seeking an edge.
Finding the Best MACD Settings for 5 Minutes Chart
So, what constitutes the best MACD settings for 5 minutes chart trading? While there isn’t a single, universally perfect answer – as the optimal settings can vary depending on individual trading styles and prevailing market conditions – certain adjustments tend to perform more effectively on this shorter timeframe.
One frequently recommended set of parameters is 24, 52, 18. Let’s examine why these numbers can be more advantageous for traders focused on the 5-minute chart.
- 24-period Fast EMA: This shorter period makes the MACD line more sensitive to recent price changes, enabling it to react more swiftly to emerging momentum shifts on the 5-minute chart. This responsiveness is key to capturing fleeting opportunities.
- 52-period Slow EMA: While still representing a longer-term trend, this period is shorter than the default 26, making it more attuned to the intermediate-term movements within the 5-minute timeframe. This helps in identifying the underlying direction amidst the short-term noise.
- 18-period Signal Line EMA: A longer signal line period helps to smooth out some of the inherent noise and reduce the occurrence of false signals compared to the default 9-period setting. This can lead to more reliable trading signals.
Another popular alternative that many short-term traders find effective is 8, 17, 9. This particular set of parameters offers an even more responsive MACD, which can be beneficial for scalping strategies.
- 8-period Fast EMA: This very short period makes the MACD exceptionally sensitive to even the smallest fluctuations in price. This heightened sensitivity allows traders to potentially capitalize on very short-term price movements.
- 17-period Slow EMA: This shorter slow EMA further enhances the responsiveness of the MACD, allowing it to react quickly to changes in momentum.
- 9-period Signal Line EMA: Keeping the signal line at the default setting maintains a balance between responsiveness and filtering out some of the market’s inherent noise.
Why These Settings May Be Better
The reason these adjustments often prove more effective lies in their increased sensitivity to recent price action. By shortening the periods for the EMAs, you are essentially instructing the MACD to pay closer attention to the most recent price movements. This heightened sensitivity allows it to identify potential trading opportunities earlier compared to the default settings. However, it’s crucial to remember that increased sensitivity can also lead to a higher frequency of false signals. Therefore, integrating the MACD with other technical indicators and employing robust risk management strategies is of paramount importance when utilizing these more responsive settings for the best MACD settings for 5 minutes chart trading.
Don’t hesitate to experiment with slightly different variations of these settings to find what resonates best with your individual trading style and the specific assets you are trading. For instance, you might explore settings like 9, 18, 9 or even 10, 20, 10. The key is to discover the settings that align perfectly with your trading approach and the unique characteristics of the instruments you trade.
Read More: MACD Indicator in Forex Trading
Optimizing MACD Parameters for 5-Minute Timeframe
Determining the optimal MACD settings for 5-minute chart trading isn’t a one-time decision; it’s an ongoing process of observation, analysis, and refinement. Several key factors should influence your choices when seeking the best MACD parameters for 5-minute timeframe trading.
- Market Volatility: During periods of heightened market volatility, you might find it beneficial to use slightly longer periods for your MACD settings. This can help to filter out some of the excessive noise and reduce the occurrence of false signals that are common in volatile conditions. Conversely, in markets with lower volatility, you might opt for shorter periods to capture smaller price movements more effectively.
- Trading Style: Your individual trading style plays a significant role in determining the most suitable MACD settings. Scalpers, who aim to profit from very small price changes over very short periods, might prefer more sensitive settings like 8, 17, 9. Day traders, who typically hold positions for longer durations within the trading day, might find settings like 24, 52, 18 to be more appropriate for their approach.
- Asset Being Traded: Different assets exhibit varying degrees of volatility and price action characteristics. What works exceptionally well for a highly volatile cryptocurrency might not be the ideal choice for a more stable currency pair. Therefore, it’s essential to consider the specific characteristics of the asset you are trading when optimizing your MACD settings.
Customizing MACD on Trading Platforms
Here’s a step-by-step guide on how to customize your MACD settings on popular trading platforms:
MetaTrader 4/5:
- Open the chart of the specific asset you wish to analyze.
- Click on “Insert” located in the top menu.
- Select “Indicators,” then navigate to “Oscillators,” and choose “MACD.”
- A window will appear, allowing you to adjust the “Fast EMA,” “Slow EMA,” and “MACD SMA” (which represents the signal line).
- Enter your desired settings in the respective fields and click “OK.”
TradingView:
- Open the chart of the asset you intend to analyze.
- Click on “Indicators” situated at the top of the chart interface.
- Search for “MACD” in the search bar and select it from the results.
- Hover your mouse over the MACD indicator displayed on your chart and click on the “Settings/Format” icon (usually represented by a gear symbol).
- In the “Inputs” tab, you can modify the “Length” for both the fast and slow EMAs, as well as the “Source” for the signal line.
- Enter your preferred settings in the designated fields and click “OK” to apply the changes.
Remember, the ultimate objective is to identify settings that provide timely and reliable trading signals without generating an excessive number of false positives. Don’t be afraid to experiment with different values and meticulously track the performance of various settings over a period of time to determine what works best for you.
Strategies for Using MACD on 5-Minute Charts
Once you have determined your preferred top MACD settings for 5-minute scalping or day trading, you can begin to implement various trading strategies to potentially capitalize on market movements.
- MACD Line and Signal Line Crossovers: This is arguably the most fundamental and widely used MACD trading strategy.
- Bullish Signal: When the MACD line crosses above the signal line, it suggests that upward momentum is increasing and can be interpreted as a potential buy signal.
- Bearish Signal: Conversely, when the MACD line crosses below the signal line, it indicates that downward momentum is gaining strength and can be considered a potential sell signal.
- Zero Line Crossovers: The zero line on the MACD indicator represents the point at which the fast EMA and the slow EMA are equal.
- Bullish Signal: When the MACD line crosses above the zero line, it serves as a confirmation of bullish momentum in the market.
- Bearish Signal: Conversely, when the MACD line crosses below the zero line, it confirms the presence of bearish momentum.
- Divergence: Divergence occurs when the price action of an asset and the MACD indicator move in opposing directions, potentially signaling a future trend reversal.
- Bullish Divergence: This occurs when the price of an asset is making lower lows, but the MACD indicator is simultaneously making higher lows. This divergence can be an early indication of a potential reversal to the upside.
- Bearish Divergence: Conversely, bearish divergence occurs when the price of an asset is making higher highs, but the MACD indicator is making lower highs. This can signal a potential reversal to the downside.
Combining MACD with Other Indicators
To enhance the reliability of your trading signals and potentially improve your win rate, consider utilizing the MACD in conjunction with other technical indicators. This confluence of signals can provide a more robust basis for your trading decisions.
- Relative Strength Index (RSI): Use the RSI to confirm whether an asset is potentially overbought or oversold. For example, a bullish MACD crossover occurring in conjunction with an oversold RSI reading can provide a stronger buy signal, suggesting a higher probability of a successful trade.
- Moving Averages: Employ moving averages to gain a clearer understanding of the overall trend direction in the market. Look for MACD signals that align with the prevailing trend as identified by the moving averages. For instance, if the overall trend is upward, prioritize bullish MACD signals.
- Price Action Patterns: Combine MACD signals with recognizable candlestick patterns or chart patterns to identify high-probability trading setups. For instance, a bullish MACD crossover occurring at a key support level within a double bottom chart pattern can present a compelling buying opportunity.
If you truly master these strategies, you’ll be well on your way to confidently navigating the intricacies of the 5-minute chart!
Read More: Best ema settings for 5 minute chart
Avoiding Common Mistakes with MACD on 5-Minute Charts
Even when utilizing the best macd settings for 5 min chart, traders can sometimes fall prey to common mistakes that can hinder their profitability. Awareness of these pitfalls is crucial for effective MACD utilization.
- Over-reliance on MACD: While the MACD is undoubtedly a valuable tool in a trader’s arsenal, it should not be the sole determinant of your trading decisions. Always consider other factors such as price action analysis, key support and resistance levels, and the broader market context before entering a trade.
- Ignoring Market Context and Volatility: As previously emphasized, prevailing market conditions have a significant impact on the effectiveness of MACD signals. Be particularly mindful of upcoming news events and periods of heightened volatility, as these can lead to erratic price movements and an increased number of false signals. Adjust your expectations and risk management accordingly during such times.
- Chasing Every Crossover: It’s crucial to understand that not every MACD crossover represents a valid trading opportunity, especially on the inherently noisy 5-minute chart. Develop a system for filtering your signals based on confluence with other indicators, price action analysis, and your overall trading plan to avoid unnecessary trades.
- Failing to Use Stop-Loss Orders: Regardless of how confident you might feel about a particular MACD signal, consistently using stop-loss orders is absolutely essential for effective risk management. The rapid price fluctuations characteristic of the 5-minute chart necessitate disciplined risk control to protect your capital.
- Not Backtesting Your Settings: Before implementing any new MACD settings or trading strategies with real capital, it’s imperative to thoroughly backtest them on historical data. This process allows you to assess their historical effectiveness and identify any potential weaknesses or areas for improvement before risking your hard-earned money.
Don’t allow the fear of missing out (FOMO) to cloud your judgment and drive your trading decisions based solely on a single MACD signal. Cultivating patience and discipline are paramount for achieving consistent success in trading.
The Importance of Backtesting MACD Settings
The significance of backtesting cannot be overstated when it comes to refining your trading strategies. Backtesting is the process of applying your chosen best MACD settings for 5 minutes chart and associated trading strategies to historical price data to rigorously evaluate their performance over time.
Benefits of Backtesting
- Assess Profitability: Backtesting allows you to determine whether your chosen MACD settings and trading strategies have historically generated profits under various market conditions. This provides valuable insights into the potential profitability of your approach.
- Identify Drawdowns: Understanding the potential maximum losses, or drawdowns, that your strategy might experience is crucial for effective risk management. Backtesting helps you quantify these potential drawdowns, allowing you to prepare accordingly.
- Optimize Settings: Through backtesting, you can fine-tune your MACD parameters and strategy rules to potentially improve their performance. By analyzing the results of different settings on historical data, you can identify the most effective configurations.
- Gain Confidence: Thorough backtesting can significantly boost your confidence in your trading system before you risk real capital. Seeing positive results on historical data can provide the reassurance you need to trade with conviction.
Tools for Effective Backtesting
- Trading Platform Backtesting Tools: Many popular trading platforms, such as MetaTrader and TradingView, offer built-in backtesting capabilities. These tools allow you to define your entry and exit rules based on MACD signals and simulate their performance on historical data.
- Spreadsheet Analysis: While more time-consuming, manually analyzing historical charts and recording the outcomes of hypothetical trades based on your MACD strategy can provide a deeper understanding of the nuances of your approach.
- Dedicated Backtesting Software: For more advanced analysis, dedicated backtesting software solutions offer sophisticated features, allowing for more complex simulations and detailed performance analysis.
Key Considerations for Backtesting
- Sufficient Data: To obtain a reliable assessment of your strategy’s performance, it’s essential to use a substantial amount of historical data for your backtesting. The more data you analyze, the more statistically significant your results will be.
- Realistic Conditions: When backtesting, be sure to account for real-world trading costs such as spreads, commissions, and potential slippage to get a more accurate picture of your potential profits and losses.
- Walk-Forward Analysis: To ensure the robustness of your strategy, consider performing walk-forward analysis. This involves testing your strategy on different, non-overlapping periods of historical data to confirm that it’s not simply over-optimized for a specific market environment.
Opofinance Services
Are you searching for a dependable and regulated broker for forex trading to implement your carefully crafted MACD strategies? Consider Opofinance, a reputable ASIC-regulated broker dedicated to providing a secure and efficient trading environment for its clients.
- ASIC Regulated: Trade with confidence knowing that Opofinance adheres to the stringent regulatory standards set forth by the Australian Securities and Investments Commission (ASIC). This provides a layer of security and trust for traders.
- Officially Featured on MT5 Brokers List: Gain access to the powerful and widely acclaimed MetaTrader 5 platform, a favorite among experienced traders worldwide. Opofinance is officially recognized and featured on the MT5 brokers list, further solidifying its credibility.
- Safe and Convenient Deposits and Withdrawals: Enjoy peace of mind with a variety of secure and convenient methods for funding your trading account and withdrawing your profits. Opofinance prioritizes the safety and ease of financial transactions for its clients.
- Social Trading: Connect with and learn from other successful traders through Opofinance’s innovative social trading features. This allows you to potentially gain valuable insights into diverse MACD strategies and settings employed by experienced individuals.

Ready to elevate your trading experience to the next level? Visit opofinance.com today to discover more about their services and open a trading account.
Conclusion
Achieving mastery of the MACD indicator on the 5-minute chart requires dedication, consistent effort, and a willingness to experiment and adapt. By developing a thorough understanding of its underlying components, exploring a range of different settings, and diligently implementing effective trading strategies, you can significantly enhance your short-term trading endeavors and potentially improve your profitability. Remember to prioritize backtesting your approach on historical data and continuously adapt your strategies to the ever-changing dynamics of the market.
Key Takeaways
- The MACD is a valuable momentum indicator that can be particularly effective for short-term trading on the 5-minute chart.
- Default MACD settings (12, 26, 9) may not be ideally suited for the fast-paced nature of the 5-minute timeframe.
- Consider exploring alternative settings such as 24, 52, 18 or 8, 17, 9 for increased responsiveness to short-term price movements.
- Combining MACD signals with other technical indicators and price action analysis can lead to more robust and reliable trading signals.
- Thorough backtesting is an essential step in validating the effectiveness of your chosen MACD settings and trading strategies.
- Adaptability and a commitment to continuous learning are key attributes for long-term success when utilizing the MACD on the 5-minute chart.
Can I apply the same MACD settings across all currency pairs when trading on the 5-minute chart?
While certain MACD settings might exhibit good performance across a range of currency pairs, it’s generally advisable to optimize your MACD settings for each specific currency pair you intend to trade. Different currency pairs often exhibit varying levels of volatility and unique price action characteristics, which can influence the effectiveness of different MACD configurations.
How frequently should I consider adjusting my MACD settings when trading on the 5-minute chart?
There isn’t a fixed schedule for adjusting your MACD settings. However, it’s prudent to periodically review your settings, particularly if you observe a significant shift in market volatility or a noticeable decline in the performance of your current trading strategy. Consider re-optimizing your settings every few months or whenever there are substantial changes in overall market conditions.
Is it feasible to achieve consistent profitability by solely relying on the MACD indicator when trading on a 5-minute chart?
While the MACD is undoubtedly a valuable tool for identifying potential trading opportunities, relying exclusively on any single indicator is generally not recommended for achieving consistent profitability in the long run. Combining the MACD with other forms of technical analysis, such as price action interpretation, identification of key support and resistance levels, and even incorporating fundamental analysis, can significantly enhance the quality of your trading decisions and increase your probability of success.


