

Seeking the best RSI settings for 1 hour chart to refine your trading strategy? You’re in the right place. Traders across the globe utilize the Relative Strength Index (RSI) as a vital momentum indicator. However, the standard settings may not be optimized for the 1-hour timeframe, potentially hindering your profitability. The answer? For effective 1-hour chart analysis, consider RSI settings between 9 and 12 periods. This article reveals how to pinpoint optimal RSI settings for 1-hour chart trading, enhancing your market entries and exits.

Specifically tailored for the 1-hour timeframe, these refined settings empower you to make data-driven decisions and potentially amplify your trading success. Whether you are engaged in forex, stocks, or cryptocurrency trading, mastering rsi settings for 1 hour chart analysis is transformative. If you are in search of a dependable regulated forex broker to implement these powerful strategies, we will guide you.
This comprehensive guide is your definitive resource for understanding and applying the best RSI settings for 1-hour trading. We will explore the advantages of the 1-hour chart, dissect the shortcomings of default settings, and unveil the optimal RSI settings for 1-hour chart configurations that can revolutionize your technical analysis. Prepare to unlock enhanced precision and bolster your confidence in your trading endeavors. Let’s delve into harnessing the power of RSI on the 1-hour chart and discover the rsi settings for 1 hour chart that truly work.
Understanding RSI: Your Trading Momentum Meter
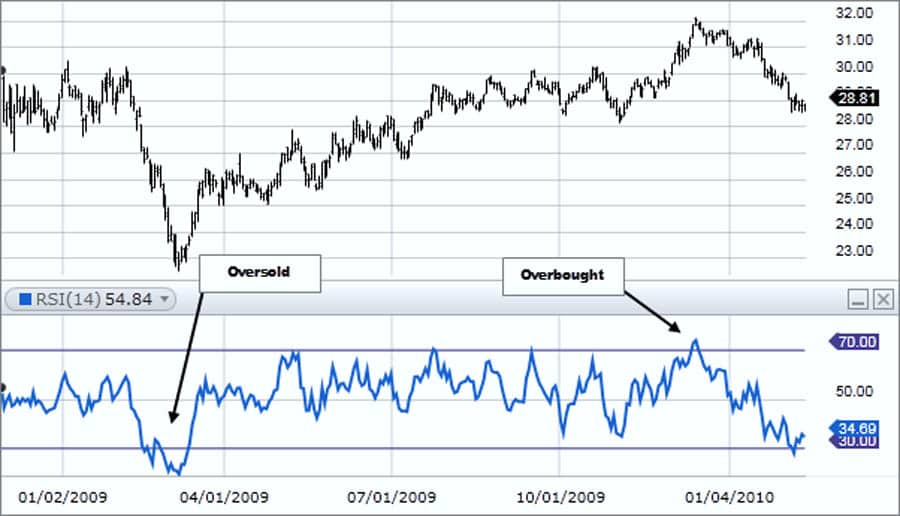
Imagine a tool that precisely measures market momentum – that’s the Relative Strength Index (RSI). Developed by J. Welles Wilder Jr., RSI is a momentum oscillator quantifying the velocity and magnitude of price fluctuations. It oscillates on a scale of 0 to 100, visually representing if an asset is overbought or oversold. Think of RSI as a speedometer for price action. When RSI surges above 70, it suggests an overbought condition, signaling a possible price decline. Conversely, dipping below 30 indicates an oversold state, hinting at a potential price increase. This straightforward yet potent indicator is a cornerstone of technical analysis for traders across diverse markets seeking rsi settings for 1 hour chart optimization.
Read More: 1-hour forex trading strategy
Why RSI is a Top Choice: The Momentum Indicator for Traders
Why is RSI so favored among traders? Several compelling attributes contribute to its enduring appeal as a key tool when considering rsi settings for 1 hour chart trading:
- Simplicity and Clarity: RSI is remarkably user-friendly. Its clear overbought and oversold thresholds provide unambiguous signals, making it accessible even for beginners exploring rsi settings for 1 hour chart.
- Versatility Across Markets: From the dynamic forex market to volatile cryptocurrencies and traditional stocks, RSI adapts seamlessly. Its broad applicability makes it invaluable across asset classes when determining best RSI settings for 1 hour chart.
- Early Warning Signals: RSI often provides advance warnings of potential trend reversals. Divergences between price action and RSI movements can signal weakening momentum and impending market shifts, crucial for effective rsi settings for 1 hour chart strategies.
- Confirmation Tool: Beyond generating signals, RSI robustly confirms other indicators and chart patterns. It validates breakouts, breakdowns, and trend continuations, enhancing the reliability of trading decisions based on optimal RSI settings for 1-hour chart.
- Customization Potential: While default settings are common, RSI is highly customizable. Traders can adjust the period length and overbought/oversold levels to match their trading style and asset characteristics, especially when seeking best RSI settings for 1-hour trading.
Timeframe Sensitivity: Adapting RSI Settings is Key
A critical insight: a universal approach is ineffective in trading, particularly with indicators. The best RSI settings for 1 hour chart differ from optimal RSI settings for 1-hour chart or daily charts. Timeframe choice significantly impacts indicator sensitivity and signal generation. Shorter timeframes, like the 1-hour chart, are more susceptible to market noise. Default RSI settings on a 1-hour chart may produce excessive false signals. Conversely, longer timeframes require different RSI settings to capture broader trends. Understanding timeframe-specific RSI settings is paramount. Choosing the right rsi settings for 1 hour chart is about aligning your indicator with the market’s rhythm.
The 1-Hour Chart: A Balanced Trading Timeframe
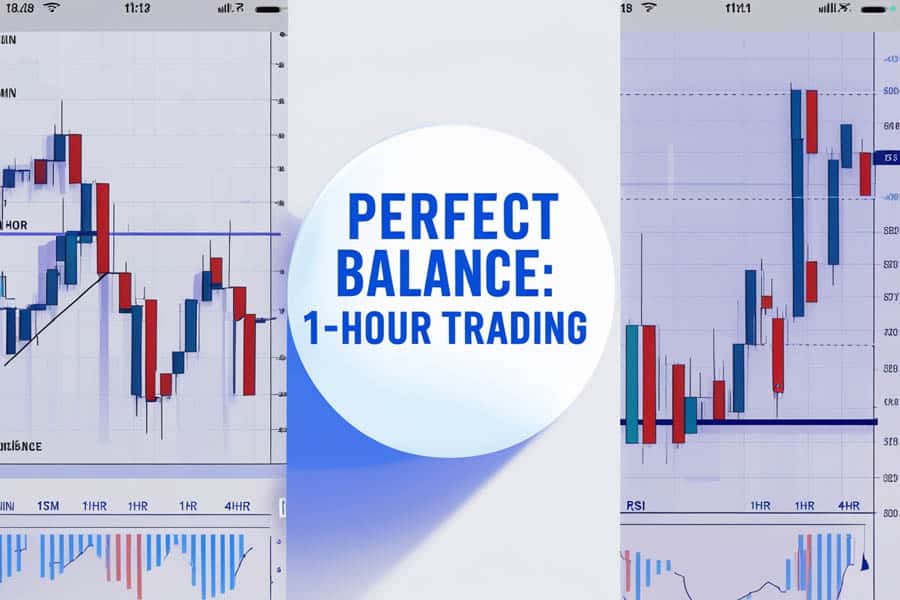
The 1-hour chart occupies a balanced position in trading timeframes. It’s neither overly noisy nor excessively slow, offering a balanced perspective appealing to many traders seeking best RSI settings for 1 hour chart. Here’s why the 1-hour chart is often considered optimal:
- Reduced Noise, Enhanced Clarity: Compared to 15-minute or 5-minute charts, the 1-hour chart filters intraday noise. This cleaner data allows clearer trend and pattern identification, leading to more reliable signals when using rsi settings for 1 hour chart.
- Sufficient Trading Opportunities: Unlike daily or weekly charts, the 1-hour chart provides ample trading opportunities. It balances intraday movements and avoids hyper-activity, ideal for applying optimal RSI settings for 1-hour chart.
- Suitable for Various Trading Styles: Whether day trader, swing trader, or shorter-term position trader, the 1-hour chart adapts. It offers enough price action for day trading and reveals swing trading opportunities, making best RSI settings for 1-hour trading versatile.
- Better Risk Management: The 1-hour chart allows tighter stop-loss placement than longer timeframes, improving risk-reward ratios and capital protection when using rsi settings for 1 hour chart.
- Global Market Coverage: For global market monitoring, the 1-hour chart provides consistency across time zones. It allows price action analysis without minute-to-minute overwhelm, crucial for effective rsi settings for 1 hour chart application.
Balancing Noise and Trend Clarity on the 1-Hour Chart
The 1-hour chart’s strength is its balance between noise reduction and trend clarity. Shorter timeframes are prone to whipsaws and false signals. Longer timeframes can be slow to react to opportunities. The 1-hour chart filters intraday “chatter” while capturing meaningful price movements. This balance is crucial for effective RSI use. With less noise, RSI signals on a 1-hour chart are more reliable. Identify overbought/oversold conditions and divergences with greater confidence using optimal RSI settings for 1-hour chart.
Timeframe Comparison: 1-Hour vs. 15-Minute, 4-Hour, Daily
Comparing the 1-hour chart to other timeframes highlights its advantages for rsi settings for 1 hour chart:
- 15-Minute Chart: Highly sensitive to noise, false signals, best for scalping, requires rapid decisions. RSI settings differ significantly from 1-hour.
- 4-Hour Chart: Broader perspective, less noisy, suitable for swing trading, medium-term trends, less frequent but significant signals. RSI settings differ, typically longer periods.
- Daily Chart: Long-term perspective, minimal noise, ideal for position trading, long-term trends, infrequent but highly significant signals. Daily chart RSI settings are usually default or longer.
The 1-hour chart offers a blend of responsiveness and reliability, versatile for many strategies. It’s a timeframe where best RSI settings for 1-hour trading provide timely, accurate signals for informed decisions.
Default RSI Settings: Limitations on the 1-Hour Chart
The 14-Period RSI: A Common Starting Point
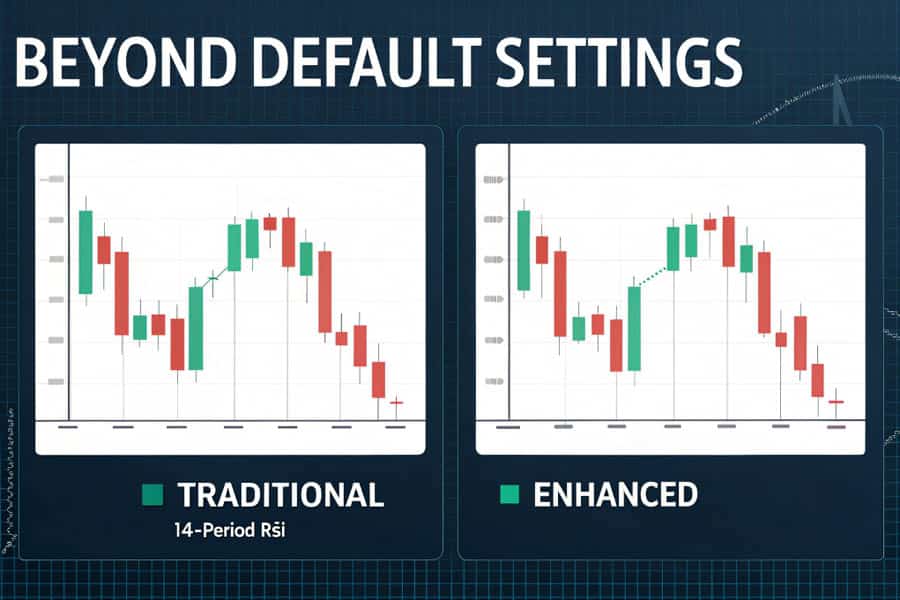
The default 14-period RSI setting is prevalent across trading platforms. It’s often presented as universally applicable. But is it truly optimal, especially for the 1-hour chart? The 14-period RSI calculates average gains and losses over 14 periods (14 hours on a 1-hour chart). Designed for daily charts by Wilder, it aims to capture medium-term momentum. While valuable, its suitability for the faster 1-hour chart is questionable when seeking best RSI settings for 1 hour chart.
14-Period RSI on 1-Hour: Potential Drawbacks
Using the default 14-period RSI on a 1-hour chart can present challenges when trying to find optimal RSI settings for 1-hour chart:
- Lagging Signals: The 14-period RSI, being slower, can lag price action on the 1-hour chart. This delay can result in late entries and exits, missing opportunities or entering trades too late when using standard rsi settings for 1 hour chart.
- Whipsaws and False Signals: While the 1-hour chart reduces noise, it’s still dynamic. The 14-period RSI might still generate whipsaws in choppy markets, leading to ineffective signals when relying on default rsi settings for 1 hour chart.
- Missed Short-Term Opportunities: The 14-period RSI might be too slow for short-term momentum bursts on the 1-hour chart. Traders capitalizing on these movements might find it unresponsive with standard rsi settings for 1 hour chart.
- Over-Smoothed Data: The 14-period average can over-smooth price data on the 1-hour chart, masking short-term fluctuations and momentum nuances, hindering effective use of rsi settings for 1 hour chart.
Trader Frustrations: Default Settings on 1-Hour Charts
Many traders using default 14-period RSI on 1-hour charts experience frustrations when trying to find best RSI settings for 1-hour trading:
- “RSI is always lagging!” Common complaint, especially in fast markets. Signals feel too late to be actionable with default rsi settings for 1 hour chart.
- “Too many false signals!” In choppy markets, 14-period RSI can generate numerous ineffective signals, leading to frustration and losses when using standard rsi settings for 1 hour chart.
- “Missed the move!” Price action moves rapidly, but 14-period RSI is sluggish, failing to provide timely entry signals, causing missed profits with default rsi settings for 1 hour chart.
- “RSI doesn’t seem to work on 1-hour!” Drastic conclusion, reflecting disappointment when default RSI settings underperform on the 1-hour chart, highlighting the need for optimal RSI settings for 1-hour chart.
These frustrations emphasize moving beyond default settings and exploring best RSI settings for 1 hour chart tailored to this timeframe. It’s time to unlock RSI’s potential on the 1-hour chart by fine-tuning settings.
Read More: What is RSI Indicator
Optimal RSI Settings for 1-Hour Chart: Precision Adjustments
Shorter Period Advantage: 9, 10, or 12 for 1-Hour Charts
To overcome 14-period RSI limitations on the 1-hour chart, experienced traders often recommend shorter RSI periods as best RSI settings for 1 hour chart. Settings like 9, 10, or 12 periods are frequently cited as optimal RSI settings for 1-hour chart analysis. Why these shorter periods?
- Increased Responsiveness: Shorter RSI periods react faster to price changes. This heightened sensitivity captures short-term momentum shifts on the 1-hour chart more effectively, crucial for rsi settings for 1 hour chart.
- Timelier Signals: With shorter periods, RSI signals (overbought/oversold, divergences) are generated earlier, providing timelier entries and exits. This is crucial in the dynamic 1-hour timeframe when using best RSI settings for 1-hour trading.
- Reduced Lag: Shorter RSI periods exhibit less lag than the 14-period default. This reduced lag helps stay in sync with market rhythm and react promptly to trends when using optimal RSI settings for 1-hour chart.
- Capturing Intraday Swings: The 1-hour chart often presents intraday swing trading opportunities. Shorter RSI settings are better equipped to capitalize on these shorter-term price swings, making them best RSI settings for 1-hour chart for swing traders.
While 9, 10, and 12 are popular, the “best” setting varies slightly. Experimentation within this range is encouraged to find your personal optimal RSI settings for 1-hour chart trading.
Fine-Tuning for Accuracy: Adapting RSI to the 1-Hour Pace
Adjusting the RSI period is the primary way to fine-tune it for the 1-hour chart to achieve best RSI settings for 1 hour chart. However, other adjustments can further enhance accuracy:
- Overbought/Oversold Levels: While 70 and 30 are standard, adjust them based on asset volatility and risk tolerance. For volatile assets, widen the range (e.g., 80 and 20) to reduce false signals. For less volatile assets, tighten the range (e.g., 65 and 35) to increase sensitivity when using optimal RSI settings for 1-hour chart.
- Smoothing Type: Some platforms offer different RSI smoothing types (SMA, EMA). Experimenting with smoothing might slightly alter RSI responsiveness and smoothness when seeking best RSI settings for 1-hour trading.
- Confirmation with Price Action: Always confirm RSI signals with price action analysis, regardless of settings. Look for candlestick patterns, chart patterns, and support/resistance to validate RSI signals and increase trade probability when using rsi settings for 1 hour chart.
Period Comparison: 9, 10, and 12 RSI Settings
Comparing pros and cons of shorter RSI periods for the 1-hour chart helps determine best RSI settings for 1 hour chart:
- 9-Period RSI:
- Pros: Most responsive, earliest signals, best for very short-term momentum, ideal for capturing quick moves with rsi settings for 1 hour chart.
- Cons: Most sensitive to noise, highest false signal potential, requires careful filtering and confirmation when using these rsi settings for 1 hour chart.
- 10-Period RSI:
- Pros: Good balance of responsiveness and noise reduction, timely signals, suitable for short to medium-term momentum, a balanced choice for optimal RSI settings for 1-hour chart.
- Cons: Slightly more lag than 9-period, may still generate some false signals in choppy markets when using these rsi settings for 1 hour chart.
- 12-Period RSI:
- Pros: More noise reduction than 9 and 10-period, smoother signals, better for slightly longer-term momentum shifts, a smoother option for best RSI settings for 1-hour trading.
- Cons: Less responsive than 9 and 10-period, slightly more lag, might miss some very short-term opportunities when using these rsi settings for 1 hour chart.
The choice between 9, 10, and 12 depends on trading style and risk tolerance. For responsive signals and noise filtering, 9 or 10 might be best RSI settings for 1-hour trading. For noise reduction and smoother signals, 12 might be better. Test and find what works best for you to determine your optimal RSI settings for 1-hour chart.
Using RSI on a 1-Hour Chart: Practical Strategies
Overbought/Oversold Zones: Classic RSI Signals
The most basic RSI use is identifying overbought and oversold conditions. On a 1-hour chart with optimized settings (e.g., 9, 10, or 12 periods), these signals can be effective when using best RSI settings for 1 hour chart:
- Overbought (RSI above 70): RSI above 70 suggests an overbought asset, potentially due for a pullback. Signal to look for shorts or take profits on longs when using optimal RSI settings for 1-hour chart. Overbought doesn’t mean immediate reversal; uptrends can remain overbought.
- Oversold (RSI below 30): RSI below 30 indicates an oversold asset, poised for a rebound. Signal to look for longs or take profits on shorts when using best RSI settings for 1-hour trading. Oversold doesn’t guarantee immediate reversal; downtrends can remain oversold.
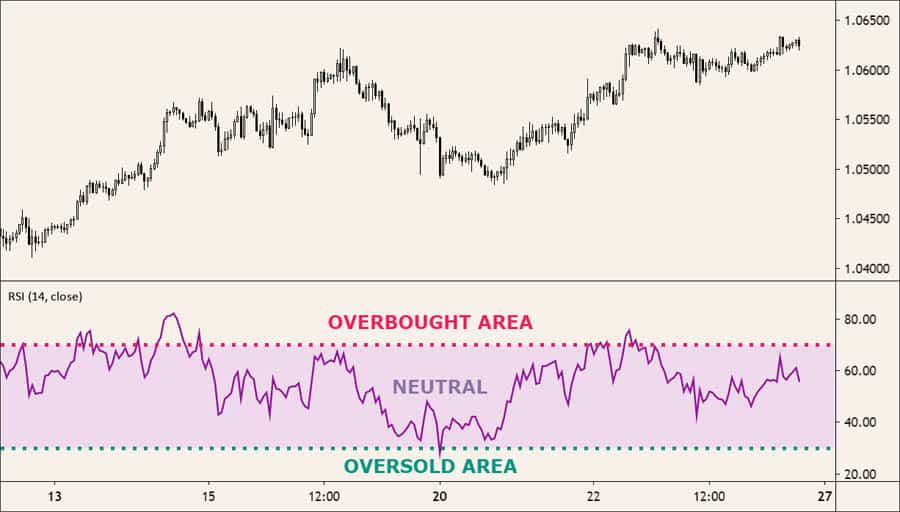
Don’t blindly trade solely on overbought/oversold signals. Consider market context, trend direction, and confirm signals with price action and other indicators when using rsi settings for 1 hour chart. Overbought/oversold levels are more effective in ranging markets than trending markets.
Read More: Best EMA Settings for 1 Hour Chart
Divergence Power: Spotting Trend Reversals Early
RSI divergence is powerful for identifying potential trend reversals when using optimal RSI settings for 1-hour chart. It occurs when price action and RSI move oppositely, signaling weakening momentum:
- Bullish Divergence: Price makes lower lows, but RSI makes higher lows. Indicates weakening selling momentum, potential uptrend reversal. Look for longs when bullish divergence occurs with best RSI settings for 1-hour trading.
- Bearish Divergence: Price makes higher highs, but RSI makes lower highs. Suggests waning buying momentum, potential downtrend reversal. Look for shorts when bearish divergence is detected with rsi settings for 1 hour chart.
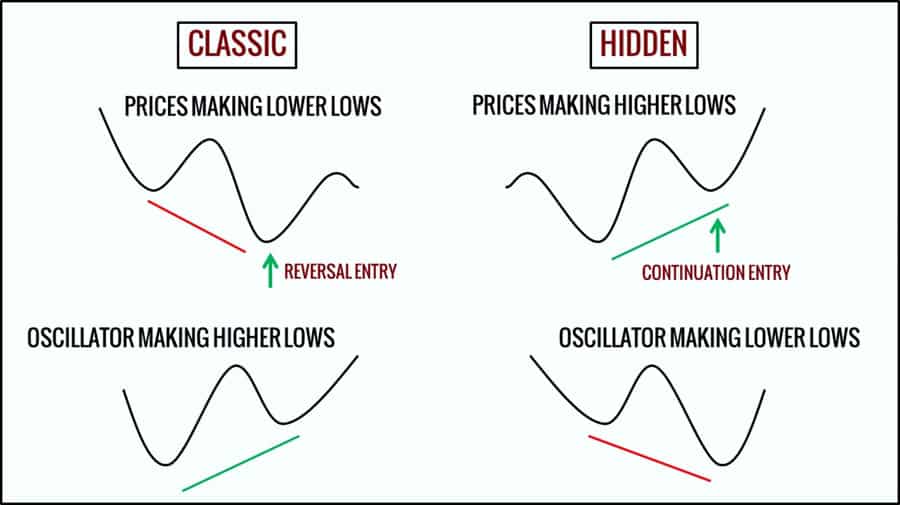
Divergence is a leading indicator, signaling potential reversals early. However, it’s not always accurate. Confirm divergence signals with price action (candlestick reversals, trendline breaks) and other indicators to increase reliability when using optimal RSI settings for 1-hour chart.
RSI and Moving Averages: A Synergistic Combination
Combining RSI with moving averages creates a robust strategy on the 1-hour chart when using best RSI settings for 1 hour chart. Moving averages identify trend, RSI provides momentum signals:
- Uptrend Strategy: Price above moving average (e.g., 20-period EMA) indicates uptrend. Use RSI oversold signals (below 30) as long entry points. Wait for RSI to dip oversold then reverse up, signaling a buy within the uptrend when using optimal RSI settings for 1-hour chart.
- Downtrend Strategy: Price below moving average indicates downtrend. Use RSI overbought signals (above 70) as short entry points. Wait for RSI to rise overbought then reverse down, signaling a sell within the downtrend when using best RSI settings for 1-hour trading.
Experiment with different moving average periods (e.g., 20, 50, 100 EMA/SMA) to find what aligns best with your style and asset. Moving averages filter noise from RSI signals and provide trend context when using rsi settings for 1 hour chart.
RSI and MACD: Double Momentum Confirmation
Combining RSI with MACD (Moving Average Convergence Divergence) provides double confirmation and enhances signal reliability on the 1-hour chart when using optimal RSI settings for 1-hour chart.
- Long Entry Confirmation: Look for RSI oversold signals (below 30) and MACD bullish crossovers (MACD line crossing above signal line) occurring together. This confluence strengthens the bullish case for longs when using best RSI settings for 1-hour trading.
- Short Entry Confirmation: Look for RSI overbought signals (above 70) and MACD bearish crossovers (MACD line crossing below signal line) occurring together. This confluence reinforces the bearish outlook for shorts when using rsi settings for 1 hour chart.
Using two momentum indicators like RSI and MACD can reduce false signals and improve trade quality. However, it can also reduce trading frequency. Balance signal quality with trading frequency based on your preferences when using optimal RSI settings for 1-hour chart.
Backtesting RSI Settings for 1-Hour Charts: Validation is Key
Why Backtesting is Essential: Validate Before Live Trading

Before using any RSI settings or strategy live, backtesting is crucial. Backtesting applies your RSI settings and rules to historical price data to simulate past performance. Why is backtesting so important for best RSI settings for 1 hour chart?
- Performance Validation: Backtesting provides evidence of historical performance. It assesses profitability, win rate, drawdown, and key metrics of your optimal RSI settings for 1-hour chart.
- Setting Optimization: Backtesting allows experimenting with RSI periods, levels, and rules to identify best RSI settings for 1-hour trading that maximize strategy performance.
- Risk Assessment: Backtesting helps understand strategy risks, like maximum drawdown and losing streaks. This is crucial for risk management and position sizing when using rsi settings for 1 hour chart.
- Confidence Building: Positive backtesting results boost confidence in your RSI settings and strategy, making live trade execution easier when using optimal RSI settings for 1-hour chart.
- Strategy Refinement: Backtesting reveals strategy weaknesses. Use results to refine rules, adjust parameters, and enhance effectiveness of your best RSI settings for 1-hour trading.
Backtesting Tools: Platforms for RSI Strategy Testing
Numerous tools are available for backtesting RSI strategies to find optimal RSI settings for 1-hour chart:
- TradingView: TradingView’s Pine Script allows coding and backtesting custom RSI strategies directly on charts. Strategy Tester provides performance reports and visual backtesting for best RSI settings for 1-hour trading.
- MetaTrader 5 (MT5): MT5’s Strategy Tester backtests EAs and custom indicators, including RSI strategies. It offers robust backtesting and analytics for rsi settings for 1 hour chart.
- Thinkorswim (TD Ameritrade): Thinkorswim’s ThinkScript creates and backtests complex strategies, including RSI-based ones. Their backtesting tools are comprehensive for optimal RSI settings for 1-hour chart.
- Python with Libraries (Backtrader, Zipline): For advanced backtesting, Python libraries like Backtrader and Zipline offer frameworks for developing and backtesting sophisticated RSI strategies to find best RSI settings for 1-hour trading.
Interpreting Backtesting Results: Key Metrics to Analyze
When analyzing backtesting results for rsi settings for 1 hour chart, focus on these metrics:
- Net Profit: Total profit over the backtesting period. Higher is generally better, but consider drawdown and risk when using optimal RSI settings for 1-hour chart.
- Win Rate: Percentage of winning trades. Higher win rate is desirable, but not the only factor. Lower win rate with higher average win size can still be profitable with best RSI settings for 1-hour trading.
- Profit Factor: Ratio of gross profit to gross loss. Above 1 indicates profitability. Higher profit factors are better when using rsi settings for 1 hour chart.
- Maximum Drawdown: Largest capital decline during backtesting. Lower drawdown is preferable, indicating lower risk when using optimal RSI settings for 1-hour chart.
- Average Trade: Average profit/loss per trade. Positive average trade is essential for long-term profitability with best RSI settings for 1-hour trading.
- Sharpe Ratio: Risk-adjusted return metric. Higher Sharpe ratios are better, indicating better risk-adjusted performance of your rsi settings for 1 hour chart.
Don’t solely optimize for highest net profit in backtesting. Consider risk metrics like drawdown and Sharpe ratio when choosing optimal RSI settings for 1-hour chart. Lower profit but lower drawdown might be more robust. Backtest over long periods and different market conditions to ensure robustness of your best RSI settings for 1-hour trading.
Opofinance: Your Reliable Forex Broker
Looking for a regulated forex broker to implement your RSI strategies effectively? Consider Opofinance, an ASIC-regulated broker dedicated to a secure and efficient trading environment.
- ASIC Regulation: Trade confidently with Opofinance, regulated by ASIC, ensuring high operational standards and client protection.
- MT5 Platform: Access MetaTrader 5 (MT5), known for advanced charting, indicators, and automated trading – perfect for your best RSI settings for 1-hour trading. Opofinance is officially listed on the MT5 brokers list.
- Social Trading: Utilize Opofinance’s social trading to learn from experienced traders, copy strategies, and enhance your trading knowledge.
- Safe Deposits & Withdrawals: Enjoy secure and convenient deposit and withdrawal methods. Opofinance prioritizes fund safety and offers various options for efficient capital management.

Ready to enhance your trading? Visit opofinance.com today and see how Opofinance can empower your trading journey.
Conclusion
Mastering the best RSI settings for 1 hour chart is a process of refinement. While the 14-period RSI is a starting point, shorter periods like 9, 10, or 12 enhance responsiveness on the 1-hour timeframe. No single setting is universally perfect. Optimal RSI settings for 1-hour chart align with your trading style, assets, and market conditions. Backtesting is crucial for validation and improvement. Avoid using RSI in isolation, ignoring higher timeframes, and neglecting volatility. Adapt your RSI approach to market dynamics for precision trading.
Key Takeaways: Best RSI Settings for 1 Hour Chart
- Optimal RSI Range: For 1-hour charts, RSI settings of 9, 10, or 12 periods often outperform the default 14.
- Shorter Periods for Responsiveness: Shorter RSI periods (9-12) are more responsive to 1-hour chart price action, providing timelier signals.
- Backtest for Validation: Always backtest your chosen RSI settings and strategies on historical data before live trading.
- Context is Key: Use RSI in conjunction with price action analysis, trend identification, and support/resistance levels.
- Adapt to Market Conditions: Adjust RSI settings based on market volatility and whether the market is trending or ranging.
- Asset-Specific Optimization: Consider fine-tuning RSI settings for different asset classes like forex, stocks, and cryptocurrencies.
Can I use the same RSI settings for all currency pairs in forex trading?
While RSI settings of 9-12 periods are generally effective for 1-hour forex charts, some currency pairs may exhibit unique volatility characteristics. It’s advisable to backtest and slightly adjust RSI settings for specific currency pairs to optimize performance. For example, more volatile pairs might benefit from slightly wider overbought/oversold levels.
How frequently should I adjust my RSI settings for the 1-hour chart?
You don’t need to constantly adjust your RSI settings. However, periodically reviewing and re-backtesting your settings, especially when market volatility or characteristics change significantly, is a good practice. Major market shifts or changes in the asset’s behavior might warrant a re-evaluation of your optimal RSI settings for 1-hour chart.
Is RSI alone sufficient for a profitable trading strategy on the 1-hour chart?
While RSI is a powerful indicator, relying solely on RSI for trading decisions is not recommended. For a robust and profitable strategy on the 1-hour chart, combine RSI with other technical analysis tools and concepts. Price action analysis, trend identification using moving averages, and support/resistance levels are crucial complements to RSI for enhanced signal accuracy and trade probability when using best RSI settings for 1-hour trading.


