In the fast-paced world of trading, finding the right strategy can mean the difference between success and failure. One of the most effective combinations in technical analysis is the pairing of Bollinger Bands with the Relative Strength Index (RSI). This powerful duo provides valuable insights into market trends and potential reversals, helping traders fine-tune their entry and exit points. Whether you’re a beginner or an advanced trader, this article will show you how to harness the power of the Bollinger Bands and RSI strategy to improve your trading performance.

Introduction: Mastering Bollinger Bands and RSI Strategy
Are you looking to enhance your trading strategies and maximize profits? The combination of Bollinger Bands and RSI could be the key to unlocking more accurate trades. Bollinger Bands help traders identify price volatility and potential price reversals, while RSI signals overbought or oversold conditions, giving you a clearer understanding of market momentum. Together, they create a powerful system for both trend-following and reversal trading.
In this guide, you’ll learn how to use Bollinger Bands with RSI, understand their unique characteristics, and discover how they work together to boost trading accuracy. Whether you’re using a regulated forex broker, or seeking an online forex broker for your trading needs, this guide is designed to provide practical insights and expert tips to take your trading to the next level.
What Are Bollinger Bands and RSI?
Before diving into the combined strategy, it’s essential to fully understand each of these technical indicators.
What Are Bollinger Bands?
Bollinger Bands were developed by John Bollinger in the early 1980s as a tool for measuring price volatility. The bands consist of three lines plotted on a price chart:
- The middle line: This is typically a 20-period Simple Moving Average (SMA), representing the average price over a specific period.
- The upper band: Positioned two standard deviations above the middle line, it shows the upper limit of normal price movements.
- The lower band: Positioned two standard deviations below the middle line, it shows the lower limit of normal price movements.
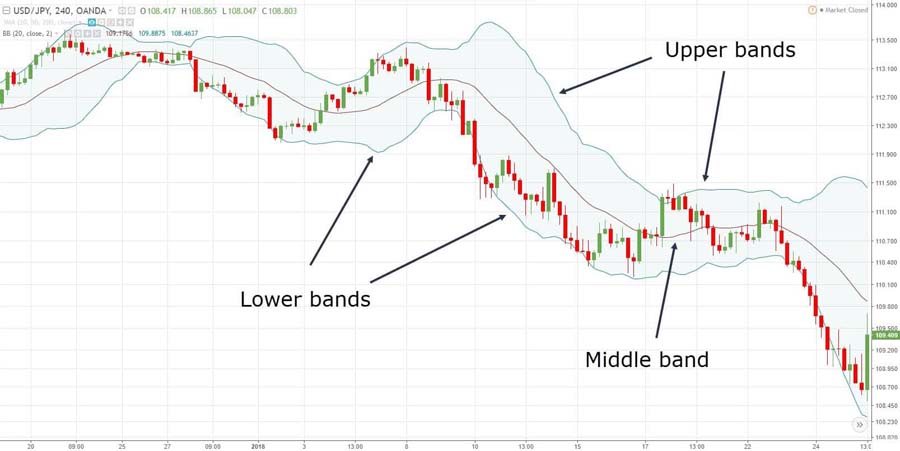
The key idea behind Bollinger Bands is that they expand and contract with volatility. During periods of high volatility, the bands widen, signaling potential breakout opportunities. Conversely, during low volatility, the bands contract, suggesting consolidation periods.
Key Takeaways of Bollinger Bands:
- Price Touching the Upper Band: This signals potential overbought conditions, and traders may look for selling opportunities.
- Price Touching the Lower Band: This suggests potential oversold conditions, signaling possible buying opportunities.
- Squeezes: When the bands tighten, it often indicates a forthcoming breakout, but the direction is uncertain until confirmed by other indicators like RSI.
Read More: ichimoku cloud swing trading strategy
What is the Relative Strength Index (RSI)?
RSI is a momentum oscillator developed by J. Welles Wilder in 1978. It measures the speed and change of price movements and oscillates between 0 and 100. RSI is used to assess whether an asset is overbought or oversold, helping traders spot potential reversal points.
- RSI above 70: Indicates that the asset might be overbought, suggesting a potential for a price reversal downward.
- RSI below 30: Indicates that the asset might be oversold, suggesting a potential for a price reversal upward.
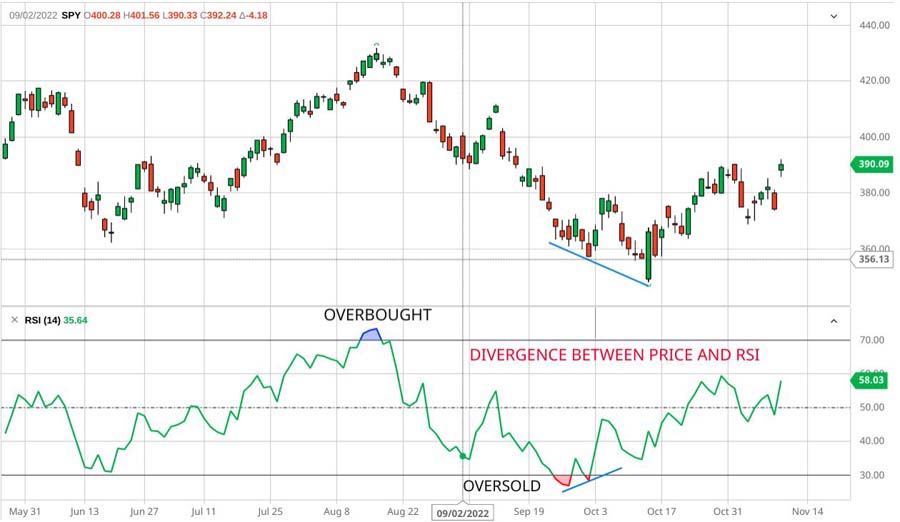
RSI is a popular tool among traders for its simplicity and effectiveness in identifying trends and potential reversals. Many traders rely on RSI to time their entries and exits with greater precision, especially when used alongside other indicators like Bollinger Bands.
How to Use Bollinger Bands with RSI Strategy
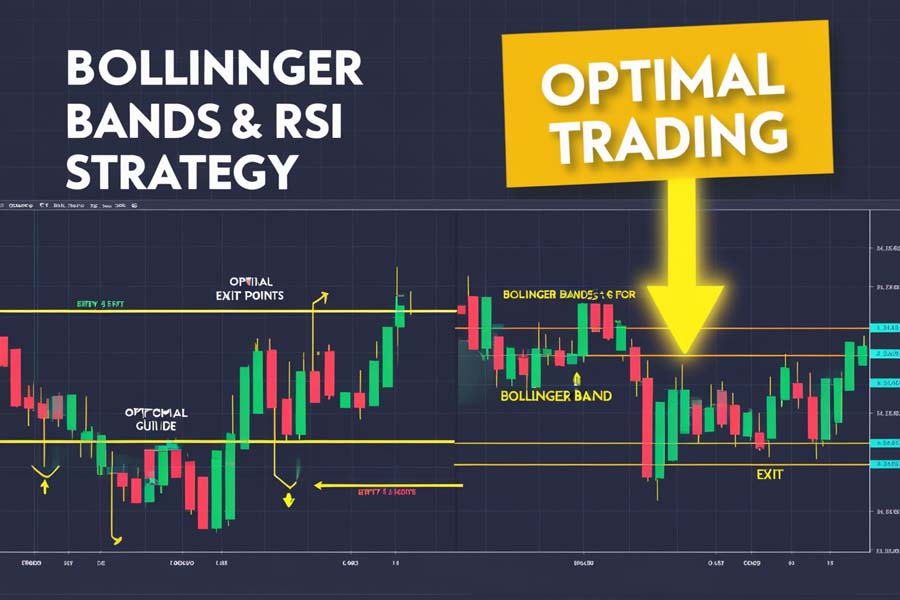
Combining Bollinger Bands with the Relative Strength Index (RSI) provides traders with a solid strategy for identifying potential price reversals, breakouts, and key entry or exit points. Here’s a practical step-by-step guide on how to use this strategy effectively in real-world trading scenarios.
1. Start with RSI to Spot Overbought and Oversold Levels
The first step in using this strategy is to focus on the RSI. RSI quickly tells you if an asset is potentially overbought (above 70) or oversold (below 30). This gives you an initial idea of whether you should be looking for a buying or selling opportunity.
- Overbought (RSI > 70): The asset has been rising quickly, and there may be limited upside remaining before a reversal.
- Oversold (RSI < 30): The asset has been dropping, and a reversal or bounce could be coming soon.
By starting with RSI, you’re able to filter out the noise of minor price fluctuations and zero in on assets that may be primed for significant moves. This is a quick, reliable method to spot when the market conditions are ripe for action.
2. Use Bollinger Bands to Confirm Timing for Entries and Exits
Once RSI tells you the asset may be overbought or oversold, use Bollinger Bands to fine-tune the timing of your trade. Bollinger Bands reflect the volatility of the asset and help confirm whether the market might be about to reverse.
Here’s how you can practically apply Bollinger Bands to your trades:
- Upper Band + Overbought RSI: If the price is hitting the upper Bollinger Band and the RSI is above 70, it’s a signal that the market might be overextended. This could be a good time to consider exiting a long position or even opening a short position if you expect the price to fall.
- Lower Band + Oversold RSI: If the price is touching the lower Bollinger Band and the RSI is below 30, this suggests the market may be oversold and is due for a rebound. You could consider buying at this point, expecting the price to rise.
The Bollinger Bands serve as visual cues to confirm that price action is reaching extreme levels, aligning with the RSI signals. This helps ensure that you don’t jump into trades too early and gives more confidence in your decision-making.
3. Wait for Price Action to Re-Enter the Bands
A practical and more conservative approach is to wait for price action to re-enter the Bollinger Bands after it has gone outside. If the price goes beyond the bands but soon returns within them, this indicates that the extreme volatility is fading and the price may be ready to reverse.
- Oversold Condition: If the price drops below the lower Bollinger Band and RSI is below 30, wait for the price to move back inside the band. This signals that the selling pressure might be easing, and it could be a good time to enter a long trade.
- Overbought Condition: If the price breaks above the upper Bollinger Band and RSI is above 70, wait for the price to fall back within the bands before considering a short trade. This suggests that buying pressure is weakening, and a reversal could be near.
Waiting for the price to return within the bands helps you avoid jumping in too early, reducing the risk of getting caught in a false move.
4. Trade Breakouts with Bollinger Band Squeezes
Another practical application of Bollinger Bands with RSI is trading breakouts. A Bollinger Band Squeeze occurs when the bands contract, indicating low volatility. This often precedes a significant breakout, though the direction of the breakout is uncertain.
- RSI Confirmation: If RSI is above 50 during a Bollinger Band Squeeze, it could suggest an upcoming bullish breakout. If RSI is below 50, it may indicate a bearish breakout.
In practical terms, once you see a Bollinger Band Squeeze, monitor the price closely. If RSI confirms the breakout direction, you can plan your trade accordingly. For example, if the price breaks above the upper band and RSI supports it with a reading above 50, you may consider going long.
5. Spot Reversals with Divergence Between Price and RSI
Incorporating divergence between price action and RSI into your Bollinger Bands strategy adds another level of confirmation for reversals.
- Bullish Divergence: When the price is making lower lows, but RSI is making higher lows, it suggests that downward momentum is weakening. If the price is also nearing or bouncing off the lower Bollinger Band, this could be a strong buy signal.
- Bearish Divergence: When the price is making higher highs, but RSI is making lower highs, it suggests that the upward trend is losing steam. If the price is touching or surpassing the upper Bollinger Band, it could be a strong sell signal.
Looking for divergence helps you catch major reversals before they fully unfold, giving you a chance to enter a trade early with more confidence.
Read More: trading with adx and rsi
Example of the Strategy in Action:
Let’s put this into a real-world context:
- You’re analyzing the EUR/USD currency pair.
- RSI drops below 30, signaling that the market is oversold.
- Simultaneously, the price touches the lower Bollinger Band.
- To confirm your trade, you wait until the price moves back inside the Bollinger Band.
- Once the price closes inside the band and RSI starts climbing back up, you enter a buy position, expecting the market to bounce from the oversold conditions.
This step-by-step process provides clear and actionable signals, reducing the chances of acting on false signals and improving your timing for entering and exiting trades.
Final Thought: By following this practical approach, the Bollinger Bands and RSI strategy becomes an easy-to-use and reliable method for both new and experienced traders. Whether you’re looking to spot reversals, confirm breakout opportunities, or time your trades more accurately, this strategy offers a comprehensive way to enhance your trading performance.
Pro Tip: To increase the accuracy of your Bollinger Bands and RSI strategy, combine it with a moving average as an additional layer of confirmation. For instance, if the price is nearing the lower Bollinger Band and RSI signals oversold conditions, but the price is also above a 50-period moving average, it could indicate that the overall trend is still strong, reducing the likelihood of a reversal. This helps you avoid false signals and ensures you’re trading in the direction of the broader trend.
Benefits of Using Bollinger Bands and RSI Together
1. Increased Accuracy in Entry and Exit Points
One of the primary advantages of combining Bollinger Bands with RSI is the increased precision it offers when deciding when to enter or exit a trade. By relying on Bollinger Bands for price volatility and RSI for momentum confirmation, traders can avoid mistiming their trades. This added layer of confirmation can reduce the risk of jumping into a trade too early or exiting too late.
2. Avoiding False Signals
Traders often fall victim to false signals, especially during volatile periods. By using Bollinger Bands to identify extreme price movements and RSI to confirm the market’s momentum, traders can reduce the number of false signals they act upon. This reduces the likelihood of making unprofitable trades based on misleading market moves.
3. Adaptability Across Different Markets
The Bollinger Bands and RSI strategy isn’t limited to any one market. It can be used across various asset classes such as stocks, commodities, and forex. Regardless of whether you are trading forex, equities, or cryptocurrencies, this strategy is adaptable and effective across timeframes, making it suitable for day traders, swing traders, and even long-term investors.
4. Complementary to Other Indicators
Advanced traders can enhance the effectiveness of this strategy by combining it with additional technical tools. For example, adding Moving Average Convergence Divergence (MACD) or Fibonacci Retracements can provide extra confirmation, further increasing the likelihood of successful trades.
Practical Examples: Bollinger Bands and RSI Strategy in Action
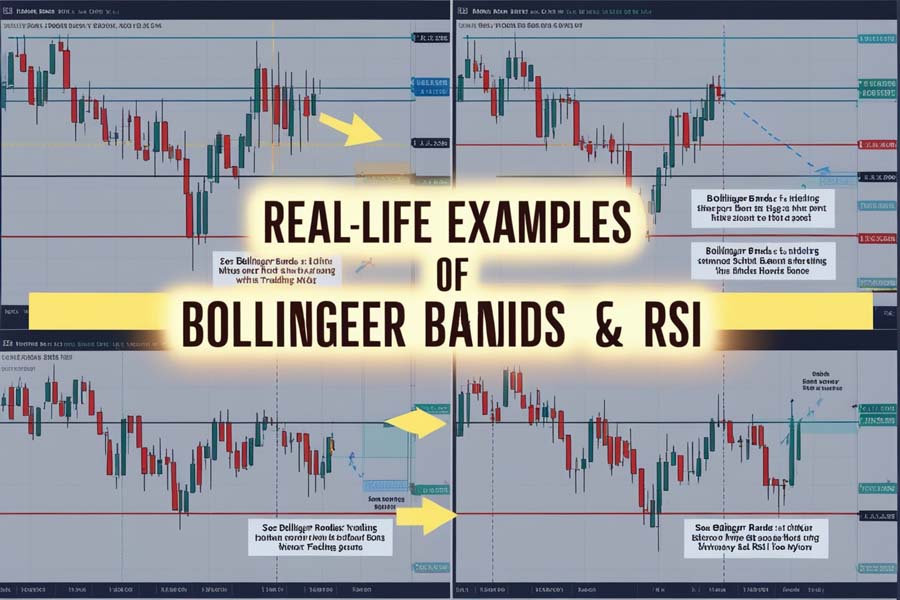
Let’s now apply the practical approach from the previous section to real trading scenarios. These examples will help you understand how to use Bollinger Bands with RSI in different market situations, ensuring you can make informed decisions when trading.
Example 1: Identifying an Oversold Condition with a Rebound in EUR/USD
You’re monitoring the EUR/USD forex pair on a 4-hour chart. The following conditions appear:
- RSI is below 30, indicating that the market is oversold.
- Simultaneously, the price touches the lower Bollinger Band.
At this point, you know that the market is showing signs of being oversold. However, to avoid a false move, you wait for additional confirmation.
- Step 1: Watch for the price to move back inside the lower Bollinger Band after dipping below it. This signals that selling pressure is fading.
- Step 2: Once the price closes back inside the band, and RSI starts moving upward from oversold territory, it gives you a clearer sign that a rebound is likely.
At this point, you would enter a buy trade, expecting a price rise. You could also set your stop-loss just below the recent low, ensuring you protect yourself from unexpected market moves.
Example 2: Trading a Bollinger Band Squeeze with RSI Confirmation in Tesla Stock
In this scenario, you’re watching Tesla stock (TSLA) and notice that the Bollinger Bands have contracted significantly, signaling a period of low volatility (Bollinger Band Squeeze). You’re expecting a breakout, but you’re unsure of the direction.
- Step 1: Look at the RSI reading. If RSI is above 50, this suggests upward momentum and indicates a potential bullish breakout. If RSI is below 50, it indicates the possibility of a bearish breakout.
- Step 2: If RSI is above 50 and the price starts to break above the upper Bollinger Band, it signals that the breakout is likely to move higher. You could enter a long position here, expecting a price rally.
If the RSI had been below 50 during the squeeze, you’d wait for a breakout below the lower Bollinger Band and possibly enter a short position.
Example 3: Spotting Divergence for a Reversal in Crude Oil Futures
Now imagine you are trading crude oil futures. The price has been making higher highs on the chart, but the RSI is showing lower highs. This is a classic example of bearish divergence, signaling that the uptrend might be losing steam.
- Step 1: The price touches the upper Bollinger Band during this divergence, giving you an extra sign that the asset might be overbought.
- Step 2: You wait for the price to close back inside the Bollinger Band, indicating the bullish momentum is starting to fade.
At this point, you can consider entering a short position, anticipating a potential reversal downward. This combination of divergence, RSI, and Bollinger Band signals allows you to act confidently before the trend fully reverses.
Example 4: Avoiding False Signals in GBP/USD with Moving Average
You’re monitoring the GBP/USD pair, and you notice the following:
- RSI dips below 30, signaling that the market is oversold.
- The price is touching the lower Bollinger Band.
At first glance, this might look like a buying opportunity, but you apply a 50-period moving average as an extra filter.
- Step 1: Check if the price is trading below the 50-period moving average. If it is, this suggests the overall trend is still bearish, and a quick reversal might not occur.
- Step 2: Instead of entering the trade immediately, you wait for more confirmation. If the price moves back above the moving average and stays within the Bollinger Bands, you can then enter the long position, avoiding an early and risky entry.
Final Thought: These practical examples show how the Bollinger Bands and RSI strategy can be applied across different markets, whether forex, stocks, or commodities. By waiting for confirmation from both indicators—RSI’s momentum reading and Bollinger Bands’ volatility measure—you can minimize false signals and enter trades with more confidence.
Pro Tips for Advanced Traders Using Bollinger Bands and RSI Strategy

1. Customize Your Bollinger Band Settings
The standard Bollinger Band setting uses a 20-period moving average and 2 standard deviations. However, advanced traders often adjust these settings to better suit their trading style. For example, short-term traders might opt for a 10-period moving average, while long-term traders may prefer a 50-period setting to capture more significant trends.
2. Double Bollinger Bands for Enhanced Signals
Some advanced traders use a Double Bollinger Band strategy by overlaying two sets of Bollinger Bands on the same chart: one with 1 standard deviation and another with 2 standard deviations. This allows for more precise entries, especially during high-volatility periods.
3. Use in Trending Markets
While Bollinger Bands and RSI are often used in ranging markets, they are also effective in trending markets. In strong uptrends, the price may consistently touch the upper Bollinger Band, while RSI remains between 50 and 70. In these cases, rather than viewing the upper Bollinger Band as a sell signal, it can indicate a strong continuation, and traders might add to their position during retracements.
Advanced traders using a forex broker should consider these pro tips to gain a competitive advantage and further refine their strategies.
Opofinance Services: A Trusted Choice for Traders
When implementing the Bollinger Bands and RSI strategy, having the right trading platform and broker is essential. Opofinance, an ASIC-regulated broker, provides a safe and secure trading environment for traders at all levels. As an officially recognized broker on the MT5 brokers list, Opofinance offers superior trading conditions, including fast execution, minimal slippage, and advanced charting tools, which are essential for implementing technical strategies like Bollinger Bands and RSI.

Opofinance also offers Social Trading, allowing traders to copy the strategies of more experienced investors. This feature is especially beneficial for those new to technical analysis or those looking to diversify their strategies.
With safe and convenient deposit and withdrawal methods, Opofinance ensures that your funds are secure while providing a seamless trading experience.
Conclusion: Master the Markets with Bollinger Bands and RSI
The Bollinger Bands and RSI strategy offers a reliable and effective way to identify potential trading opportunities. By combining Bollinger Bands’ volatility insights with RSI’s momentum analysis, traders can improve their timing on entries and exits, avoid false signals, and increase their chances of success.
Whether you’re trading forex, stocks, or commodities, this strategy can be adapted to suit your style and market of choice. Moreover, partnering with a reliable broker like Opofinance ensures that you have the tools and resources needed to succeed in today’s fast-moving markets.
Key Takeaways
- Bollinger Bands indicate price volatility, while RSI helps confirm momentum and overbought/oversold conditions.
- Combining Bollinger Bands and RSI can improve your timing for both entry and exit points in trades.
- The strategy is adaptable across multiple markets, including forex, stocks, and commodities.
- Partnering with a trusted, regulated broker like Opofinance enhances your trading experience, providing fast execution, social trading options, and secure transaction methods.
What settings should I use for Bollinger Bands and RSI?
For Bollinger Bands, the default setting of a 20-period moving average with 2 standard deviations works well for most traders. For RSI, the typical setting is a 14-period, but you may adjust these depending on your trading style and timeframes. Short-term traders might opt for lower periods, while long-term traders can increase the periods.
Can I use the Bollinger Bands and RSI strategy in different timeframes?
Yes! The Bollinger Bands and RSI strategy works across multiple timeframes. Day traders can use shorter timeframes, such as 5-minute or 15-minute charts, while swing traders may find the strategy more effective on 4-hour or daily charts. The key is adjusting your strategy to the timeframe that best fits your trading goals.
Is the Bollinger Bands and RSI strategy effective in trending markets?
Absolutely. While the Bollinger Bands and RSI strategy is often used in ranging markets, it can also be very effective in trending markets. In strong trends, RSI will typically stay in the overbought or oversold zones for extended periods, while Bollinger Bands will act as a guide for breakouts and retracements.


