The Bollinger Bands swing trading strategy is a powerful technical analysis method that helps traders identify potential entry and exit points in the market by measuring volatility and price levels relative to moving averages. For traders partnering with a reliable online forex broker, understanding how to use Bollinger Bands for swing trading can be the key to achieving consistent profits. This comprehensive guide will walk you through proven Bollinger Bands techniques that can help you capture significant price swings while effectively managing risk.

Whether you are selecting a regulated forex broker or fine-tuning your trading approach, mastering Bollinger Bands can transform your swing trading success rate from average to exceptional. By the end of this guide, you will have a solid foundation in Bollinger Bands and the confidence to implement various strategies that can enhance your trading outcomes.
Understanding Bollinger Bands Fundamentals

Basic Components
Bollinger Bands are a versatile technical indicator consisting of three lines:
- A middle band (typically a 20-day simple moving average)
- An upper band (set at 2 standard deviations above the middle band)
- A lower band (set at 2 standard deviations below the middle band)
These bands expand and contract based on market volatility, creating a dynamic range that helps traders identify potential entry and exit points.
How Bollinger Bands Work
Bollinger Bands operate on the principle of statistical probability:
- Approximately 90% of price action occurs between the outer bands.
- Movements beyond the bands are significant indicators of potential reversals or continuations.
- The band width indicates market volatility, providing insight into whether the market is in a consolidation phase or trending strongly.
Customization Options
Traders can adjust:
- Period length (the default is 20 days)
- Standard deviation multiplier (the default is 2)
- Moving average type (simple, exponential, etc.)
Customizing these settings allows traders to tailor the Bollinger Bands to their trading style and market conditions, enhancing the effectiveness of their strategies.
The Psychology Behind Bollinger Bands
Understanding market psychology is crucial for successful swing trading. Bollinger Bands effectively visualize:
- Periods of consolidation—when bands contract.
- Potential breakouts—when the price approaches band extremes.
- Market volatility—through changes in band width.
Market Sentiment Indicators
Bollinger Bands help identify:
- Oversold conditions (price near the lower band), which may indicate a potential buying opportunity.
- Overbought conditions (price near the upper band), signaling a possible selling opportunity.
- Neutral zones (price near the middle band), where market direction is less certain.
Read More: vwap swing trading strategy
7 Essential Bollinger Bands Swing Trading Strategies
1. The Bollinger Bounce
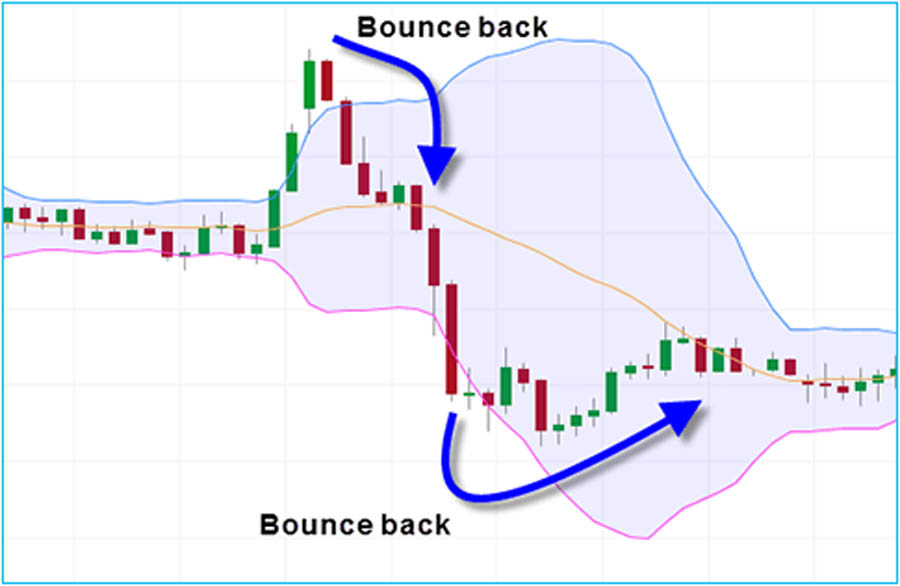
This strategy capitalizes on the tendency of prices to return to the middle band after touching the outer bands. The principle behind this method is grounded in market behavior, as price often retraces towards the average after extreme movements.
Implementation steps:
- Wait for price to touch or exceed outer bands: This is your initial signal that the market might be overbought or oversold, depending on whether the price touches the upper or lower band, respectively.
- Confirm reversal with other indicators: Use complementary tools like the RSI or candlestick patterns to strengthen your trade setup and confirm that a reversal is likely.
- Enter trade in the direction of the bounce: Once you have confirmation, place your trade in the direction of the bounce, aiming for the middle band as your target.
Success Rate and Statistics
- Historical success rate: 65-75%
- Average risk-reward ratio: 1:2, meaning for every unit of risk, aim for two units of reward.
- Best performed in ranging markets: This strategy thrives in markets that do not exhibit strong directional trends, allowing for more frequent bounces.
2. Bollinger Squeeze
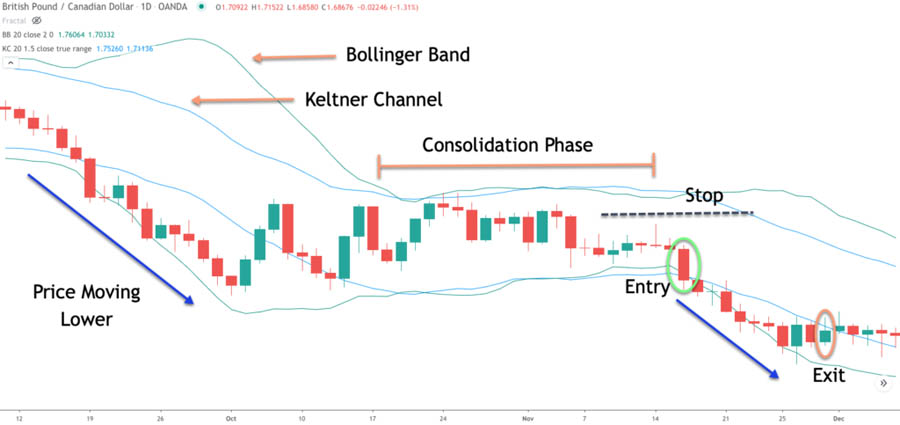
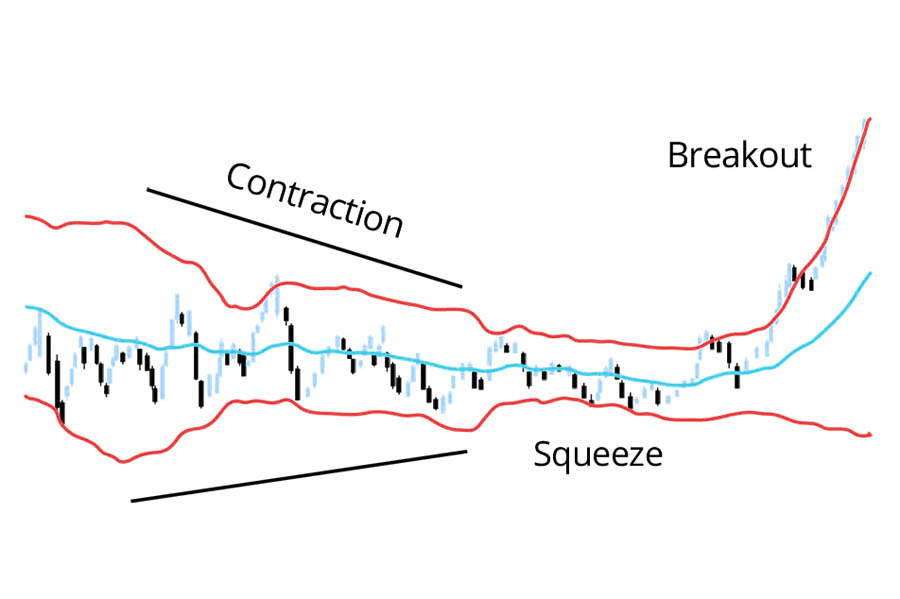
When volatility decreases, bands contract, often preceding significant price movements. This phenomenon, known as a “Bollinger Squeeze,” signals that the market may be gearing up for a breakout.
Key points:
- Look for band contraction: Monitor the width of the bands. A squeeze indicates low volatility, which often precedes a significant price move.
- Prepare for potential breakout: Position yourself for a trade by identifying potential breakout levels, using support and resistance as guides.
- Use volume as confirmation: A breakout accompanied by high volume is generally more reliable, so always watch for this indicator.
Measuring Squeeze Intensity
- Calculate percentage band width: This involves measuring the distance between the upper and lower bands relative to the middle band.
- Compare current width to historical averages: Analyzing historical band widths can provide context for the current market conditions.
- Use indicators like Bollinger Bandwidth: This indicator directly measures the width of the bands and can help in identifying squeezes.
3. Double Bottom Strategy
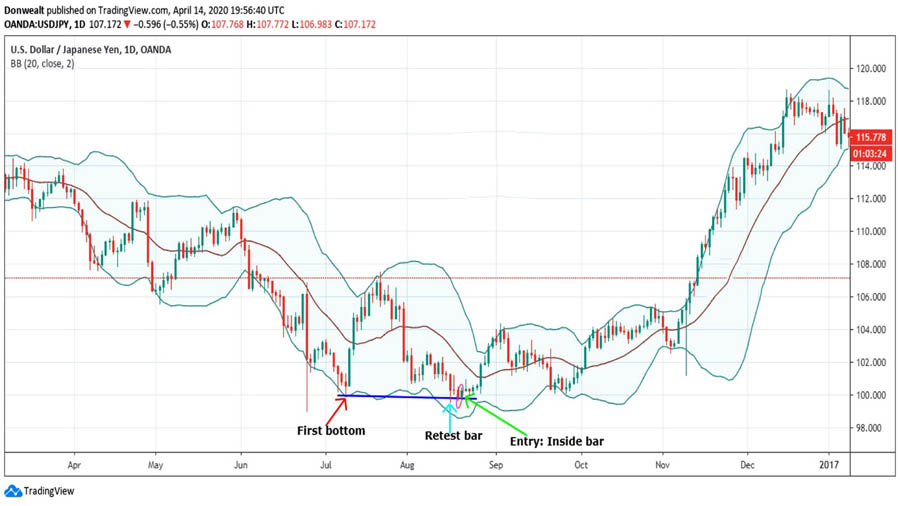
A powerful pattern that forms when price tests the lower band twice without breaking below it. This often indicates strong support at the lower band, making it a favorable entry point.
Execution guidelines:
- Identify two consecutive touches of the lower band: Look for a pattern where the price touches the lower band, retraces, and then touches it again, creating a “W” shape.
- Confirm upward momentum: Use additional indicators like the MACD to confirm that momentum is shifting to the upside.
- Set stop loss below the second bottom: Protect your capital by placing a stop loss just below the lowest point of the second touch.
Pattern Variations
- Regular double bottom: Traditional formation with equal lows.
- Hidden double bottom: Occurs during a downtrend with a higher low on the second touch.
- Extended double bottom: Involves more than two touches and indicates a strong accumulation phase.
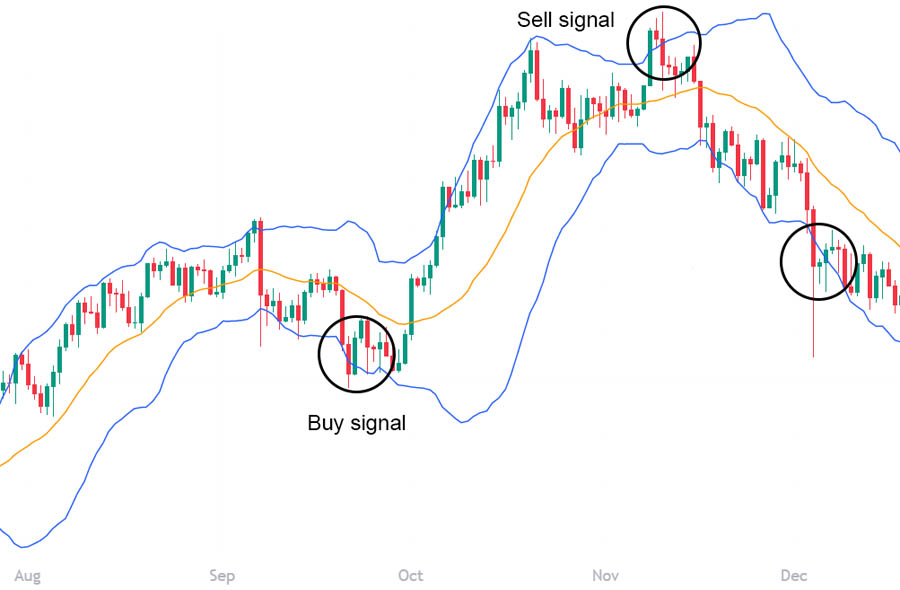
4. Riding the Bands
During strong trends, prices can “ride” along the bands, either the upper or lower, as momentum carries the price. This strategy allows traders to capture longer-term moves while maintaining a favorable risk-reward profile.
Best practices:
- Enter when price moves along the upper/lower band: Wait for a price action that indicates a strong trend, as the price consistently interacts with one of the bands.
- Trail stop loss using the middle band: As the trend progresses, adjust your stop loss to the middle band to lock in profits while allowing for potential further movement.
- Exit when price crosses the middle band: This is typically a sign that the trend may be reversing or losing momentum.
Trend Strength Assessment
- Duration of band riding: The longer the price rides the bands, the stronger the trend.
- Volume analysis during trend: High volume during band riding indicates strong participation and can confirm the trend’s strength.
- Supplementary trend indicators: Consider using moving averages to confirm the overall trend direction.
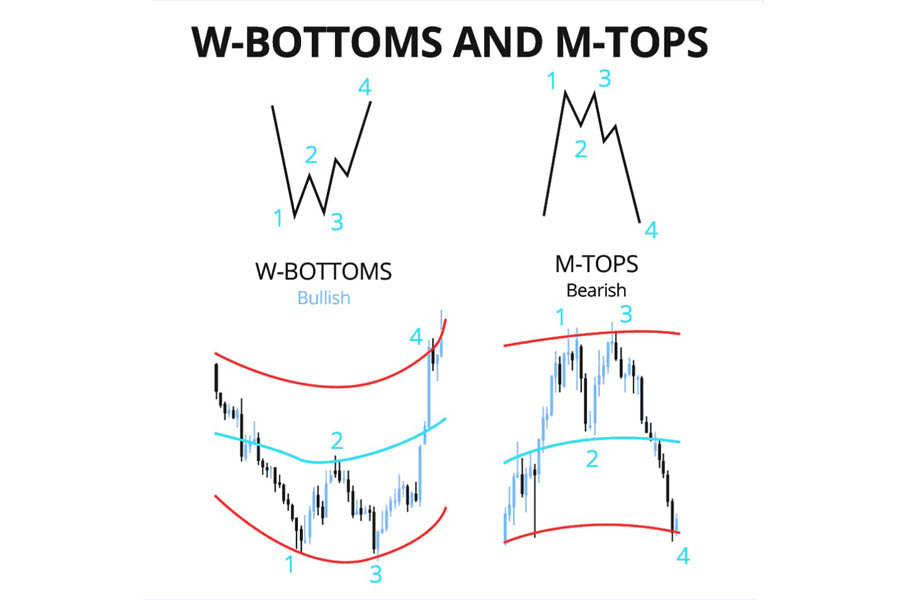
5. W-Bottom Formation
A variation of the double bottom that forms a “W” shape, indicating a potential reversal from a downtrend to an uptrend. This pattern offers traders an opportunity to capitalize on price recovery.
Characteristics:
- First bottom outside lower band: The initial drop below the lower band signals extreme selling pressure.
- Second bottom inside bands: The second touch is often within the bands, suggesting a potential reversal point.
- Higher low on second bottom: This indicates increasing buying pressure and a shift in market sentiment.
Pattern Recognition Tips
- Look for symmetry in W shape: A symmetrical pattern often indicates strength in the reversal.
- Confirm with volume patterns: Volume spikes during the formation can further validate the pattern.
- Check time between bottoms: An optimal time frame between the two bottoms can strengthen the setup’s validity.
6. Bollinger Band Breakout
Significant movements often occur when price breaks out of the bands after a squeeze. Identifying these breakouts can lead to substantial profit opportunities for swing traders.
Steps to trade:
- Identify band contraction: A squeeze often signals that the market is preparing for a significant move.
- Wait for price to break outside bands: Look for a strong close outside the bands, indicating a potential breakout.
- Enter in breakout direction: Place your trade in the direction of the breakout, whether up or down, based on the signal.
Avoiding False Breakouts
- Use volume confirmation: Ensure that the breakout is accompanied by high volume, which adds credibility to the move.
- Check multiple time frames: Analyze the breakout across various time frames to confirm the strength of the move.
- Consider market context: Always factor in the overall market conditions, news events, or economic reports that could affect price movement.
Read More: Pivot Point Swing Trading Strategy
7. Middle Band Bounce
Using the middle band as dynamic support or resistance is a classic strategy for swing traders, allowing them to trade off the average price.
Strategy details:
- Enter when price bounces off the middle band: When the price approaches the middle band and shows signs of bouncing, it can be a prime entry point.
- Direction should align with overall trend: Ensure that your trade direction is in line with the prevailing trend, whether it’s bullish or bearish.
- Use tight stops below/above middle band: This helps limit potential losses while allowing for market fluctuations.
Optimal Market Conditions
- Best during trending markets: The middle band works most effectively when the market is trending, providing reliable entry points.
- Avoid during high volatility: Sudden price swings can lead to false signals, so exercise caution during volatile periods.
- Consider overall market structure: Analyze broader market trends to identify the most favorable trading conditions for this strategy.
Advanced Bollinger Band Concepts
Time Frames
Different time frames provide various perspectives that can influence trading decisions:
- 15-minute charts for day trading strategies.
- 4-hour charts for swing trading tactics.
- Daily charts for capturing longer-term trends.
Using multiple time frames can enhance trading strategies, providing a clearer picture of market movements and improving entry timing.
Multiple Time Frame Analysis
The benefits of analyzing multiple time frames include:
- Improved context understanding: Recognizing broader trends can refine entry points.
- Better entry timing: Aligning short-term trades with long-term trends can increase success.
- More precise risk management: Identifying support and resistance levels across time frames can improve stop loss placement.
Combining with Other Indicators
Enhancing accuracy by using complementary indicators can significantly boost trading effectiveness:
- RSI for momentum confirmation and to identify potential overbought or oversold conditions.
- MACD for trend direction and potential reversals.
- Volume for breakout validation and assessing market strength.
Indicator synergy can lead to higher probability trades, reducing reliance on Bollinger Bands alone.
Risk Management with Bollinger Bands
Effective risk management is crucial for long-term trading success.
- Never risk more than 1-2% of your account per trade to protect your capital.
- Use appropriate position sizing based on your risk tolerance and account size.
- Always set stop losses to limit potential losses.
- Consider taking partial profits at predetermined levels to lock in gains.
Position Sizing Strategies
Common strategies include:
- Fixed percentage method: Risking a set percentage of your total account on each trade.
- Volatility-based sizing: Adjusting position size based on the volatility of the asset being traded.
- Account balance consideration: Adjusting trade sizes as your account grows or shrinks.
Stop Loss Placement
Techniques for stop loss positioning:
- Set stops below/above outer bands to protect against price movements.
- Use previous swing highs/lows as reference points for placement.
- Consider volatility-based stops to adapt to changing market conditions.
Common Mistakes to Avoid
To improve trading outcomes, avoid these common pitfalls:
- Overreliance on bands alone without considering overall market context.
- Ignoring broader market trends can lead to poor decision-making.
- Not waiting for confirmation can result in false signals and losses.
- Using inappropriate time frames for your trading strategy can mislead your analysis.
Learning from Mistakes
- Keep a detailed trading journal to track decisions, successes, and failures.
- Review and analyze losing trades to identify patterns and areas for improvement.
- Continuously refine your strategy based on lessons learned from both wins and losses.
Read More: xauusd swing trading strategy
Opofinance Services
For traders seeking a reliable platform to implement Bollinger Bands swing trading strategies, Opofinance stands out as an ASIC-regulated forex broker offering comprehensive trading solutions. Their social trading service allows users to learn from and copy successful traders’ Bollinger Band strategies. As an officially featured broker on the MT5 brokers list, Opofinance provides:
- Advanced charting tools for in-depth Bollinger Band analysis.
- Safe and convenient deposits and withdrawals for hassle-free trading.
- Educational resources for strategy development and skill enhancement.
- Professional customer support to assist with trading queries.

Platform Features
- Multiple chart types and timeframes for diverse trading strategies.
- Custom indicator settings to personalize your trading experience.
- Advanced order types to suit various trading strategies.
- Real-time market analysis tools to help traders stay informed.
Conclusion
Mastering the Bollinger Bands swing trading strategy is essential for traders looking to capitalize on market volatility and identify optimal entry and exit points. As highlighted in this guide, the flexibility of Bollinger Bands allows traders to adapt their strategies to different market conditions, whether they are trending or ranging.
Each of the seven strategies discussed offers unique insights into market behavior, providing traders with the tools necessary to make informed decisions. It’s important to remember that effective trading relies not just on these strategies but also on strong risk management practices. By keeping losses to a minimum through proper position sizing and stop-loss placement, you can protect your trading capital and increase your chances of long-term success.
Incorporating a platform like Opofinance, which offers advanced trading tools and a social trading service, can further enhance your ability to implement these strategies effectively. By learning from experienced traders, you can accelerate your journey toward becoming a proficient swing trader.
Ultimately, continuous learning, disciplined execution, and adapting to market conditions are the keys to transforming your trading success with Bollinger Bands. With practice and perseverance, you can unlock new opportunities in your trading journey for 2024 and beyond.
Can Bollinger Bands predict market crashes?
While Bollinger Bands can’t directly predict market crashes, they can indicate unusual volatility levels that might precede significant market movements. Extreme band widening or unusual price behavior relative to the bands might signal potential market instability, making it crucial for traders to remain vigilant.
What’s the ideal timeframe for using Bollinger Bands in swing trading?
The ideal timeframe depends on your trading style, but many swing traders find success using 4-hour and daily charts. The 4-hour timeframe can help identify shorter-term swings, while daily charts provide a broader market context for more significant price movements. Understanding your trading objectives will help you select the timeframe that best suits your strategy.
Are Bollinger Bands more effective in trending or ranging markets?
Bollinger Bands can be effective in both market conditions, but they shine in ranging markets where price tends to bounce between the upper and lower bands. In trending markets, they’re best used in conjunction with other trend-following indicators for optimal results. By recognizing the market environment, traders can better adapt their strategies.


