In the dynamic world of forex trading, utilizing effective indicators is crucial for making informed decisions. The CCI indicator in forex is a powerful tool that traders leverage to identify potential market trends and reversals. This article delves into the intricacies of the Commodity Channel Index (CCI), exploring its definition, calculation, and practical applications in forex trading. Whether you are a novice or an experienced trader, understanding how to use CCI indicator in forex trading can enhance your trading strategy and improve your market analysis.

Choosing the right forex broker is equally important to ensure a seamless trading experience. A regulated broker provides the necessary security and reliability, allowing traders to focus on implementing strategies like the CCI indicator effectively.
Definition of the Commodity Channel Index (CCI)

The Commodity Channel Index (CCI) is a versatile technical analysis tool developed to identify cyclical trends in the market. Originally designed for commodities, the CCI has become widely used in forex trading due to its ability to measure the deviation of price from its average. By quantifying the current price level relative to an average price over a specific period, the CCI helps traders determine whether an asset is overbought or oversold.
Key Features of CCI
- Momentum Indicator: CCI measures the current price level relative to an average price over a specific period, helping traders assess the momentum of price movements.
- Versatility: While initially created for commodities, CCI is applicable to various financial instruments, including currencies, stocks, and indices.
- Trend Identification: CCI assists in identifying the strength and direction of market trends, making it a valuable tool for both trend-following and contrarian strategies.
Understanding the CCI Calculation

To effectively use the CCI indicator, it’s essential to understand its calculation. The CCI quantifies the difference between the current price and the average price over a specified period, normalized by a scaling factor to ensure consistency.
Formula for Calculating the CCI
The CCI is calculated using the following formula:

Where:
- Typical Price (TP): The average of the high, low, and closing prices for a given period.
- SMA (Simple Moving Average): The average of the Typical Price over the chosen period.
- Mean Deviation: The average of the absolute differences between the Typical Price and the SMA of the Typical Price.
Step-by-Step Calculation
- Calculate the Typical Price (TP):

- Compute the Simple Moving Average (SMA) of TP:

Where nnn is the number of periods.
- Determine the Mean Deviation:

- Apply the CCI Formula:

Explanation of Typical Price and Mean Deviation
- Typical Price (TP): This represents the average price of the asset for a specific period, providing a more comprehensive view than just the closing price.
- Mean Deviation: This measures the average distance between each Typical Price and the SMA of TP, indicating the volatility and variability of the price movements.
Importance of Scaling Factor for Accurate Readings
The scaling factor of 0.015 is used to ensure that the CCI values typically fall between -100 and +100. This normalization allows traders to easily interpret the indicator and identify overbought or oversold conditions. Without this scaling factor, the CCI values could vary significantly, making it challenging to establish consistent trading signals.
Interpreting CCI Values

Interpreting CCI values correctly is crucial for making informed trading decisions. The CCI oscillates above and below a zero line, providing signals based on its movement relative to key thresholds.
Overbought and Oversold Conditions: Thresholds of +100 and -100
- Overbought (+100): When the CCI rises above +100, it suggests that the asset may be overbought. This condition indicates that the price has risen significantly and may be due for a pullback or reversal.
- Oversold (-100): When the CCI falls below -100, it indicates that the asset may be oversold. This condition suggests that the price has declined sharply and may be due for an upward correction.
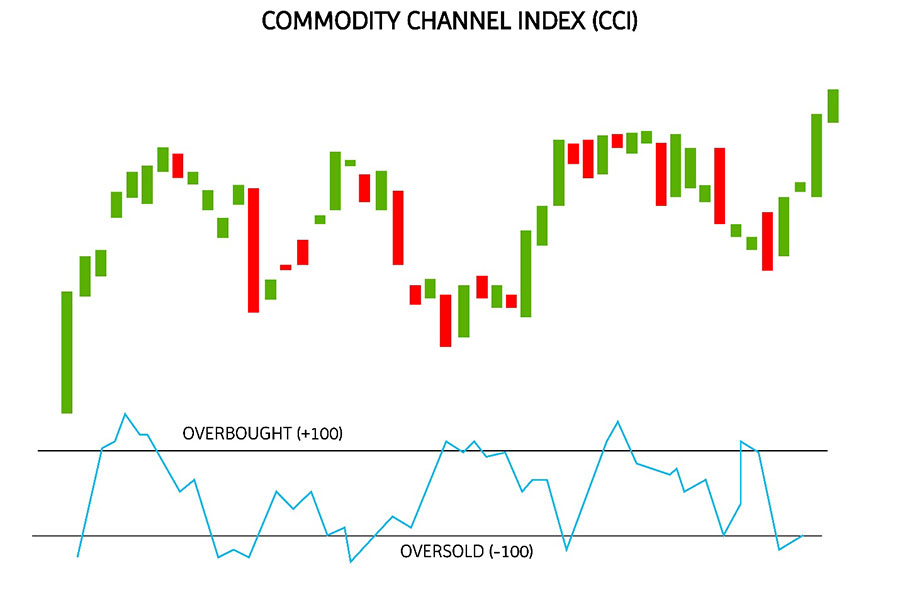
These thresholds help traders identify potential entry and exit points by signaling when an asset’s price has moved too far in one direction.
Significance of Zero Line Crossovers for Trend Identification
Crossing the zero line is a critical signal in CCI analysis:
- Above Zero Line: Indicates that the price is above its average, suggesting an upward trend. Traders may consider this a bullish signal, potentially entering long positions.
- Below Zero Line: Suggests that the price is below its average, pointing to a downward trend. Traders may interpret this as a bearish signal, potentially entering short positions.
These crossovers help traders identify the prevailing market trend and make strategic trading decisions based on the direction of the trend.
Additional CCI Interpretation Techniques
- Extreme CCI Values: CCI values exceeding +200 or dropping below -200 can indicate strong momentum, signaling potential trend continuation rather than reversal.
- Sustained Overbought/Oversold Levels: Prolonged periods where CCI remains above +100 or below -100 can indicate strong trends, where reversal signals may be less reliable.
Read More: Zigzag Indicator in Forex
Using CCI in Trading Strategies

The CCI indicator can be integrated into various trading strategies to enhance decision-making and improve trading performance. By leveraging the CCI’s ability to identify trends and reversals, traders can develop systematic approaches to entering and exiting trades.
Identifying Trend Reversals through CCI Divergence
Divergence between the CCI and price movements can signal potential trend reversals. Divergence occurs when the CCI and the price chart move in opposite directions, indicating a weakening trend.
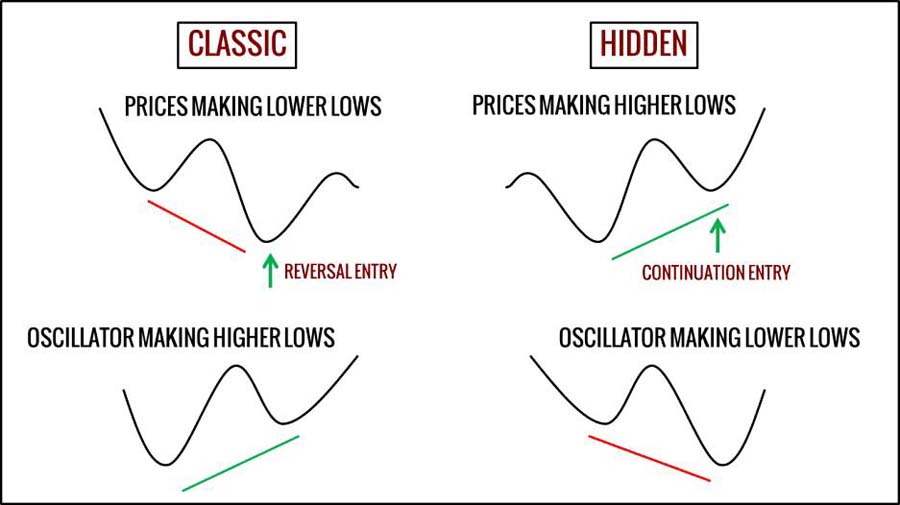
Bullish Divergence: Price Makes Lower Lows, CCI Makes Higher Lows
When the price forms lower lows while the CCI forms higher lows, it indicates that the downward momentum is weakening. This divergence suggests that the selling pressure is diminishing, potentially leading to an upward reversal.
Traders can use bullish divergence as a signal to consider entering long positions, anticipating a price increase.
Bearish Divergence: Price Makes Higher Highs, CCI Makes Lower Highs
Conversely, when the price forms higher highs but the CCI forms lower highs, it suggests that the upward momentum is fading. This divergence indicates that the buying pressure is weakening, possibly resulting in a downward reversal.
Traders can use bearish divergence as a signal to consider entering short positions, anticipating a price decline.
Timing Entries and Exits Based on CCI Signals
Effective use of the CCI involves precise timing for entering and exiting trades to maximize profits and minimize losses. Proper timing is essential to capitalize on the signals generated by the CCI.
- Entry Points:
- Long Position: Consider entering a trade when the CCI crosses above +100, signaling an overbought condition and potential reversal to the downside.
- Short Position: Consider entering a trade when the CCI crosses below -100, signaling an oversold condition and potential reversal to the upside.
- Exit Points:
- Using Zero Line Crossovers: Exit long positions when the CCI crosses below the zero line, indicating a potential trend reversal. Exit short positions when the CCI crosses above the zero line.
- Divergence Signals: Use divergence signals to exit trades when a reversal is anticipated, locking in profits or minimizing losses.
By accurately timing entries and exits based on CCI signals, traders can enhance their trading performance and manage risk effectively.
Advanced Trading Techniques with CCI
- Multiple Time Frame Analysis: Use CCI on different time frames to confirm signals. For example, a bullish signal on a daily chart supported by a similar signal on a weekly chart can increase confidence in the trade.
- CCI as a Confirmation Tool: Use CCI to confirm signals from other indicators, such as candlestick patterns or trend lines, to strengthen trading decisions.
Combining CCI with Other Indicators
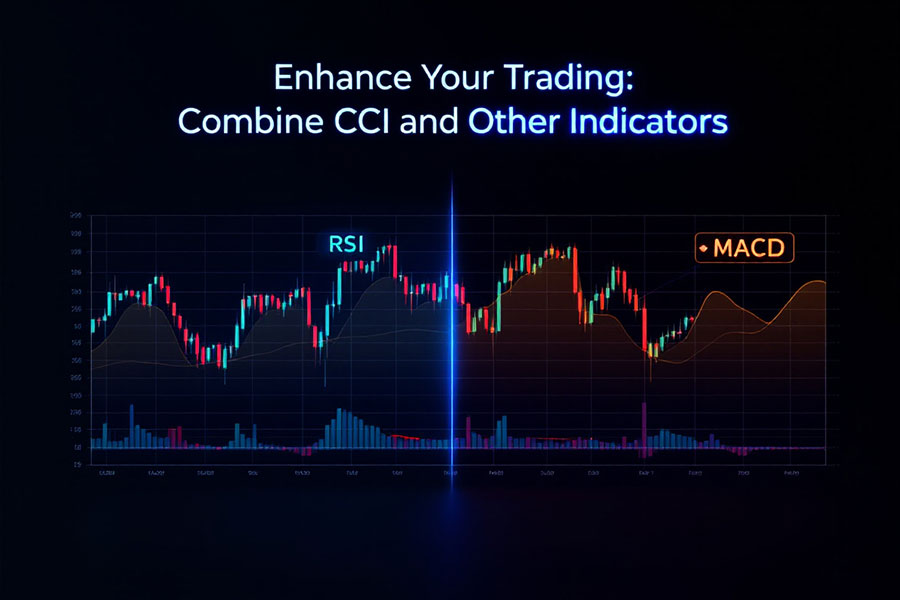
Importance of Using CCI Alongside Other Technical Analysis Tools
Relying solely on the CCI can sometimes lead to false signals, especially in volatile or sideways markets. Integrating the CCI with other technical indicators enhances the reliability of trading signals and provides a more comprehensive market analysis. By combining multiple indicators, traders can confirm signals and reduce the likelihood of acting on misleading information.
Read More: Fractals Indicator in Forex Trading
Examples of Complementary Indicators
- Moving Averages:
- Simple Moving Average (SMA): Helps in identifying the overall trend direction. Combining CCI with SMA can confirm trend strength and direction.
- Exponential Moving Average (EMA): Reacts more quickly to price changes, providing timely signals that complement CCI.
- Relative Strength Index (RSI):
- RSI measures the speed and change of price movements, similar to CCI. Using RSI alongside CCI can provide additional confirmation of overbought or oversold conditions.
- Moving Average Convergence Divergence (MACD):
- MACD is a momentum indicator that shows the relationship between two moving averages. Combining MACD with CCI can offer insights into momentum and trend strength, enhancing trading signals.
- Bollinger Bands:
- Bollinger Bands measure market volatility and identify overbought or oversold conditions. When used with CCI, Bollinger Bands can help validate CCI signals and improve trade entries and exits.
Practical Integration of Multiple Indicators
- Signal Confirmation: Use CCI in conjunction with another indicator to confirm signals. For instance, enter a long position only if both CCI indicates oversold conditions and RSI shows a bullish divergence.
- Risk Management: Combining indicators can help in better risk management by providing multiple layers of confirmation before entering or exiting trades.
- Enhanced Strategy Development: Developing strategies that incorporate multiple indicators can lead to more robust and adaptable trading approaches, capable of performing well in various market conditions.
Practical Applications in Forex Trading

The CCI indicator’s versatility makes it suitable for various trading styles and timeframes. Whether you are a day trader seeking quick profits or a long-term investor aiming to capture significant trends, the CCI can be tailored to fit your trading needs.
Read More: ADX Indicator in Forex
Day Trading Strategies Using CCI
In day trading, the CCI can be used to identify short-term price movements and capitalize on intraday volatility. Traders can set shorter lookback periods (e.g., 14 or 20 periods) to generate more frequent signals, allowing for multiple trades within a single trading session.
Example Day Trading Strategy
- Setup:
- Apply the CCI indicator with a 14-period lookback on a 5-minute chart.
- Set overbought and oversold thresholds at +100 and -100.
- Entry Rules:
- Long Entry: Enter a long position when the CCI crosses above -100 from below.
- Short Entry: Enter a short position when the CCI crosses below +100 from above.
- Exit Rules:
- Long Exit: Exit the long position when the CCI crosses above +100.
- Short Exit: Exit the short position when the CCI crosses below -100.
- Risk Management:
- Use tight stop-loss orders to manage risk due to the high frequency of trades.
- Limit the number of trades per day to avoid overtrading.
This strategy leverages the CCI’s sensitivity to short-term price changes, allowing day traders to take advantage of intraday volatility.
Long-Term Trading Insights with Varying Lookback Periods (e.g., 14, 20, or 50 Periods)
For long-term trading, longer lookback periods can smooth out market noise and provide clearer trend signals. This approach is beneficial for swing traders and position traders who seek to capture larger price movements over extended periods.
Example Long-Term Trading Strategy
- Setup:
- Apply the CCI indicator with a 50-period lookback on a daily chart.
- Set overbought and oversold thresholds at +100 and -100.
- Entry Rules:
- Long Entry: Enter a long position when the CCI crosses above +100, indicating strong upward momentum.
- Short Entry: Enter a short position when the CCI crosses below -100, indicating strong downward momentum.
- Exit Rules:
- Long Exit: Exit the long position when the CCI starts to flatten or shows bearish divergence.
- Short Exit: Exit the short position when the CCI starts to flatten or shows bullish divergence.
- Risk Management:
- Use wider stop-loss orders to accommodate longer-term price swings.
- Employ position sizing strategies to manage exposure effectively.
This strategy takes advantage of the CCI’s ability to identify sustained trends, making it suitable for traders with a longer investment horizon.
Adapting CCI Strategies to Different Currency Pairs
Different currency pairs exhibit varying levels of volatility and trend behavior. Adapting CCI strategies to the specific characteristics of each currency pair can enhance trading performance.
- Major Pairs (e.g., EUR/USD, GBP/USD): These pairs tend to have lower spreads and higher liquidity. CCI strategies can be effectively applied with moderate lookback periods to capture steady trends.
- Minor and Exotic Pairs: These pairs often exhibit higher volatility and wider spreads. Adjusting the CCI settings, such as increasing the lookback period, can help filter out excessive noise and generate more reliable signals.
Understanding the unique behavior of each currency pair allows traders to customize their CCI strategies for optimal results.
Advantages and Limitations of the CCI Indicator
Benefits: Versatility, Trend Identification, Overbought/Oversold Signals
- Versatility: Applicable to various financial instruments beyond forex, including commodities and stocks, making it a flexible tool for diversified trading portfolios.
- Trend Identification: Helps in recognizing the direction and strength of market trends, enabling traders to align their strategies with prevailing market conditions.
- Overbought/Oversold Signals: Facilitates the identification of potential reversal points, aiding in strategic decision-making and improving the timing of trade entries and exits.
- Ease of Use: The CCI is relatively straightforward to implement and interpret, making it accessible to traders of all experience levels.
- Customizable Settings: Traders can adjust the lookback period and thresholds to suit different trading styles and market conditions, enhancing the indicator’s adaptability.
Risks: Potential for False Signals, Market Noise, and Overreliance
- False Signals: The CCI can generate misleading signals, especially in volatile or sideways markets, leading to potential losses if not confirmed with other indicators.
- Market Noise: Short-term fluctuations may obscure the true trend, resulting in incorrect interpretations and poor trading decisions.
- Overreliance: Depending solely on the CCI without considering other factors, such as fundamental analysis or additional technical indicators, can increase the risk of poor trading outcomes.
- Lagging Indicator: As a trend-following indicator, the CCI may lag behind price movements, potentially causing delays in signal generation and missed opportunities.
- Complexity in Interpretation: While the CCI is straightforward in its basic form, advanced interpretations involving divergences and multiple time frames can be complex and require experience to implement effectively.
Mitigating the Risks
- Use in Conjunction with Other Indicators: Combining CCI with other technical tools can reduce the likelihood of false signals and provide a more comprehensive market view.
- Adjusting Settings: Tailoring the CCI’s lookback period and thresholds based on the specific market and trading style can enhance its reliability.
- Implementing Risk Management Strategies: Employing stop-loss orders, position sizing, and other risk management techniques can help mitigate potential losses from false signals.
By understanding and addressing the limitations of the CCI indicator, traders can effectively incorporate it into their trading strategies while minimizing associated risks.
Opofinance: Your Trusted ASIC Regulated Forex Broker
When implementing strategies like the CCI indicator in forex trading, choosing a reliable broker is essential. Opofinance stands out as an ASIC regulated forex broker, ensuring a secure and transparent trading environment. Opofinance offers exceptional social trading services, allowing traders to follow and copy the strategies of experienced investors. Additionally, being officially featured on the MT5 brokers list, Opofinance provides a robust trading platform with advanced features. Their safe and convenient deposit and withdrawal methods further enhance the trading experience, making Opofinance a top choice for both novice and seasoned traders.

Key Features of Opofinance
- ASIC Regulation: Ensures that Opofinance adheres to strict financial standards, providing traders with a secure and trustworthy platform.
- Social Trading Services: Enables traders to engage in social trading, where they can observe and replicate the trades of successful investors, fostering a collaborative trading environment.
- MT5 Platform: As a featured MT5 broker, Opofinance offers access to advanced trading tools, indicators, and customizable features that enhance trading efficiency and effectiveness.
- Safe Deposits and Withdrawals: Opofinance provides a variety of secure and convenient methods for depositing and withdrawing funds, ensuring that traders can manage their finances with ease and confidence.
- Customer Support: Dedicated support teams are available to assist traders with any inquiries or issues, ensuring a smooth and hassle-free trading experience.
Choosing Opofinance as your forex trading broker can complement your use of the CCI indicator, providing the necessary tools and support to execute your trading strategies effectively.
Conclusion
The CCI indicator in forex is a valuable tool for traders seeking to enhance their market analysis and trading strategies. By understanding its calculation, interpretation, and practical applications, traders can effectively identify trends, overbought or oversold conditions, and potential reversals. However, it is crucial to use the CCI in conjunction with other technical indicators and maintain a comprehensive trading approach to mitigate risks and improve trading performance. Integrating the CCI with a reliable broker like Opofinance can further optimize your trading experience, providing the necessary tools and support for successful forex trading.
Final Thoughts
- Continuous Learning: Staying informed about the latest developments and techniques related to the CCI indicator can enhance your trading proficiency.
- Practice and Experience: Regularly applying the CCI in various market conditions can help you gain practical experience and refine your trading strategies.
- Adaptability: Being flexible and willing to adjust your use of the CCI based on market changes and personal trading goals can lead to sustained trading success.
Embracing the CCI indicator as part of a well-rounded trading strategy, supported by a trusted broker like Opofinance, can significantly improve your forex trading outcomes.
How does the CCI indicator differ from the RSI in forex trading?
The CCI and RSI are both momentum indicators, but they differ in their calculation and application. While the RSI measures the speed and change of price movements to identify overbought or oversold conditions, the CCI evaluates the price’s deviation from its average, offering insights into cyclical trends and potential reversals. This fundamental difference means that the CCI can provide additional information about market cycles and trend strength that the RSI may not capture, making them complementary tools in a trader’s arsenal.
Can the CCI indicator be used effectively in all market conditions?
The CCI indicator is versatile, but its effectiveness can vary depending on market conditions. In trending markets, the CCI can help identify the strength and direction of the trend, whereas in sideways or highly volatile markets, it may produce false signals, requiring additional confirmation from other indicators. Therefore, while the CCI is a powerful tool, it is most effective when used in conjunction with other technical analysis methods and when the prevailing market conditions align with its strengths.
What is the optimal lookback period for the CCI indicator in forex trading?
The optimal lookback period for the CCI indicator depends on the trader’s strategy and timeframe. Shorter periods (e.g., 14) are suitable for day trading and capturing short-term movements, while longer periods (e.g., 50) are better for swing trading and identifying long-term trends. Traders may also experiment with different periods to find the settings that best align with their trading style and the specific currency pairs they are trading.


