

Ever watch the futures markets move and wonder who’s really pulling the strings? It’s common to feel like you’re missing a piece of the puzzle. This is where getting the commitment of traders report explained becomes so valuable. So, what is the commitment of traders report exactly? It’s a weekly breakdown from the U.S. Commodity Futures Trading Commission (CFTC) showing the combined positions of different trader groups (like big institutions, commercial businesses, and speculators) in futures markets. Think of it as a sentiment gauge, revealing who’s betting long and who’s betting short. This guide will walk you through accessing, understanding, and applying this powerful data – providing a clear commitment of traders report explained.
Accessing the COT Report
Getting your hands on the Commitment of Traders (COT) report data is quite straightforward. The official and definitive source is the Commodity Futures Trading Commission (CFTC) website itself (cftc.gov). You’ll typically find the reports listed under their market data sections. The CFTC offers the raw data, usually in plain text files, which some analysts prefer for custom processing. Knowing this official source is step one in understanding the commitment of traders report explained.
However, staring at raw text files can be daunting. Thankfully, many financial websites, charting software packages (like TradingView or platforms like MetaTrader via add-ons), and specialized analytical services do the heavy lifting. They process the CFTC data and present it visually, often through charts showing the historical positioning of different trader groups, their net stances (longs minus shorts), and how these change week by week. These visual tools make interpreting the data much more intuitive and are often essential for practically applying the commitment of traders report explained insights. They help answer “what is the commitment of traders report showing right now?” at a glance.
Key Data Points Within the COT Report
To truly get the commitment of traders report explained, you need to understand its core components. Each report dissects the market based on several key figures for different trader categories:
- Open Interest: This is the total count of all outstanding futures contracts that haven’t been settled yet. It reflects the overall level of engagement and capital committed to that market. Rising open interest alongside a price trend can confirm its strength, while falling open interest might suggest waning conviction.
- Long Positions: This number tallies the total contracts held by participants expecting prices to go up.
- Short Positions: Conversely, this is the total contracts held by participants expecting prices to go down.
- Spreading: This accounts for positions where traders hold both long and short contracts simultaneously in the same underlying commodity, usually across different contract months. They’re betting on the price difference changing, not the overall direction.
- Changes from Previous Report: A very closely watched figure. It shows the week-over-week increase or decrease in long, short, and spreading positions for each group. This reveals the recent flow of money and sentiment shifts.
- Number of Traders: The report also indicates how many individual traders make up each reportable category (those large enough to be included). This adds context – is a large position held by just a few players or many?
- Concentration Ratios (Sometimes included): Some formats quantify the market share held by the top 4 or 8 largest traders. High concentration suggests a few big players could have an outsized impact. Grasping these elements is crucial for a solid commitment of traders report explained understanding.
Different Formats of the COT Report
The CFTC offers the COT data in a few different flavors, tailored to specific market types and user needs. Knowing these formats helps you select the most relevant data for your analysis, making the commitment of traders report explained more precise.

Legacy Report
This is the classic, long-standing format, available for almost every futures market. It provides a broad overview, classifying traders into three main groups:
- Commercials: Businesses using futures primarily for hedging risks related to their actual operations.
- Non-Commercials (Large Speculators): Big players (like hedge funds) trading purely for profit, meeting specific size thresholds.
- Non-Reportable (Small Speculators): Smaller traders whose positions fall below the reporting levels. Their total is calculated by subtracting the other two groups from the total open interest.
For many, the Legacy report offers a sufficient commitment of traders report explained perspective.
Disaggregated Report
Introduced to offer more clarity, especially in physical commodity markets (like grains, energy, metals), this format breaks down the Legacy categories further:
- Producer/Merchant/Processor/User: A more refined version of the Commercial category.
- Swap Dealers: Financial institutions hedging exposure from commodity swap deals.
- Managed Money: Registered Commodity Trading Advisors (CTAs), Commodity Pool Operators (CPOs), and similar funds trading speculatively.
- Other Reportables: Large traders who don’t fit neatly into the other specified categories.
This provides a more nuanced commitment of traders report explained, especially useful for certain commodity markets.
Traders in Financial Futures (TFF) Report
Designed specifically for financial contracts like currencies (Forex futures), US Treasury futures, and stock index futures, this report uses categories more relevant to those participants:
- Dealer/Intermediary: Often the ‘sell-side’ (e.g., large banks) making markets or hedging client flows.
- Asset Manager/Institutional: Large ‘buy-side’ institutions (pension funds, mutual funds) using futures for portfolio hedging or allocation.
- Leveraged Funds: Typically hedge funds and proprietary trading firms using leverage for speculative bets. Closely watched for trend-following.
- Other Reportables: Reportable traders not classified elsewhere (e.g., corporate treasuries).
Understanding what is the commitment of traders report format for financials (the TFF) is key for trading those markets.
Supplemental Report
This report provides data for thirteen selected agricultural commodity contracts and adds one more category: ‘Index Traders,’ representing institutional investors holding broad, often passive, long commodity index positions.
Understanding the Main Trader Categories
The real value in the commitment of traders report explained comes from knowing who these groups are and what typically motivates them. This understanding forms the bedrock of interpretation.
Read More: Fundamental Analysis in Forex: Concepts and Effective Indicators
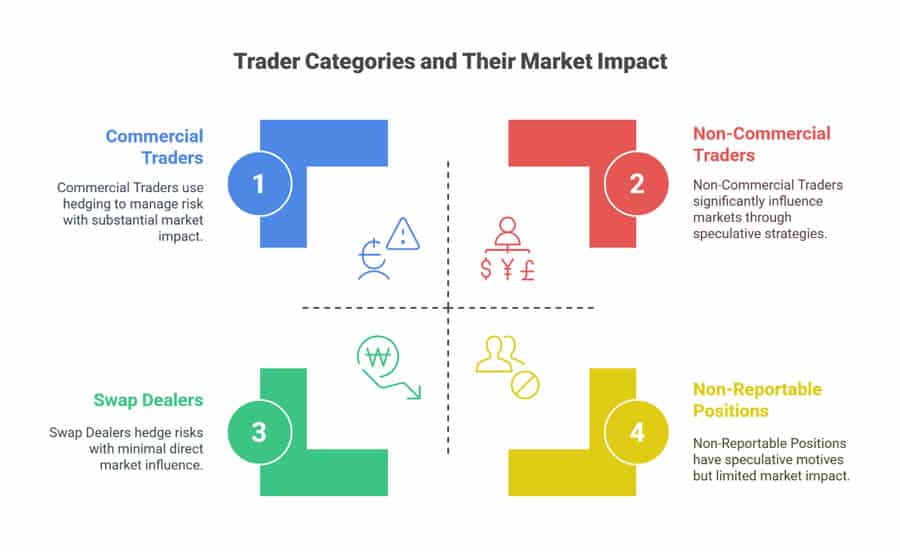
Commercial Traders (Hedgers)
Often referred to as the “smart money” or “insiders,” particularly in physical commodity markets. These aren’t speculators; they are businesses directly involved with the underlying physical commodity – think farmers, energy producers, manufacturers, airlines. They use futures primarily to lock in prices and manage the price risk associated with their core operations (e.g., a chocolate maker hedging cocoa prices). Their main goal is risk reduction, not speculative gain. Analyzing their behavior is often central to the commitment of traders report explained.
Behavior Tendencies
Because they operate in the physical market day-in and day-out, Commercials are presumed to possess deep knowledge about fundamental supply, demand, and value. They tend to be natural sellers of futures (increasing their short hedges) when prices climb significantly above what they perceive as fair value, and natural buyers (increasing long hedges) when prices fall well below fair value. This behavior means their extreme positioning often acts as a potent contrarian indicator. Very high net long positions among Commercials might suggest they see prices as cheap (potential bottom nearby), while very high net short positions suggest they see prices as expensive (potential top nearby).
Non-Commercial Traders (Large Speculators / Managed Money / Leveraged Funds)
This broad category includes large market participants who trade futures contracts strictly for profit, without an underlying business need for the physical commodity or financial instrument. This group typically includes hedge funds, Commodity Trading Advisors (CTAs) managing client money, proprietary trading desks of financial institutions, and other large financial entities meeting the CFTC’s reporting thresholds. The specific name (Non-Commercials, Managed Money, Leveraged Funds) depends on the report format being used.
Behavior Tendencies
These traders are often characterized as trend-followers. Their strategies frequently involve identifying established trends and positioning themselves accordingly – buying into uptrends and selling into downtrends – aiming to capture profits from sustained price movements. Consequently, increasing participation from this group in the direction of the current trend is often viewed as confirmation of the trend’s strength. Conversely, when their collective positioning reaches historical extremes (e.g., record net long or record net short), it can sometimes signal that the trend is becoming overcrowded or exhausted, potentially increasing the likelihood of a correction or reversal. Monitoring their flow is a key aspect of the commitment of traders report explained for trend analysis.
Non-Reportable Positions (Small Speculators)
This category is essentially a “plug” figure. It’s calculated by taking the total open interest and subtracting the positions held by all the reportable categories (Commercials, Non-Commercials, Swap Dealers, etc., depending on the report format). It represents the combined positions of all traders whose individual holdings are too small to meet the CFTC’s reporting thresholds. This group is often assumed to be composed primarily of smaller, individual retail traders.
Behavior Tendencies
Historically, some market analysts have viewed this group as being generally less informed or prone to chasing trends late, often finding themselves incorrectly positioned at major market turning points. As such, extreme positioning by small speculators (e.g., overwhelmingly net long near market peaks or overwhelmingly net short near market troughs) is sometimes used as a contrarian indicator. However, this is a significant generalization, and attributing uniform behavior or lack of sophistication to this diverse group can be misleading. Their aggregate impact varies by market.
Swap Dealers (Disaggregated Report)
Found specifically in the Disaggregated report, Swap Dealers are typically large financial institutions whose business involves dealing in commodity swaps with various clients (like index funds, producers needing tailored hedges, or other speculators). They then use the futures market primarily to hedge the net risk exposure they gain from these swap transactions.
Behavior Tendencies
Their futures positions are often driven more by the need to offset risks from their complex swap books rather than a direct directional bet on the commodity itself. For instance, if they facilitate large amounts of long commodity index exposure for clients via swaps, they become effectively short the underlying components and may buy futures to neutralize that risk. Understanding their role adds depth to the commitment of traders report explained in markets covered by the Disaggregated format.
How to Interpret the COT Data
Once you have the data and understand the players, the next step in mastering the commitment of traders report explained is interpretation. This involves looking beyond the raw numbers to identify meaningful patterns, trends, and potential signals over time.
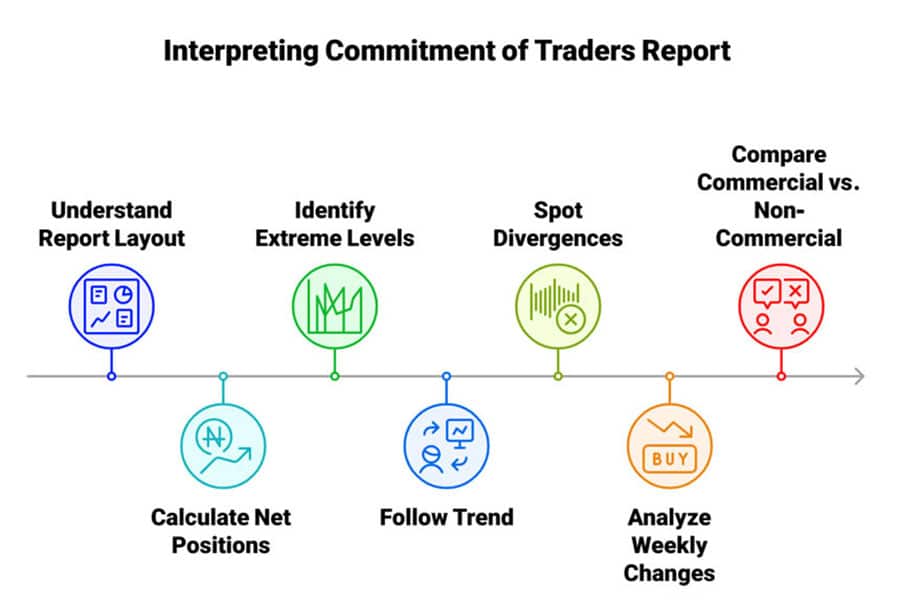
Reading the Tables/Charts
Get comfortable with the report layout. Whether looking at raw text or graphical charts, identify the columns showing long, short, and sometimes spreading positions for each trader category. Pay close attention to the columns indicating the change from the previous week and the number of traders in each group.
Net Positions
This is a cornerstone of COT analysis. Calculate the Net Position for the key groups (especially Commercials and Non-Commercials/Leveraged Funds) by subtracting their total Short positions from their total Long positions.
- A positive result indicates a Net Long position (more buyers than sellers within that group), suggesting a generally bullish stance.
- A negative result indicates a Net Short position (more sellers than buyers), suggesting a generally bearish stance.
Tracking how this Net Position trends over weeks and months is crucial for understanding evolving sentiment. Asking “what is the commitment of traders report showing in net terms?” is a common analytical step.
Identifying Extreme Levels
Context is everything here. Compare the current Net Position of a trader group to its historical range over a significant period (e.g., the last 1, 3, or 5 years). Many charting platforms automate this, showing positions relative to historical highs and lows or using percentile ranks.
- Historically Extreme Net Long: For Commercials, this often signals they perceive significant value (potential bottom). For Non-Commercials, it indicates strong bullish consensus, possibly reaching levels of euphoria or a crowded trade (potential exhaustion).
- Historically Extreme Net Short: For Commercials, this suggests they view prices as excessively high (potential top). For Non-Commercials, it reflects strong bearish consensus, possibly nearing capitulation or an oversold state.
Identifying these extremes is a key part of the commitment of traders report explained approach, but remember extremes can persist.
Following the Trend
Monitor the actions of the Non-Commercial / Leveraged Fund category relative to the prevailing price trend. Are they adding to long positions during an uptrend or adding to shorts during a downtrend? This alignment confirms their participation and can validate the trend’s strength. If the price trend continues but this group’s participation weakens (e.g., they reduce longs even as price makes new highs), it could be an early warning sign.
Spotting Divergences
Divergences occur when price action and the positioning of key trader groups move in opposite directions. These can be powerful (though not infallible) signals of potential trend weakness or reversal.
- Bearish Divergence Example: The price pushes to a new high, but the Non-Commercial net long position fails to reach its previous peak level, or even declines. This suggests the buying power behind the rally might be fading.
- Bullish Divergence Example: The price falls to a new low, but the Non-Commercial net short position is less extreme (closer to zero) than it was at the previous low. This hints that selling pressure might be easing.
Noting these conflicts is an advanced technique within the commitment of traders report explained analysis.
Analyzing Weekly Changes
Don’t just look at the absolute position levels; pay close attention to the “Change from Previous Report” figures. Did Non-Commercials make a large jump into longs this week? Did Commercials significantly cover shorts? These weekly flows provide valuable clues about the immediate buying or selling pressure influencing the market.
Comparing Commercial vs. Non-Commercial Activity
A classic and often powerful interpretation involves looking for situations where the Commercials and Non-Commercials hold diametrically opposing views, particularly when both groups are at historical extremes. For instance, near significant market bottoms, it’s common to find Commercials at extreme net long levels while Non-Commercials are simultaneously at extreme net short levels. The opposite scenario often occurs near market tops. This stark disagreement between the supposed “insiders” and the large trend-following speculators frequently flags zones ripe for a potential major trend reversal. This dynamic is a critical component of the commitment of traders report explained.
Applying COT Data in Trading Strategies
The commitment of traders report explained offers valuable market context, but it’s crucial to remember it’s not a standalone trading system. Its insights are most powerful when integrated into a broader trading approach that includes price action analysis, technical indicators, and potentially fundamental factors.
Read More: Sentiment Analysis in Forex
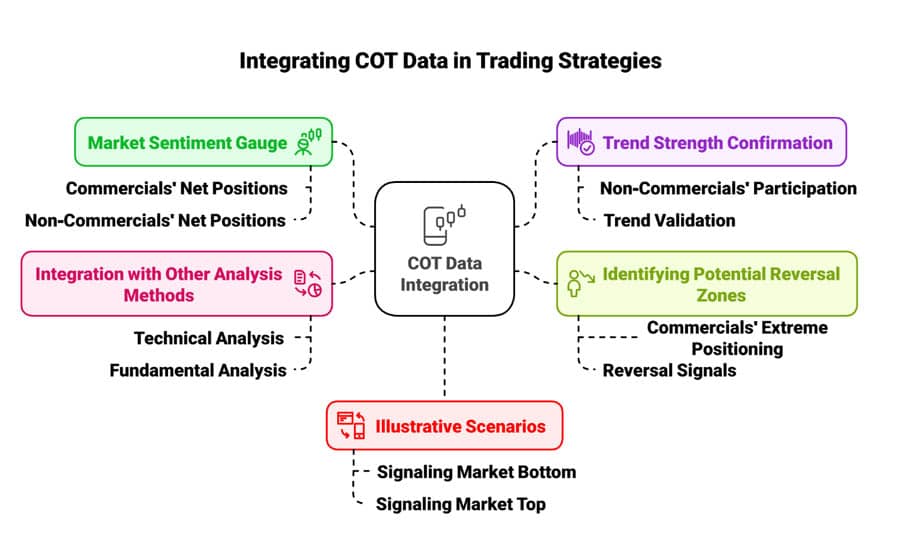
Market Sentiment Gauge
Use the overall positioning, especially the net positions of Commercials and Non-Commercials/Leveraged Funds, to get a background reading on market sentiment. Is the mood predominantly bullish or bearish among the big players? Is sentiment reaching potentially unsustainable extremes? This provides a backdrop for your own trading decisions.
Trend Strength Confirmation
When a market is trending, check if the Non-Commercial group (often acting as trend-followers) is actively participating. If prices are rising and Non-Commercial net longs are also consistently rising, it adds confirmation to the uptrend’s validity. Conversely, if a trend continues but their participation fades or reverses, it may signal weakening conviction behind the move.
Identifying Potential Reversal Zones
Extreme positioning relative to historical norms, particularly by the Commercial category, can serve as an alert for potential trend exhaustion or reversal zones. While not precise timing signals, these extremes indicate that the prevailing sentiment might be overstretched, prompting traders to become more cautious about entering new positions in the direction of the trend and to start actively looking for confirming reversal signals from price action or other indicators.
Integration with Other Analysis Methods
The commitment of traders report explained truly shines when combined synergistically with other analytical tools:
- Technical Analysis: Use COT data to filter or confirm technical signals. For example, a bullish divergence on a momentum indicator coinciding with price testing a key support level becomes a significantly stronger buy signal if the COT report simultaneously shows Commercials near extreme net long levels or Non-Commercials rapidly covering shorts.
- Fundamental Analysis: Consider the COT positioning within the context of the underlying supply and demand fundamentals. If the fundamental outlook is bullish, seeing Commercials reducing their hedges (becoming less net short) adds weight to the positive view. If fundamentals are bearish but speculators are excessively long according to the COT, it highlights a potential vulnerability.
Effective use of the commitment of traders report explained involves layering its insights onto your existing market analysis framework.
Illustrative Scenarios
Consider these typical patterns that help illustrate the commitment of traders report explained in action:
- Signaling a Potential Market Bottom: Imagine a market has been in a steep downtrend. The COT report might show Commercials building up a historically large net long position (suggesting they see value), while Non-Commercials simultaneously reach a historically large net short position (reflecting widespread pessimism or trend-following selling). This clash often occurs near significant lows, signaling potential seller exhaustion and value buying.
- Signaling a Potential Market Top: Conversely, after a strong, extended rally, the COT report might reveal Commercials establishing a historically large net short position (indicating heavy hedging against high prices), while Non-Commercials display a record net long position (showing maximum bullishness and potentially a crowded trade). This opposing extreme often precedes market peaks, signaling potential buyer exhaustion.
Important Limitations and Caveats
While the COT report is a uniquely valuable tool, it’s essential to be aware of its limitations to use it effectively and avoid placing undue weight on its signals. Understanding these caveats is part of having the commitment of traders report explained properly.
- Time Lag: This is perhaps the most cited limitation. The data reflects positions as of the market close on Tuesday, but the report isn’t published until Friday afternoon. Market sentiment and positioning can, and sometimes do, shift significantly during those intervening days (Wednesday, Thursday, Friday morning).
- Not a Precise Timing Tool: The COT report excels at indicating broad sentiment shifts, potential market stress points, and zones where trends might be overextended. However, it does not provide exact entry or exit signals. Markets can remain at “extreme” positioning levels for weeks or even months before a meaningful reversal occurs. Patience and confirmation are key.
- Aggregate Data: The report presents the total net positions for entire categories of traders. It doesn’t reveal the actions or diverse strategies of individual entities within those groups. A “Leveraged Fund” category might contain some funds that are long-term bullish, others short-term bearish, and some employing complex relative value strategies; the report only shows their net aggregate stance.
- Extremes Can Persist and Evolve: Simply reaching a historical extreme in positioning doesn’t guarantee an immediate reversal. Powerful trends, driven by strong fundamentals or momentum, can push positioning far beyond previous records and keep it there. What constitutes an “extreme” can also change over time.
- Futures Market Focus: The commitment of traders report explained here pertains specifically to U.S. regulated futures markets. While these markets heavily influence related cash or spot markets (like spot Forex or physical commodities), the positioning data isn’t a direct, one-to-one reflection, especially for markets like Forex where the OTC spot market is vastly larger. Nevertheless, the sentiment revealed in futures provides valuable insights for traders in related spot markets. Fully understanding “what is the commitment of traders report” includes knowing it’s primarily about futures.
Keeping these limitations in mind helps maintain a balanced perspective on what the commitment of traders report explained can realistically offer.
Read More:Economic Indicators for Forex
Opofinance Services: Enhance Your Trading Edge
As you incorporate sophisticated analytical tools like the Commitment of Traders report, partnering with a supportive and well-equipped broker becomes even more important. Opofinance, regulated by ASIC, offers a robust trading environment designed to complement your informed decisions.
- Advanced Trading Platforms: Choose from the globally recognized MetaTrader 4 and MetaTrader 5, the depth-focused cTrader, or the streamlined OpoTrade platform to match your trading style.
- Innovative AI Tools: Gain unique perspectives with Opofinance’s AI suite, including the AI Market Analyzer for identifying opportunities, the AI Coach for performance feedback, and readily available AI Support.
- Social & Prop Trading: Engage with the trading community via social trading features or explore opportunities to trade larger capital through proprietary trading programs.
- Secure & Flexible Transactions: Benefit from reliable and convenient deposit and withdrawal methods, now including popular cryptocurrency options, all processed efficiently with zero fees charged by Opofinance.
Enhance your trading journey with a broker that provides cutting-edge technology within a secure, regulated framework. Discover how Opofinance supports traders who utilize tools like the commitment of traders report explained here.
Conclusion
In essence, the commitment of traders report explained offers a valuable glimpse into the collective mindset driving futures markets. By dissecting how commercial hedgers, large speculators, and other players are positioned, it provides crucial context that price charts alone cannot convey. Answering “what is the commitment of traders report?” reveals it as a sentiment and positioning tool. Tracking trends, extremes, and divergences in these positions helps gauge conviction and identify potential market turning points. While acknowledging its time lag and other limitations, integrating COT analysis alongside technical and fundamental approaches offers a more comprehensive market view, ultimately aiding more informed trading decisions.
Key Takeaways
- Core Concept: The commitment of traders report explained is a weekly CFTC publication detailing aggregate futures positions by trader type (Commercials, Speculators, etc.).
- Primary Value: It serves as a sentiment indicator, helps assess trend strength, and flags potential reversal zones based on historical positioning extremes. It answers “what is the commitment of traders report showing about market sentiment?”.
- Key Players: Focus on Commercials (hedgers, often contrarian signals at extremes) and Non-Commercials/Leveraged Funds (speculators, often trend-followers).
- Analytical Methods: Analyze Net Positions (longs – shorts), compare to Historical Extremes, watch for Divergences between price and positioning, and note Weekly Changes.
- Practical Use: Combine insights from the commitment of traders report explained with your technical (charts, indicators) and fundamental analysis; it provides context, not standalone signals.
- Important Caveats: Be mindful of the Tuesday-to-Friday data lag, the aggregate nature of the data, and the fact that extreme positioning can persist for extended periods.
- Overall Benefit: Adds significant depth to market analysis by revealing the underlying structure and psychology often hidden by price action alone.
Can the COT report predict exact market tops and bottoms?
No, it’s best not to think of the COT report as a precise market timing tool for pinpointing exact peaks or troughs. While extreme positioning revealed in the commitment of traders report explained often correlates with major turning points, these conditions can last for weeks or months before a reversal actually happens. It’s more effective to use the report to identify potential reversal zones where risk increases, prompting you to seek confirmation from price action and other indicators before acting.
How relevant is the COT report for Forex spot trading?
It’s quite relevant, though indirectly. The report tracks positioning in currency futures, not the huge OTC Forex spot market. However, the big players active in futures (banks, funds) are usually major players in the spot market too. Their collective sentiment and actions captured in the futures data (especially the TFF report) provide strong clues about underlying pressures likely affecting the spot market. So, understanding what is the commitment of traders report shows for currency futures gives spot traders valuable, correlated sentiment information.
Does the COT report cover individual stocks or ETFs?
No, the standard CFTC Commitment of Traders reports focus exclusively on futures contracts and options on those futures. This includes commodities, currencies, interest rates, and broad stock market indices (like S&P 500 futures). The commitment of traders report explained here does not provide positioning data for individual company stocks or Exchange Traded Funds (ETFs). Information on institutional holdings in specific stocks is typically found in different regulatory filings, such as the SEC’s Form 13F.


