

Are you searching for a way to anticipate market shifts before they become obvious? Imagine having a tool that could potentially signal trend reversals and highlight strong trading opportunities early on. This is the essence of divergence in trading. But what is divergence in trading, and how can it improve your trading strategy?
Divergence is a powerful technical analysis technique that reveals disagreements between price action and indicator movements. When price and indicators present conflicting signals, it often suggests a possible change in market momentum. Understanding divergence can give you a significant advantage, enabling you to foresee market turns, refine your trade entries and exits, and ultimately, increase your trading profitability. This detailed guide will explore the world of divergence, examining the different types of divergence in trading, the most effective indicators to use, and practical strategies to incorporate this valuable tool into your trading approach. For traders seeking a dependable platform to implement these techniques, consider a regulated forex broker to ensure a secure and efficient trading experience. Let’s unlock the potential of divergence and transform your trading from reactive to proactive.
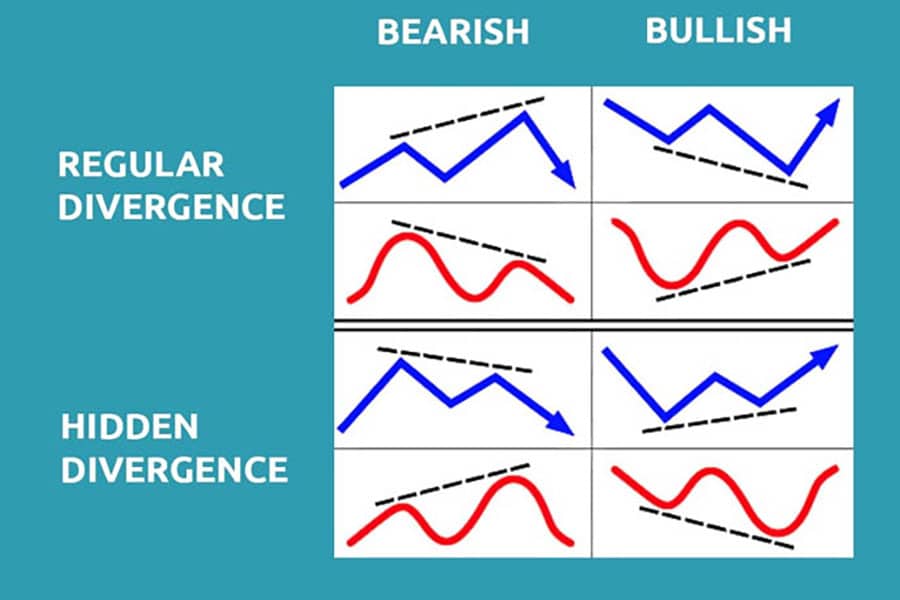
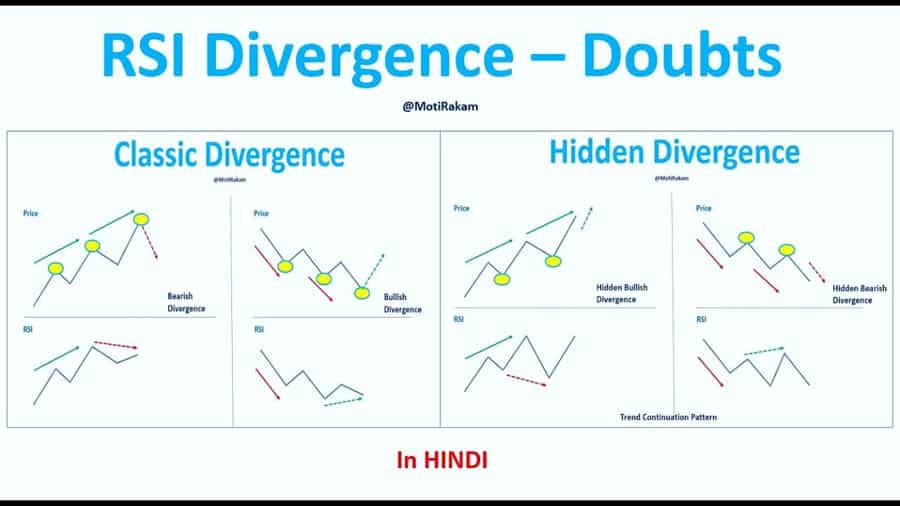
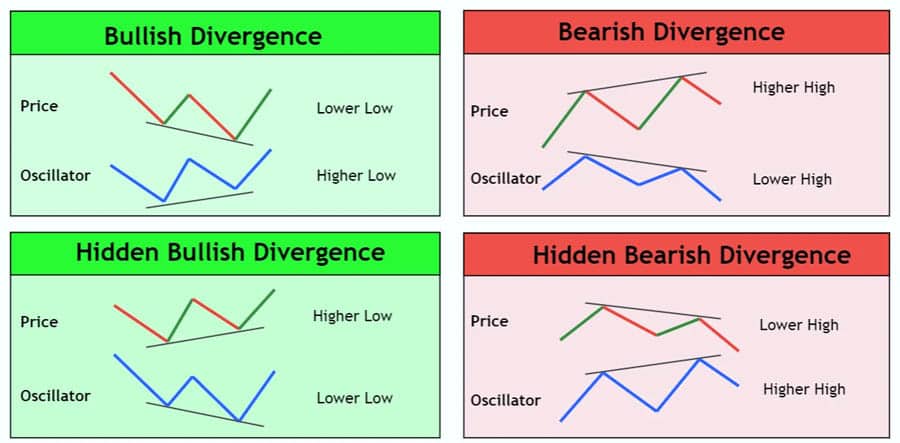
Divergence Types: Regular and Hidden
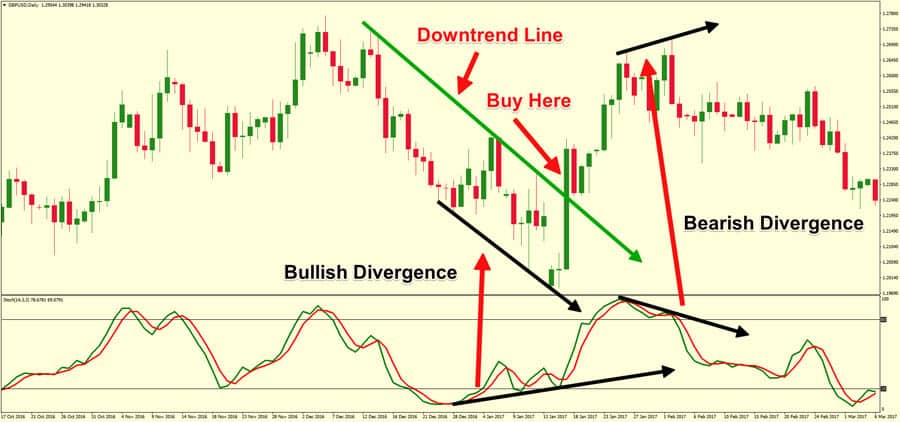
Divergence is fundamentally about identifying discrepancies. In trading, we look for disagreements between an asset’s price and the readings from a technical indicator. This divergence suggests the current price trend might be weakening, and a reversal could be approaching. There are two primary types of divergence in trading that every trader should understand: Regular Divergence and Hidden Divergence. Let’s examine each type to help you identify them effectively.
Regular Divergence: Signaling Potential Trend Reversals
Regular divergence is a classic signal for potential trend reversals. It’s widely recognized and relatively straightforward to identify. There are two forms of regular divergence: Bullish and Bearish regular divergence.
Bullish Regular Divergence: Indicating Potential Uptrends
Bullish regular divergence occurs when the price of an asset makes lower lows, but an indicator, such as the Relative Strength Index (RSI) or Moving Average Convergence Divergence (MACD), makes higher lows. This scenario indicates that while the price suggests continued downward momentum, the indicator signals decreasing selling pressure. It’s like the market trying to push lower, but underlying buying strength is emerging.
For example, imagine a scenario where the price of a stock is moving downwards, creating new lows. Simultaneously, observe the RSI indicator. Instead of also making new lows in sync with the price, the RSI starts to climb upwards, forming higher lows even as the price descends. This is bullish regular divergence. This divergence in trading suggests that despite the price decline, momentum is shifting. Sellers are losing control, and buyers are starting to enter. This bullish regular divergence is a strong signal of a possible upward reversal. Traders often watch for this pattern as a potential entry point to profit from the expected price increase.
Bearish Regular Divergence: Warning of Potential Downtrends
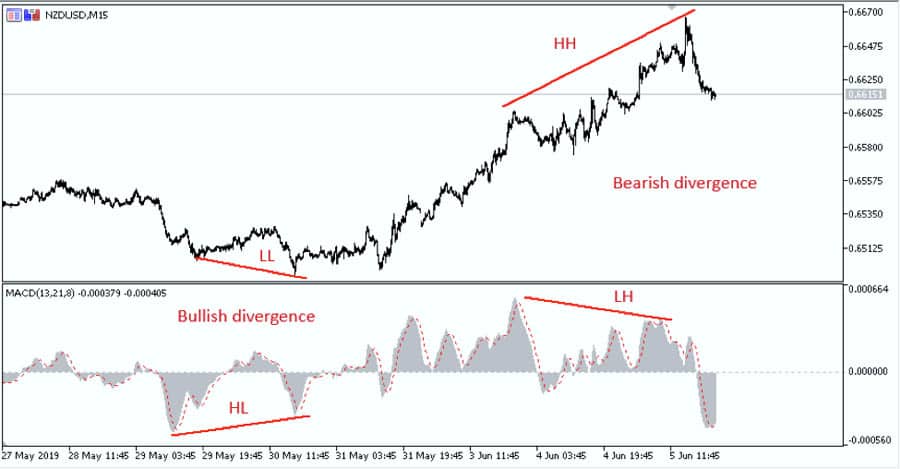
Bearish regular divergence appears when the price of an asset makes higher highs, but the indicator makes lower highs. This situation indicates that while the price is still rising, momentum is weakening. The market is attempting to move higher, but underlying weakness is becoming apparent. This is a key aspect of understanding divergence in trading.
For instance, consider a currency pair in an uptrend, where the price is reaching new highs. Now, look at the MACD indicator. Instead of mirroring the price’s upward movement by also reaching new highs, the MACD starts to decline, forming lower highs even as the price ascends. This is bearish regular divergence. This divergence in trading signals that despite the price increase, upward momentum is fading. Buyers are losing strength, and sellers are preparing to take over. This bearish divergence serves as a warning of a potential downward reversal, prompting traders to consider taking profits or even initiating short positions to capitalize on the anticipated price decline.
Hidden Divergence: Confirming Trend Continuation
Hidden divergence, unlike regular divergence, signals trend continuation rather than reversal. Understanding hidden divergence is valuable for identifying high-probability trend continuation setups. Like regular divergence, hidden divergence also has bullish and bearish forms, both crucial for mastering divergence in trading.
Bullish Hidden Divergence: Fueling Existing Uptrends
Bullish hidden divergence occurs when the price of an asset makes higher lows, but the indicator makes lower lows. This might seem counterintuitive, but it actually indicates strong underlying buying pressure. The price is consolidating or slightly pulling back (making higher lows), but the indicator shows even weaker lows, suggesting buyers are ready to re-enter and push the price higher. This is a powerful signal within divergence in trading.
Consider a commodity price in an uptrend. During a period of consolidation, the price might make a slight dip and then recover to a higher low compared to the previous low. Simultaneously, if you observe the Stochastic Oscillator, you might see it making a lower low during this same consolidation period, before turning upwards. This is bullish hidden divergence. This divergence in trading suggests the consolidation is a pause before the uptrend resumes. Underlying buying pressure remains strong, and the market is poised to continue upwards. Traders often use bullish hidden divergence to add to long positions or initiate new ones, anticipating continued uptrend momentum.
Bearish Hidden Divergence: Reinforcing Existing Downtrends
Bearish hidden divergence arises when the price of an asset makes lower highs, but the indicator makes higher highs. This scenario indicates persistent selling pressure. The price is bouncing slightly during a downtrend (making lower highs), but the indicator shows stronger highs, suggesting sellers are ready to drive the price lower. Recognizing this is key to utilizing divergence in trading effectively.
Imagine an index price in a downtrend. During a brief period of consolidation, the price might bounce upwards slightly, forming a lower high compared to the previous high. At the same time, if you look at the RSI, you might see it making a higher high during this brief bounce, before turning downwards again. This is bearish hidden divergence. This divergence in trading suggests the consolidation is temporary before the downtrend resumes with force. Underlying selling pressure remains dominant, and the market is likely to continue downwards. Traders often interpret bearish hidden divergence as a signal to add to short positions or initiate new ones, expecting continued downtrend momentum.
Read More: difference between margin and leverage in Forex
Key Indicators for Divergence Analysis
While divergence is a concept, you need tools to identify it on charts. Certain technical indicators are particularly effective at highlighting divergence patterns. These indicators typically measure momentum or overbought/oversold conditions, making them ideal for spotting discrepancies between price and indicator movements. Let’s explore some commonly used and powerful indicators for divergence in trading analysis.
Relative Strength Index (RSI): Measuring Momentum Shifts
The Relative Strength Index (RSI) is a momentum oscillator measuring the speed and change of price movements. It ranges from 0 to 100, with readings above 70 generally overbought and below 30 generally oversold. The RSI is well-suited for identifying divergence in trading due to its ability to reflect momentum changes before they fully appear in price action.
The RSI’s sensitivity to price changes allows it to detect subtle momentum shifts not immediately visible on price charts. When price makes new highs or lows, but the RSI fails to follow and instead forms lower highs or higher lows, it strongly indicates divergence. RSI’s overbought and oversold levels can also strengthen divergence signals. For example, bearish divergence in overbought territory (RSI above 70) can be a particularly strong sell signal when using divergence in trading.
Moving Average Convergence Divergence (MACD): Spotting Trend Weakness
The Moving Average Convergence Divergence (MACD) is a trend-following momentum indicator showing the relationship between two moving averages of a security’s price. It includes the MACD line, signal line, and histogram. The MACD is excellent for identifying divergence in trading because it captures changes in both momentum and trend direction.
The MACD’s ability to track moving average convergence and divergence makes it effective at highlighting discrepancies between price and momentum. When price makes new highs or lows, but MACD lines or histogram fail to confirm these moves and show divergence, it signals potential trend weakening. The MACD histogram is particularly useful for spotting divergence in trading, visually representing the difference between the MACD and signal lines, making divergence patterns more apparent.
Stochastic Oscillator: Pinpointing Overbought/Oversold Extremes
The Stochastic Oscillator is another momentum indicator comparing a security’s closing price to its price range over a period. It ranges from 0 to 100, with readings above 80 typically overbought and below 20 typically oversold. The Stochastic Oscillator is useful for identifying divergence in trading in overbought or oversold conditions, often providing early reversal signals.
The Stochastic Oscillator’s focus on price relative to its recent range makes it highly sensitive to potential turning points. When price makes new highs or lows, but the Stochastic Oscillator fails to confirm these moves and shows divergence, especially in overbought or oversold zones, it can be a powerful reversal signal. Both Stochastic Oscillator lines (%K and %D) can identify divergence in trading, with some traders preferring %D line divergence for potentially more reliable signals.
Identifying Divergence: A Step-by-Step Approach
Identifying divergence in trading charts becomes easier with a systematic approach and practice. Here’s a step-by-step guide to help you spot divergence patterns effectively:
- Identify the Trend: Determine the asset’s prevailing trend. Is it an uptrend, downtrend, or sideways? Divergence is most meaningful within established trends.
- Choose Your Indicator: Select an indicator suitable for divergence analysis, like RSI, MACD, or Stochastic Oscillator. Consistency is key; stick with indicators you understand well.
- Look for Price Extremes: Identify recent swing highs and lows in price action. These are the points for comparing price and indicator movements.
- Compare Price and Indicator Movements: Compare the direction of price movement between swing highs/lows with the indicator movement direction over the same period.
- Regular Bullish Divergence: Price lower lows, indicator higher lows.
- Regular Bearish Divergence: Price higher highs, indicator lower highs.
- Hidden Bullish Divergence: Price higher lows, indicator lower lows.
- Hidden Bearish Divergence: Price lower highs, indicator higher highs.
- Confirm with Visual Examples: Practice identifying divergence in trading patterns on historical charts. Look for clear examples of price and indicator divergence. Visual recognition is crucial for quick, accurate divergence spotting in live trading.
Example of Bullish Regular Divergence (Text-Based):
Imagine the price of an asset is in a downtrend. Observe two consecutive price swings that reach lower lows. Now, look at the RSI indicator during the same period. Notice that while the price made those lower lows, the RSI instead made higher lows across the same swings. The price is moving down to new lows, but the RSI is showing increasing strength by making higher lows. This is bullish regular divergence.
Example of Bearish Regular Divergence (Text-Based):
Consider an asset in an uptrend. Observe two consecutive price swings that reach higher highs. Next, examine the MACD indicator over the same period. Notice that while the price achieved those higher highs, the MACD instead made lower highs across the same swings. The price is moving up to new highs, but the MACD is showing weakening momentum by making lower highs. This is bearish regular divergence.
Read More: Divergence scalping strategy
Trading Strategies Incorporating Divergence
Divergence is a practical tool for various trading strategies. Understanding how to use divergence in trading for entry/exit signals, risk management, and combining it with other technical analysis tools is crucial for maximizing its effectiveness.

Entry and Exit Signals Using Divergence
Divergence can provide valuable entry and exit signals, helping you time trades effectively.
Entry Signals:
- Regular Bullish Divergence: Bullish regular divergence can signal a long position entry. Wait for confirmation, like a break above recent resistance or a bullish candlestick pattern, before entering.
- Regular Bearish Divergence: Bearish regular divergence can signal a short position entry. Look for confirmation, like a break below recent support or a bearish candlestick pattern, before entering.
- Hidden Bullish Divergence: Bullish hidden divergence can signal a long position entry in an uptrend. Enter after confirming trend continuation, such as a breakout above minor resistance.
- Hidden Bearish Divergence: Bearish hidden divergence can signal a short position entry in a downtrend. Enter after confirming trend continuation, such as a breakdown below minor support.
Exit Signals:
- Profit Targets: Set profit targets based on risk-reward ratio and potential move suggested by the divergence pattern. For example, target the next significant resistance after a long position based on bullish divergence.
- Stop-Loss Orders: Use stop-loss orders to manage risk. For bullish divergence long positions, place stop-loss below the recent swing low. For bearish divergence short positions, place stop-loss above the recent swing high.
- Divergence Failure: If price action invalidates divergence (e.g., price continues lower lows despite bullish divergence), exit the trade to limit losses.
Risk Management in Divergence Trading
While divergence in trading is powerful, incorporate robust risk management practices.
- Position Sizing: Determine position size based on risk tolerance and account size. Never risk more than a small capital percentage per trade, regardless of divergence signal strength.
- Stop-Loss Orders: Always use stop-loss orders to limit losses. Divergence signals aren’t foolproof, and false signals occur. Stop-loss orders are a safety net.
- Confirmation Signals: Don’t solely rely on divergence signals. Seek confirmation from other technical indicators, price action patterns, or fundamental analysis before trading. Confirmation increases trade success probability and reduces false signal risk in divergence in trading.
Combining Divergence with Other Technical Tools
Divergence works best combined with other technical analysis tools. Confluence – aligning multiple indicators and signals – significantly improves divergence trading strategy accuracy and reliability.
- Trendlines and Chart Patterns: Combine divergence in trading with trendline analysis and chart patterns (triangles, flags, head and shoulders). Divergence at trendline breaks or within chart patterns provides stronger signals.
- Support and Resistance Levels: Look for divergence at key support and resistance levels. Bullish divergence near support and bearish divergence near resistance are potent reversal signals in divergence in trading.
- Candlestick Patterns: Combine divergence with candlestick patterns. Bullish divergence followed by a bullish engulfing pattern is a high-probability long entry. Bearish divergence followed by a bearish engulfing pattern is a high-probability short entry.
- Moving Averages: Use moving averages to confirm trend direction and identify support/resistance areas. Divergence signals aligned with moving average crossovers or bounces are more reliable in divergence in trading.
Pro Tips for Advanced Divergence Traders
- Multi-Timeframe Divergence: Analyze divergence across multiple timeframes. Divergence appearing on higher timeframes carries more weight. Look for confluence of divergence signals across different timeframes for stronger trade setups.
- Divergence with Volume Confirmation: Pay attention to volume during divergence patterns. Increasing volume in the direction of the anticipated price move strengthens the divergence signal. For example, in bullish divergence, look for increasing volume on upswings.
- Refine Indicator Settings: Experiment with different indicator settings to optimize divergence detection for specific assets and timeframes. However, avoid over-optimization, which can lead to curve-fitting.
- Divergence in Conjunction with Fibonacci: Combine divergence with Fibonacci retracement and extension levels. Divergence occurring at key Fibonacci levels can provide high-probability reversal or continuation trade setups.
- Backtesting and Journaling: Rigorously backtest your divergence strategies and keep a trading journal. Analyze your successful and unsuccessful divergence trades to refine your approach and improve your pattern recognition skills.
Read More: MACD Indicator in Forex Trading
Limitations and Risks of Divergence Trading
Divergence is valuable but has limitations and risks. Understanding these pitfalls is crucial for effective use and avoiding common mistakes in divergence in trading.
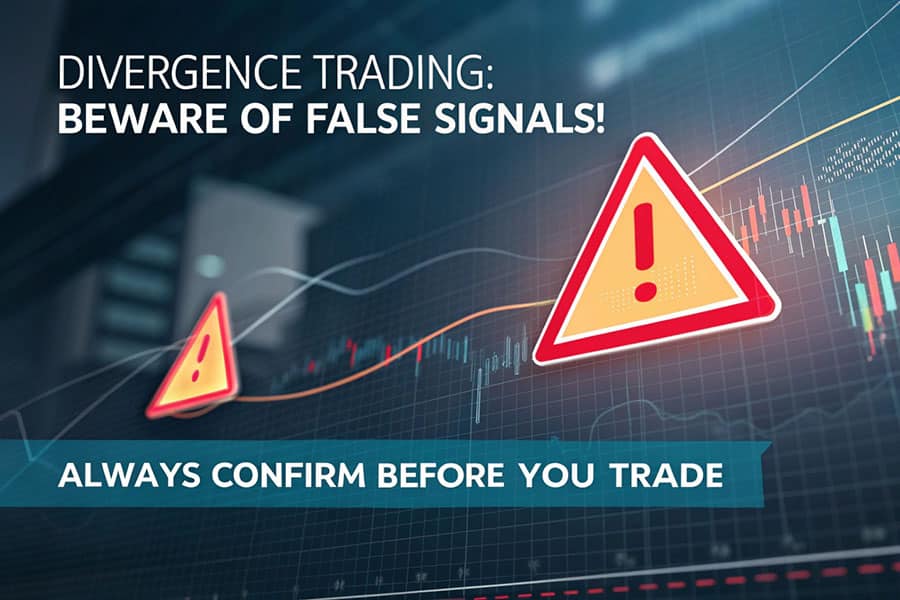
Potential for False Signals
One limitation of divergence in trading is the potential for false signals. Divergence can appear but not lead to the expected price reversal or trend continuation. This is part of market noise and trading uncertainty.
Why False Signals Occur:
- Market Volatility: High volatility can create erratic price movements, leading to divergence patterns that don’t result in significant price changes.
- Timeframe Sensitivity: Divergence pattern reliability varies by timeframe. Shorter timeframes are more prone to noise and false signals than longer timeframes in divergence in trading.
- Indicator Settings: Indicator settings influence divergence pattern appearance. Incorrect settings can lead to false signals.
Mitigating False Signals:
- Confirmation: Always seek confirmation from other technical indicators, price action, or fundamental analysis before acting on a divergence signal in divergence in trading.
- Higher Timeframes: Focus on divergence patterns on higher timeframes (daily, weekly) for potentially more reliable signals.
- Backtesting and Practice: Backtest divergence strategies on historical data and practice identifying patterns on demo accounts to improve accuracy and filter false signals in divergence in trading.
Importance of Confirmation with Additional Indicators
Confirmation is crucial for divergence in trading. Relying solely on divergence signals without confirmation increases risk and lowers trade probability. Using additional indicators to confirm divergence signals enhances trading decision reliability.
Effective Confirmation Indicators:
- Volume: Volume confirms divergence signals. Bullish divergence with increasing volume on rallies strengthens the bullish signal. Bearish divergence with increasing volume on declines strengthens the bearish signal in divergence in trading.
- Moving Averages: Moving average crossovers or bounces confirm divergence signals. Bullish divergence followed by a bullish moving average crossover provides stronger confirmation.
- Trendlines and Chart Patterns: Trendline or chart pattern breakouts in the direction suggested by divergence provide powerful confirmation in divergence in trading.
Market Conditions Affecting Divergence Effectiveness
Divergence effectiveness varies across market conditions. Certain environments can make divergence in trading signals less reliable or misleading. Understanding these conditions and adapting your approach is essential.
Market Conditions to Be Cautious Of:
- Strong Trending Markets: In strong trends, divergence signals can be less reliable. Trend momentum can overpower divergence, leading to false reversals or trend continuations contrary to divergence indications in divergence in trading.
- Choppy or Sideways Markets: In choppy markets, divergence patterns can be abundant but less meaningful. Lack of clear trend direction makes divergence signals less predictive.
- News Events and Fundamental Surprises: Major news or unexpected data releases can override technical patterns, including divergence. Be cautious trading divergence signals around high-impact news events.
Adapting to Market Conditions:
- Trend Strength Assessment: Assess trend strength before relying on divergence signals. In strong trends, reduce reliance on divergence or focus on hidden divergence for trend continuation signals in divergence in trading.
- Market Volatility Awareness: Be aware of volatility levels. In high volatility, be more cautious of divergence signals and use wider stop-loss orders.
- Fundamental Awareness: Stay informed about news events and data releases. Avoid trading divergence signals immediately before or after high-impact news events.
Trade Divergence with Opofinance
For effective divergence in trading, you need a reliable platform. Opofinance, an ASIC-regulated broker, provides an ideal environment for traders to master divergence trading.
- Advanced Trading Platforms: Trade on MT4, MT5, cTrader, and OpoTrade with comprehensive charting tools for divergence analysis.
- Innovative AI Tools: Utilize AI Market Analyzer, AI Coach, and AI Support to identify divergence patterns and refine strategies.
- Social & Prop Trading: Connect with traders and explore prop trading to enhance skills and profitability.
- Secure & Flexible Transactions: Safe deposits and withdrawals, including crypto, with zero fees from Opofinance.
- ASIC Regulation: Trade confidently with an ASIC-regulated broker ensuring security and transparency.

Ready to enhance your trading with divergence and Opofinance?
Start Trading with Opofinance Now!
Conclusion: Enhancing Trading with Divergence Analysis
Divergence in trading is a powerful technical analysis tool to enhance trading precision and profitability. By understanding types of divergence in trading, using indicators like RSI, MACD, and Stochastic Oscillator, and incorporating divergence into strategies, you gain a market edge.
Remember, divergence in trading isn’t a standalone solution. Combine it with other technical tools, practice risk management, and adapt to market conditions. While limitations and risks exist, mastering divergence offers substantial rewards. Embrace divergence, practice, and unlock new trading insights. The market reveals secrets through divergence in trading – are you listening?
Key Takeaways: Divergence Trading Essentials
- Divergence signals trend reversals or continuations by showing price-indicator discrepancies.
- Regular divergence (bullish/bearish) indicates potential trend reversals in divergence in trading.
- Hidden divergence (bullish/bearish) suggests trend continuation in divergence in trading.
- RSI, MACD, and Stochastic Oscillator are effective divergence indicators.
- Combine divergence with other tools and confirmation for accuracy in divergence in trading.
- Manage risk with stop-loss orders and position sizing in divergence in trading.
- Be aware of limitations and false signals in divergence in trading.
- Practice divergence analysis on demo accounts to improve skills.
Can divergence be used in all timeframes, or is it more effective in certain timeframes?
Divergence can be observed and utilized across all timeframes, from short-term charts like 1-minute or 5-minute charts for scalping to longer-term charts like daily or weekly charts for swing or position trading. However, the reliability and significance of divergence signals can vary depending on the timeframe. Generally, divergence signals on longer timeframes (e.g., daily, weekly) tend to be more robust and indicative of more significant and sustained price movements compared to shorter timeframes, which may be more prone to noise and false signals.
Is it possible to have divergence on multiple indicators simultaneously?
Yes, it is indeed possible and, in fact, quite powerful when divergence occurs across multiple indicators concurrently. When you observe divergence on two or more indicators (e.g., RSI and MACD both showing bearish divergence while price makes higher highs), it significantly strengthens the divergence signal and increases the probability of the anticipated price movement materializing. This multi-indicator divergence provides a higher level of confluence and reduces the likelihood of false signals compared to divergence observed on a single indicator alone.
How do I differentiate between a strong divergence signal and a weaker one?
Distinguishing between strong and weak divergence signals involves considering several factors. Stronger divergence signals often exhibit: clearer and more pronounced divergence patterns (larger discrepancies between price and indicator movements), divergence confirmed across multiple indicators, divergence occurring at significant price levels (support, resistance, trendlines), and divergence accompanied by confirming price action and volume patterns. Weaker divergence signals may be less pronounced, lack confirmation from other indicators or price action, or occur in less significant market contexts, making them potentially less reliable for trading decisions.


