

Have you ever looked at a price chart and noticed a sudden jump or fall, leaving a blank space where the price seems to have skipped? These price gaps are pretty common in trading, but they can be confusing. The real challenge is that mistaking one type of gap for another can lead to bad trading decisions – like jumping into a trend right before it reverses or missing the start of a big move.
This confusion can be costly, particularly when you’re navigating the markets with your forex trading broker. This article aims to clear things up by comparing two important types: the Exhaustion Gap and the Breakaway Gap. We’ll explore the crucial differences in the exhaustion gap vs breakaway gap debate to help you make smarter trading choices.
What is a Price Gap in Trading?
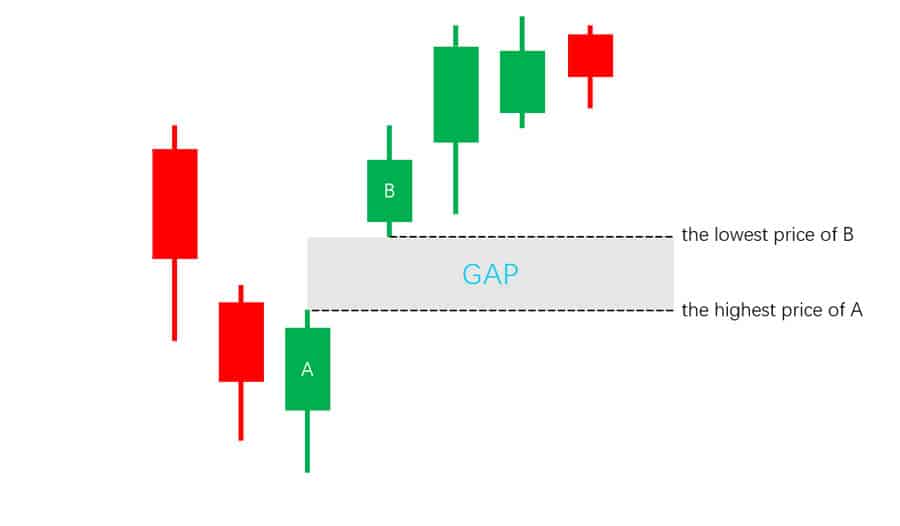
So, before we get into the specifics, what exactly is a price gap? In simple terms, it’s a break on the price chart where no trading actually happened. You’ll see it as an empty space between the closing price of one trading period (like a day) and the opening price of the next. These usually pop up between trading sessions, like overnight or over a weekend.
Why do they happen? Several things can cause them:
- Big News: Major global news, important economic updates (think job reports or interest rate changes), or unexpected company news can dramatically change how people feel about the market while it’s closed.
- Earnings Surprises: When a company reports earnings that are much better or worse than expected, its stock price often gaps up or down when the market reopens.
- Sentiment Swings: Sometimes, the general mood of the market just shifts overnight based on what’s happening elsewhere in the world.
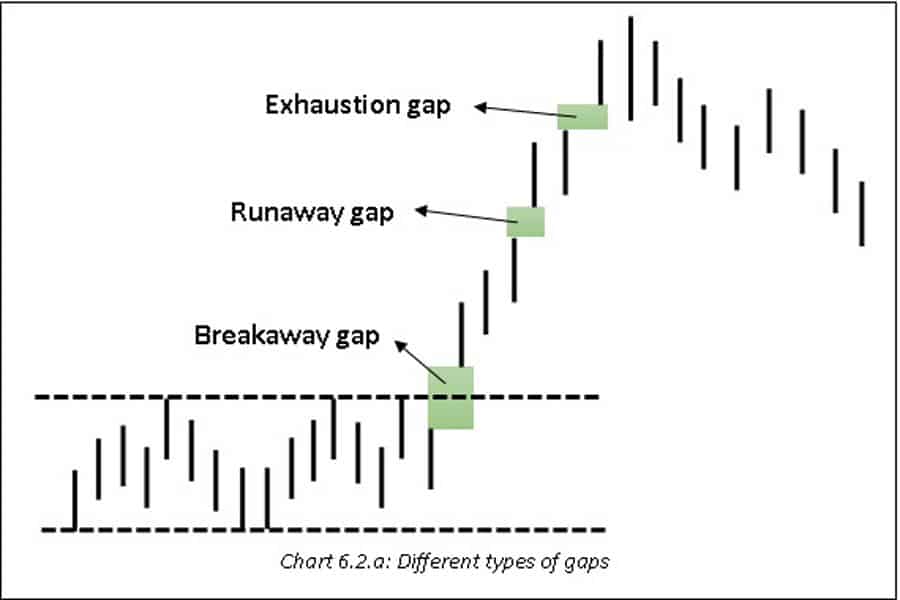
Technical analysts don’t just see these as random jumps. They classify gaps based on where they appear in a price trend and what they might mean. The main categories are:
- Common Gaps: These often show up when prices are moving sideways and usually get filled (price goes back through the gap area) fairly quickly. They aren’t typically big signals.
- Breakaway Gaps: These signal a potential new trend starting, happening when price breaks out of a holding pattern.
- Runaway (or Continuation) Gaps: Found in the middle of a strong trend, suggesting the trend has more room to run.
- Exhaustion Gaps: Appear near the end of a strong trend, hinting that the trend might be running out of gas and could reverse.
This article zooms in on the key differences between the exhaustion gap vs breakaway gap, as correctly identifying these two can be particularly important for catching major market shifts.
Read More: Breakout Trading Strategy
Understanding the Breakaway Gap
Think of a Breakaway Gap as the market making a powerful statement. It’s a price gap that happens when the price decisively moves out of a consolidation zone (where price has been stuck) or pushes past a major support or resistance level. It’s like the market finally breaking free from indecision.
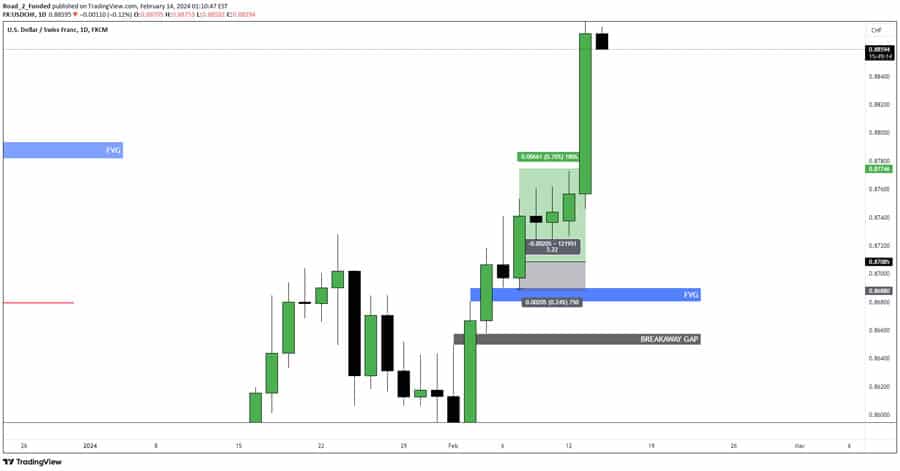
This type of gap usually signals the potential start of a fresh trend – either upwards (bullish) if it gaps above resistance, or downwards (bearish) if it gaps below support. It shows a clear shift in who’s in control: buyers or sellers.
Characteristics of Breakaway Gaps
- Follows Consolidation: They don’t just appear randomly. Breakaway gaps come after the price has been trading sideways for a while, maybe in a range, triangle, or similar pattern. The longer the sideways action, the more significant the breakout tends to be.
- Breaks Important Levels: The gap punches through a clear technical boundary – a support/resistance line, a trendline, or the edge of a chart pattern. The gap itself highlights the force of the break.
- Volume Boost: Ideally, a strong Breakaway Gap happens with a noticeable increase in trading volume. High volume on the gap day suggests lots of traders are backing the move, giving it more credibility. While it can happen on average volume, high volume is a stronger confirmation.
- Sentiment Shift Indicator: It clearly shows that the balance has tipped. In a bullish breakaway, buyers are firmly in charge. In a bearish one, sellers have taken over.
- Less Likely to Fill Quickly: Compared to other gaps, Breakaway Gaps often don’t get filled (price returning to close the gap) right away. The gap area itself frequently becomes a new support level (for upward gaps) or resistance level (for downward gaps). This resistance to being filled is a key point when comparing the breakaway gap vs exhaustion gap.
Understanding the Exhaustion Gap
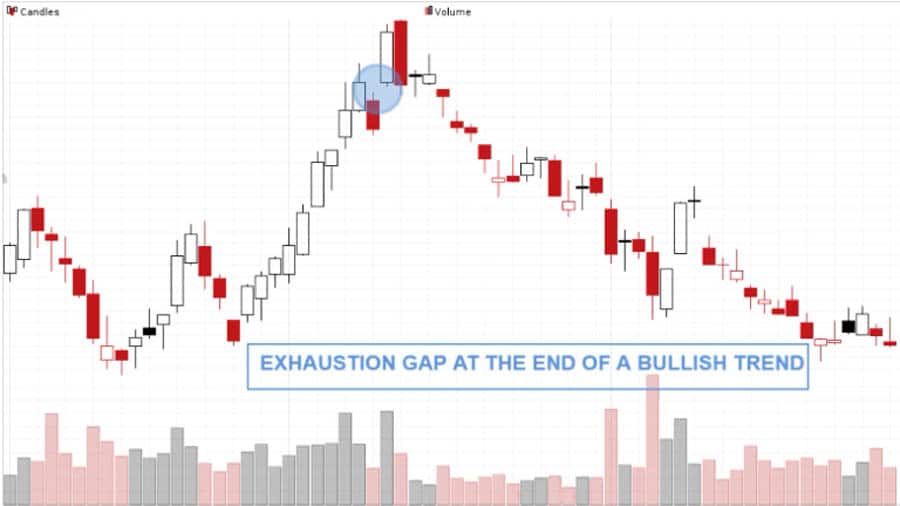
If the Breakaway Gap signals the start of a strong move, the Exhaustion Gap often flags its potential end. An Exhaustion Gap is a price gap that shows up late in a well-established trend, suggesting the momentum driving that trend is fading.
Think of it as the last big push (in an uptrend) or the final wave of panic selling (in a downtrend) before the price potentially turns around. It often happens because the trend has gone on for so long that it attracts the last group of less-informed traders or forces the remaining weak holders to finally give up.
Characteristics of Exhaustion Gaps
- Appears Late in the Game: You find these after a long and often steep price run. The trend has been going for a while and might have even sped up recently.
- Final Surge or Capitulation: In an uptrend, it looks like one last burst of buying excitement. In a downtrend, it looks like peak panic selling. This gap often sets a new extreme high or low for the trend right before things change.
- Volume Spike (Usually): Exhaustion Gaps are very often linked to extremely high trading volume – sometimes called “climactic volume.” This reflects intense emotion: the last buyers jumping in near the top or the final sellers panicking out at the bottom. But context is key – sometimes an exhaustion gap can happen on lower volume if everyone who was going to participate already has. Look for a noticeable spike or change in volume followed by a reversal.
- Likely to Fill Quickly: This is a major difference when discussing the exhaustion gap vs breakaway gap. Exhaustion Gaps tend to get filled relatively fast as the price reverses. The gap being closed acts as confirmation that the ‘exhaustion’ signal was probably right.
- Participants Tapped Out: The gap suggests that pretty much everyone who wanted to buy (in an uptrend) or sell (in a downtrend) has already done so. There aren’t many people left to keep pushing the price in the same direction, making a reversal more probable.
Key Differences: Exhaustion Gap vs Breakaway Gap
Getting a handle on the unique traits of each gap type is essential for reading market signals accurately. Although both are price breaks, what they suggest about the market can be completely opposite. Let’s directly compare the key differences in the exhaustion gap vs breakaway gap discussion:
Timing and Location in Trend
- Breakaway Gap: Happens right at the start of a potential new trend, usually breaking out from a period of sideways movement or a key price level. It signals initiation.
- Exhaustion Gap: Occurs near the end of a mature, long-running trend, after price has already moved significantly. It signals a potential end or climax.
What the Signal Means
- Breakaway Gap: Suggests the beginning of a possibly strong move in the direction of the gap. It implies strength and follow-through after the breakout.
- Exhaustion Gap: Hints at a potential reversal of the current trend. It suggests the move is finishing up due to weakening momentum or a final emotional surge.
Volume Clues
- Breakaway Gap: Best confirmed by high and rising trading volume. This supports the idea that the breakout is genuine and has strong backing.
- Exhaustion Gap: Often linked to extremely high, climactic volume on the gap day or the reversal day that follows. This points to peak emotion. However, it can sometimes happen on lower volume if participation has truly dried up. Volume context and what happens next are crucial.
Likelihood of Being Filled
- Breakaway Gap: Less likely to be filled soon. The gap area often turns into a support (bullish gap) or resistance (bearish gap) zone. A quick fill usually cancels the breakout signal.
- Exhaustion Gap: More likely to be filled quite quickly, often within days. The price reversing to close the gap helps confirm the exhaustion signal. This difference is a vital part of the breakaway gap vs exhaustion gap comparison.
Market Psychology Behind Them
- Breakaway Gap: Shows strong belief and a clear change in market feeling. Traders are confidently taking new positions in the direction of the break.
- Exhaustion Gap: Represents emotional peaks – either excitement bringing latecomers in at the top, or panic forcing sellers out at the bottom. It often catches less experienced traders on the wrong side just before the turn.
Recognizing these differences is fundamental when looking at charts and deciding if a gap is a chance to join a new trend or fade an old one. The context—where the gap occurs in the bigger market picture—is critical for telling the difference between an exhaustion gap vs breakaway gap.
Read More: Advanced Forex Charts: Types and Analysis of Each
How to Identify Breakaway Gaps
Spotting a Breakaway Gap as it happens involves looking at the chart pattern, checking the volume, and watching what the price does immediately after. You’re looking for signs that control has genuinely shifted in the market.
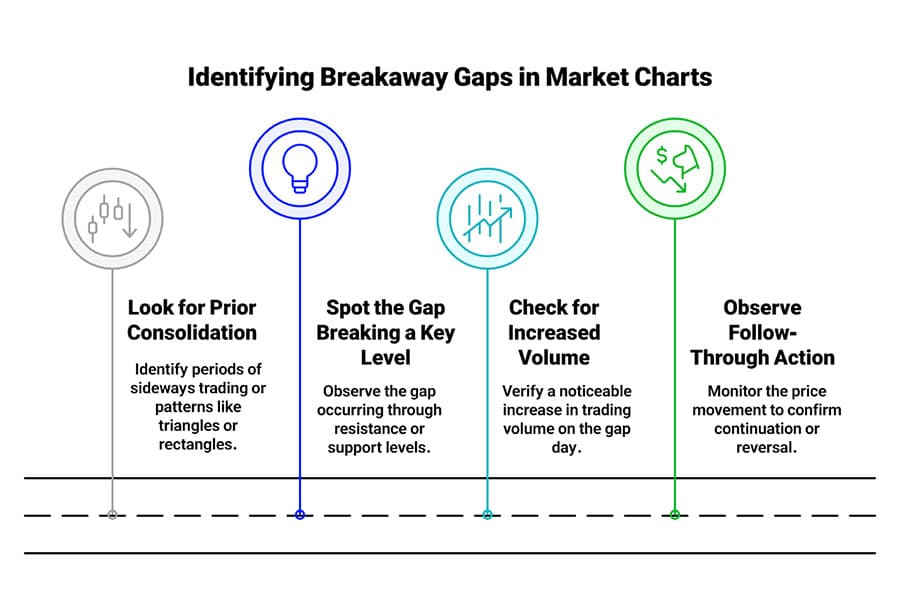
Look for Prior Consolidation
Breakaway gaps emerge from defined chart setups. Look for times when the price was stuck trading sideways in a range or forming patterns like triangles or rectangles. Note the support and resistance levels of this holding pattern.
Spot the Gap Breaking a Key Level
The defining feature is the gap itself occurring through one of these boundaries. A bullish gap jumps above resistance; a bearish gap drops below support. The empty space of the gap visually highlights the breakout’s strength.
Check for Increased Volume
Ideally, the day the breakaway gap forms should have noticeably higher trading volume than the days before it during the consolidation. This surge shows strong interest and belief in the new direction. High volume makes the signal more reliable.
Observe Follow-Through Action
Confirmation comes from what happens next. Does the price keep moving in the direction of the gap? If it pulls back slightly, does it find support (for bullish gaps) or resistance (for bearish gaps) near the edge of the gap? Strong continuation reinforces the signal. If the price quickly reverses and fills the gap, the breakout might be false.
How to Identify Exhaustion Gaps
Finding an Exhaustion Gap means understanding the stage of the current trend and looking for signs of tiredness or a final climax. It can be trickier than spotting a breakaway because it might initially look like the trend is just continuing strongly (a Runaway Gap).
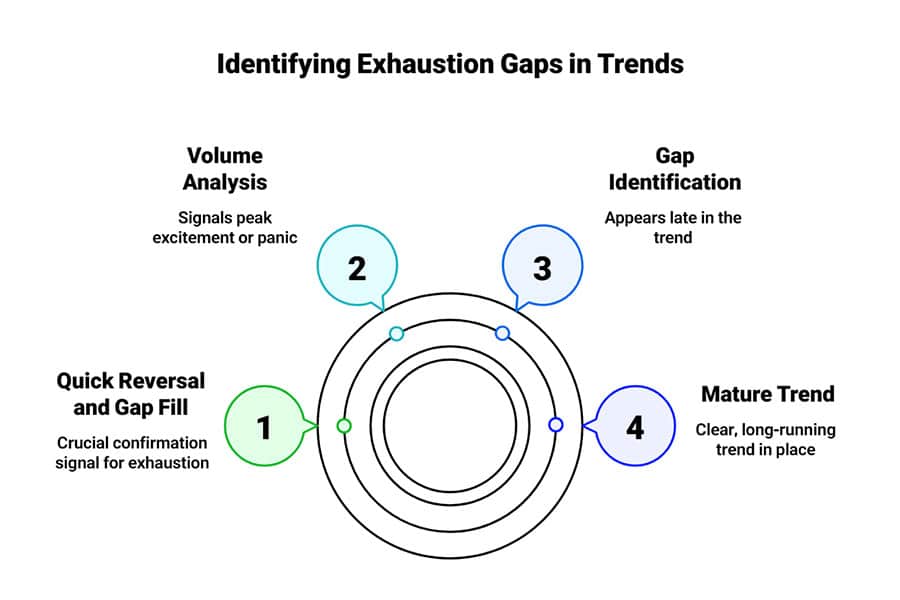
Identify a Mature Trend
First, make sure there’s a clear, long-running trend already in place. Exhaustion gaps don’t usually happen early on. Look for trends that have already made a big move, maybe even accelerating sharply near the end.
Look for a Gap Late in the Trend
The gap appears in the same direction as the trend but after a significant price run. It often sets a new high (in an uptrend) or low (in a downtrend) but feels like a final effort.
Analyze Volume for Climax Signals
Check the volume on the day the gap occurs. Look for unusually high volume, perhaps the highest in recent trading. This “climactic” volume suggests peak excitement or panic. Alternatively, sometimes very low volume on the gap day can signal exhaustion, meaning there’s no one left to push the trend. Context is key – compare the volume to recent averages. Also, watch the volume on the reversal day – often, the day after the gap, a sharp reversal happens on high volume, helping confirm the exhaustion.
Watch for a Quick Reversal and Gap Fill
This is a crucial confirmation signal. Unlike breakaway gaps, exhaustion gaps often get closed quickly. Look for the price to stall soon after the gap and then turn around sharply, usually starting to fill the gap within one to three trading days. The faster the fill, the stronger the signal. This quick fill is a defining trait in the exhaustion gap vs breakaway gap distinction.
Consider Momentum Indicators
Tools like the RSI (Relative Strength Index) can help. An exhaustion gap at a market top might happen when the RSI is deep in overbought territory (like above 70). An exhaustion gap at a bottom might occur with the RSI deeply oversold (below 30). Divergence (where price makes a new high/low but the indicator doesn’t) can also be a warning.
Read More: Forex gap trading strategy
Exhaustion Gap vs. Runaway Gap
One of the toughest parts of gap analysis is telling an Exhaustion Gap apart from a Runaway (or Continuation) Gap in real time. Both happen within an existing trend, but they signal opposite things.
A Runaway Gap pops up roughly in the middle of a trend and suggests the trend is still strong and likely to keep going. It shows healthy interest from traders who believe in the trend’s direction. These gaps often have decent volume but not necessarily the extreme spike seen with exhaustion.
The challenge is that when a gap appears late in a trend, it could be the final exhaustion move, or it could just be another runaway gap signaling more gains (or losses) before the real end. Often, you can only be sure which it was by looking back later.
Key Differentiators (Often Seen After the Gap)
- Volume: While both might have increased volume, the truly extreme, “blow-off” volume is more typical of exhaustion.
- Price Action After: This is usually the best clue. After a Runaway Gap, the price tends to keep going strongly in the trend direction. After an Exhaustion Gap, the price stalls and reverses quickly, starting to fill the gap.
- Trend Maturity: Runaway gaps tend to occur when the trend still feels strong, while exhaustion gaps happen when the trend looks stretched or has been running for a long time.
Because it’s tricky, many traders wait for confirmation (like the gap starting to fill) before trading against the trend based on a suspected exhaustion gap. Misinterpreting these is a common mistake when trying to understand the wider picture of gap analysis, including the exhaustion gap vs breakaway gap relationship.
Trading Strategies

Knowing how to spot these gaps is the first step. Trading them effectively requires a solid plan covering entry point, where to place stop-losses, and what confirmation signals to look for. Always remember that no trading signal is perfect, and managing risk is crucial.
Trading Breakaway Gaps
Since Breakaway gaps often signal the start of a new trend, they fit well with trend-following strategies.
- Entry Ideas:
- Early Entry: Jump in near the end of the gap day if the gap holds and volume looks good. Quickest entry, but higher risk if it fails.
- Pullback Entry: Wait for the price to dip back towards the gap area. Enter if it finds support/resistance there and starts moving in the breakout direction again. Better risk/reward, but you might miss the move if it takes off immediately.
- Confirmation Entry: Wait for another candle to close further in the breakout direction before entering.
- Setting Stop-Losses:
- Bullish Gaps: Place stops below the bottom of the gap or the broken resistance level.
- Bearish Gaps: Place stops above the top of the gap or the broken support level.
- Confirmation: Look for continued movement, good volume on days moving with the trend, and the gap area acting as support/resistance.
Trading Exhaustion Gaps
Exhaustion gaps suggest a trend might be ending, making them potential plays for reversal (counter-trend) strategies. But be careful – you don’t want to mistake it for a runaway gap.
- Strategy Focus: This is usually about betting on a reversal.
- Entry Ideas:
- Wait for Confirmation: Don’t jump in right away. Look for proof the trend is turning.
- Gap Fill Entry: Enter once the price reverses and starts closing the gap. For example, go short when a bullish exhaustion gap is partially filled on the way down.
- Reversal Pattern Entry: Look for candlestick reversal patterns (like an engulfing candle) after the gap, then enter based on that pattern’s confirmation.
- Setting Stop-Losses:
- Fading Bullish Exhaustion (Shorting): Stop-loss above the high made on the gap day.
- Buying Bearish Exhaustion (Going Long): Stop-loss below the low made on the gap day.
- Why Confirmation Matters: Since it could be a runaway gap, getting confirmation is extra important here. Watch for the gap filling, high volume on the reversal, and maybe oscillator divergences. Acting too soon can hurt if the trend keeps going. Understanding the exhaustion gap vs breakaway gap helps tailor these approaches.
Explore Advanced Trading with Opofinance
Having the right broker is key when using technical analysis, like identifying the nuances between an exhaustion gap vs breakaway gap. Opofinance, regulated by ASIC, provides a strong platform for traders.
- Advanced Trading Platforms: Use top platforms like MetaTrader 4 (MT4), MetaTrader 5 (MT5), cTrader, and the intuitive OpoTrade platform.
- Innovative AI Tools: Get ahead with tools like the AI Market Analyzer for insights, an AI Coach to refine strategies, and AI Support when you need help.
- Social & Prop Trading: Connect with others through Social Trading or explore funded trading opportunities with Prop Trading programs.
- Secure & Flexible Transactions: Enjoy safe and easy deposits and withdrawals, including crypto options, with zero fees charged by Opofinance.

Want to step up your trading with advanced tools and dependable service?
Conclusion
Telling the difference between an exhaustion gap vs breakaway gap is a really useful skill for any technical trader. Although they both look like breaks in price, they signal very different things. Breakaway gaps usually kick off a new trend with force, often backed by strong volume, and tend to resist being filled quickly. Exhaustion gaps, on the other hand, often signal that a long-running trend is tired and might reverse soon.
They frequently occur on massive volume and tend to get filled as the price turns. Always look at the context – where the gap happens in the trend, the volume, and what the price does next. Getting this right helps you make better trading decisions and manage risk more effectively.
Key Takeaways
- Price Gaps: Chart areas with no trades, usually caused by overnight news or sentiment shifts.
- Breakaway Gap: Starts a new trend, breaks from consolidation, often high volume, less likely to fill fast. Signals initiation.
- Exhaustion Gap: Ends a mature trend, happens after a long run, often climactic volume, likely to fill fast on reversal. Signals termination.
- Core Difference (Exhaustion Gap vs Breakaway Gap): Timing (end vs start of trend) and signal (reversal vs start/continuation).
- Identification: Needs context (trend stage), volume analysis, and confirmation from price action after the gap.
- Trading: Breakaways fit trend-following; Exhaustions fit reversal plays (wait for confirmation!).
- Watch Out: Telling Exhaustion from Runaway gaps live is hard; confirmation is key for reversal trades.
What happens if a potential Breakaway Gap gets filled quickly?
If a gap that initially looks like a Breakaway Gap (breaking a key level out of consolidation) is filled quickly (within a few trading sessions), it often invalidates the breakout signal. This is known as a ‘failed breakout’ or a ‘gap trap’. It suggests the initial move lacked genuine conviction, and the price is likely to return to its previous consolidation range or even reverse further. Traders who entered on the initial gap might consider exiting their position quickly if the gap fills.
Can Average Volume Accompany a Valid Exhaustion Gap?
Yes, while climactic high volume is common with Exhaustion Gaps (signifying peak emotion), they can sometimes occur on average or even below-average volume. In this context, low volume might signify true exhaustion – a point where participation has completely dried up, and there’s simply no energy left to push the trend further. The confirmation, as always, lies in the subsequent price action: a swift reversal and the filling of the gap are still required to validate it as exhaustion, regardless of the volume during the gap itself.
Is it possible for a gap to have characteristics of both?
Generally, a single gap functions as either a signal of initiation (Breakaway) or termination (Exhaustion) based on its context within the trend structure. However, market analysis can be complex. A very strong gap might break a long-term consolidation level (suggesting Breakaway) but occur after a very rapid, near-vertical run within that consolidation (which might hint at Exhaustion). In such ambiguous cases, traders must rely heavily on subsequent price action and volume over the next few sessions to clarify the gap’s true nature. Waiting for confirmation becomes even more crucial in these less clear-cut scenarios.


