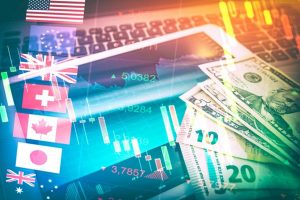

Advanced Forex Charts
Forex trading, or the exchange of one currency for another on a decentralized global market, relies heavily on chart analysis. Advanced charting techniques are crucial for traders looking to gain a competitive edge by analyzing complex market dynamics. This article elaborates on the realm of advanced Forex charts, exploring different types, their functionalities, and practical applications in trading strategies.
Understanding Forex Charts
The Role of Forex Charts
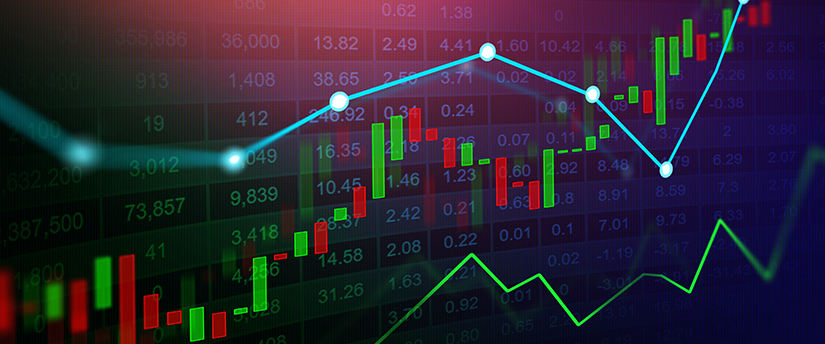
Forex charts are essential tools that visually represent the price movements between currency pairs over specific time intervals. These charts are pivotal for traders to understand past market behaviors, analyze current trends, and forecast future movements. By studying Forex charts, traders can identify patterns and indicators that help in making informed trading decisions.
Basic Chart Types
Before exploring advanced charts, it’s essential to understand forex charts for beginners:
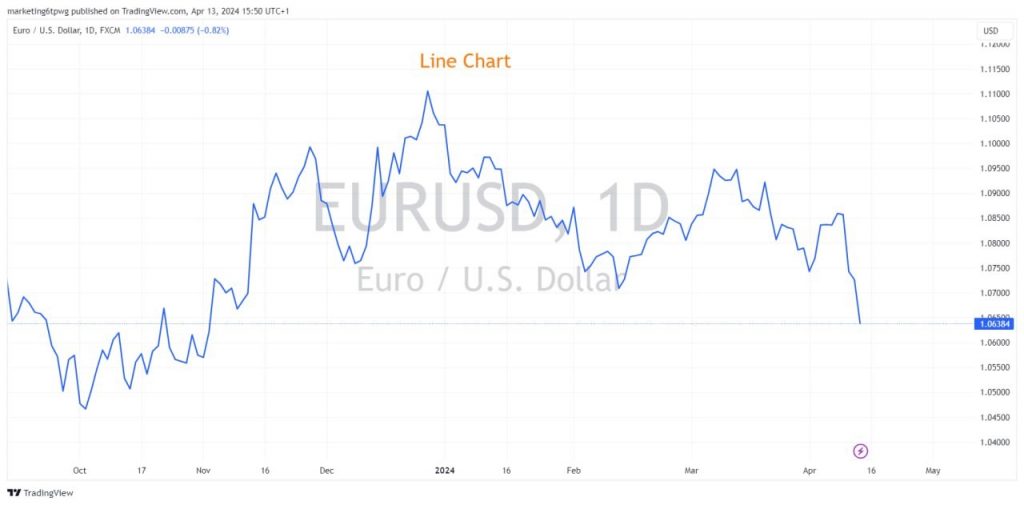
- Line Charts: In the simplest form, a line chart connects single prices for each selected time period (usually closing prices) with a line. This type provides a clear view of the overall market trend by smoothing out minor fluctuations.
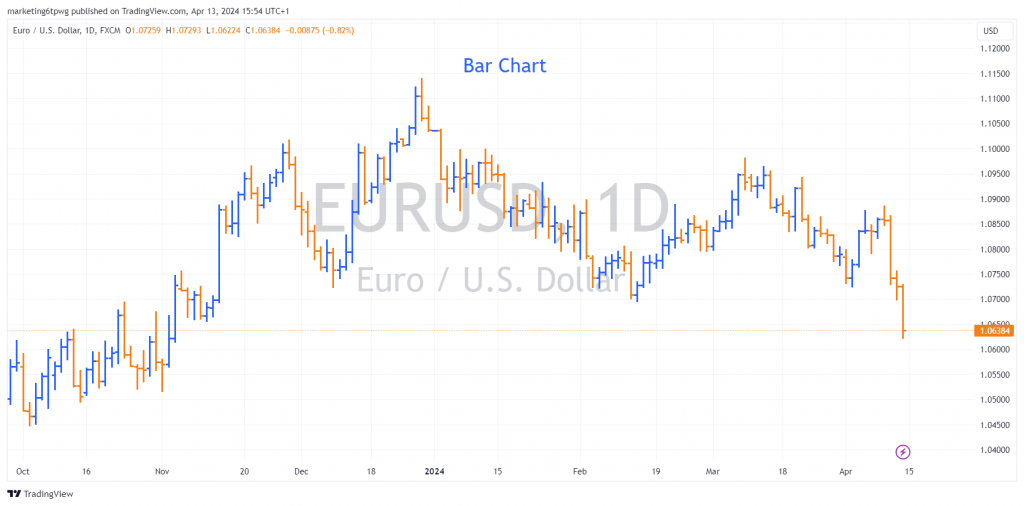
- Bar Charts: More informative than line charts, bar charts show the opening, high, low, and closing prices (OHLC) for each period. Each bar represents market performance in a single period, with the left tick showing the opening price and the right tick the closing price.
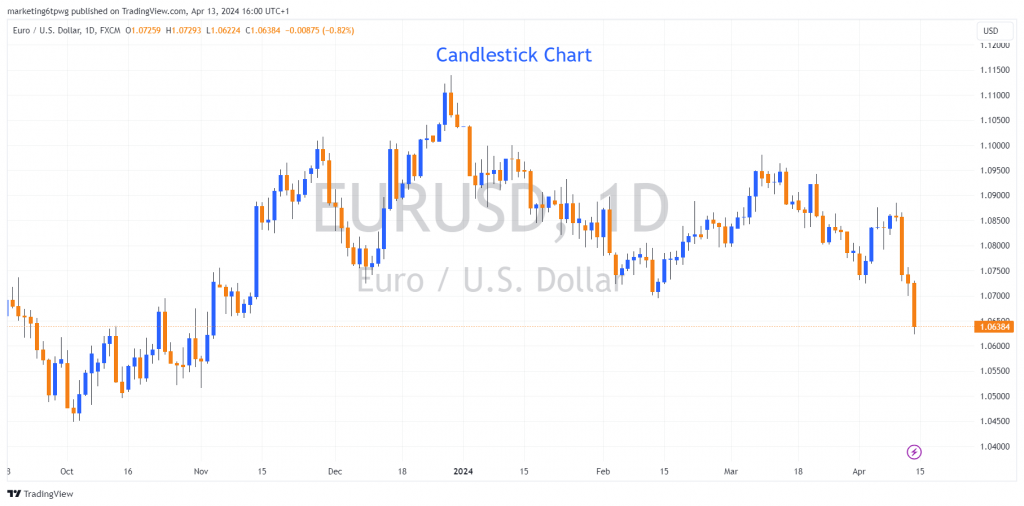
- Candlestick Charts: Developed in Japan over 200 years ago, candlestick charts offer a detailed view of market psychology. Each “candle” shows the open, high, low, and close, with the body’s color indicating whether the closing price was higher or lower than the opening price.
Types of Advanced Forex Charts
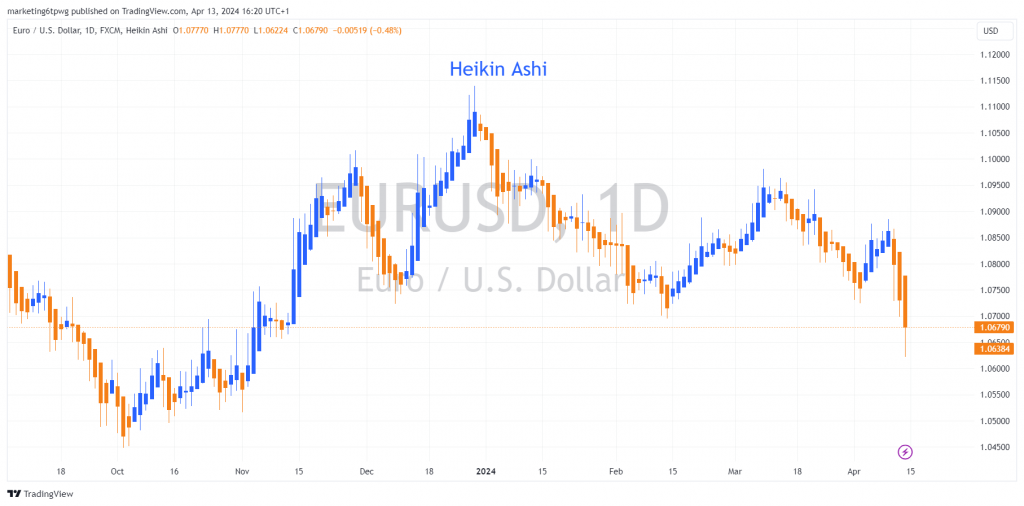
Heikin Ashi Charts
Originating from Japan, Heikin Ashi charts are a variant of candlestick charts that integrate the concept of averaging. By modifying the formula used to calculate the bars, these charts produce a smoother representation of price action. This smoothing helps traders identify the prevailing trend and potential reversal points with greater ease, making it a favorite among trend traders.
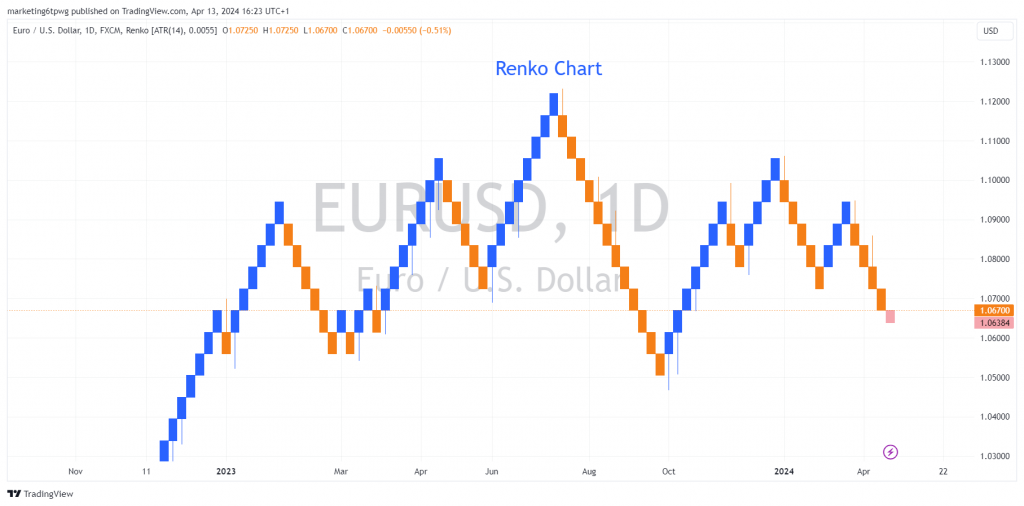
Renko Charts
Renko charts, also from Japan, are unique in that they focus solely on price movement, disregarding time and volume entirely. A new “brick” is only drawn when the price moves a specified amount, which helps in filtering out minor price movements and noise. Renko charts are particularly useful for traders focusing on significant trends and avoiding false signals during sideways market movement.
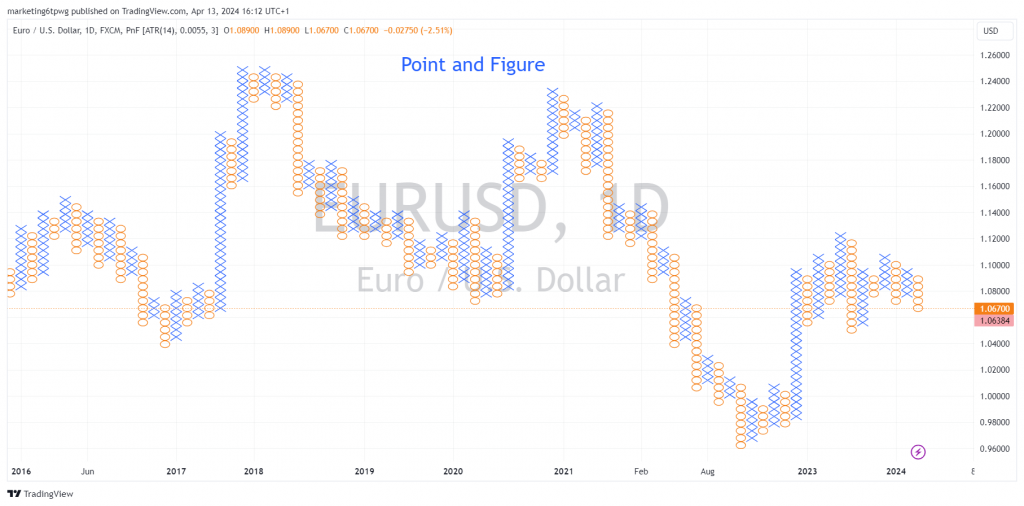
Point and Figure Charts
Point and Figure (P&F) charts are distinguished by their focus on significant price movements while ignoring time and smaller price changes. This type of charting is beneficial for traders who are interested in clear signals of support and resistance levels without the distraction of insignificant price fluctuations. P&F charts are excellent for identifying breakout points and major trend reversals.
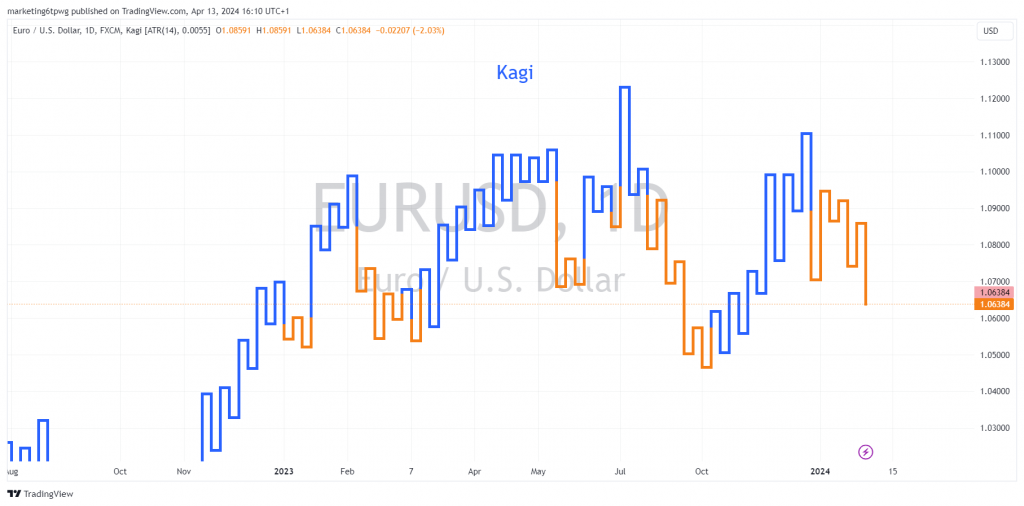
Kagi Charts
Kagi charts provide a visual representation of market conditions through a series of vertical lines that change direction based on price movements. These charts ignore time and focus on price, with the thickness of the lines changing in response to market conditions. This helps traders in discerning between standard market fluctuations and significant shifts that could indicate entry or exit points.
Advanced Charting Techniques for Forex Trading
Chart Patterns Recognition
Advanced charts help traders recognize key patterns, each with specific implications:
- Head and Shoulders: Suggests a reversal of a current trend.
- Triangles: Depending on the breakout direction, can indicate continuation or reversal.
- Flags and Pennants: Often indicate a brief consolidation before a strong trend continues.
Trend Analysis Techniques
Advanced charts are indispensable for trend analysis. Techniques such as moving averages, trendlines, and channels help traders determine the strength and direction of market trends. These tools can also help identify stable trends or early signs of reversal.
Use of Indicators and Oscillators
Incorporating technical indicators into advanced charts enhances predictive accuracy. These indicators help confirm trend predictions and can signal potential trade entries and exits based on observed anomalies and patterns.
Must-Know Indicators
- Moving Average (MA): A moving average smoothing out price data by creating a constantly updated average price. It helps identify the direction of the trend and potential support and resistance levels.
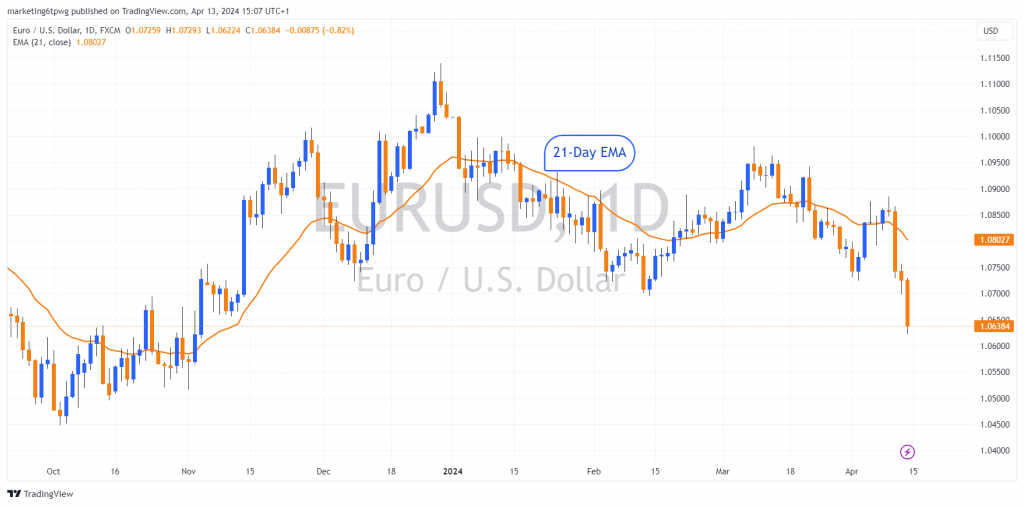
- Exponential Moving Average (EMA): Similar to the simple moving average, the exponential moving average places greater weight on more recent data, making it more responsive to new information. It’s used to capture trends earlier than the simple MA.
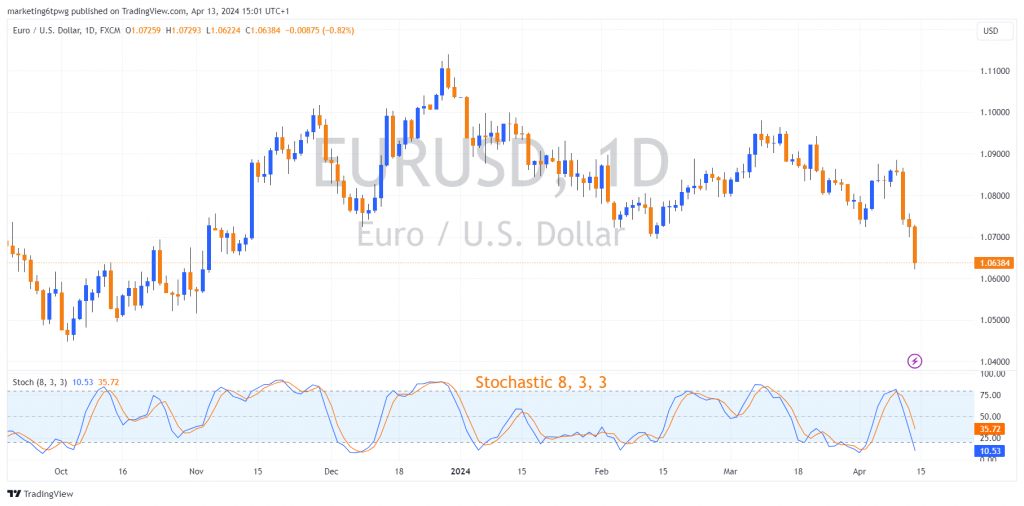
- Stochastic Oscillator: This momentum indicator compares a particular closing price of a currency to a range of its prices over a certain period. It helps identify overbought and oversold conditions.
- Moving Average Convergence Divergence (MACD): This trend-following momentum indicator shows the relationship between two moving averages of prices. MACD is used to spot changes in the strength, direction, momentum, and duration of a trend in a currency’s price.
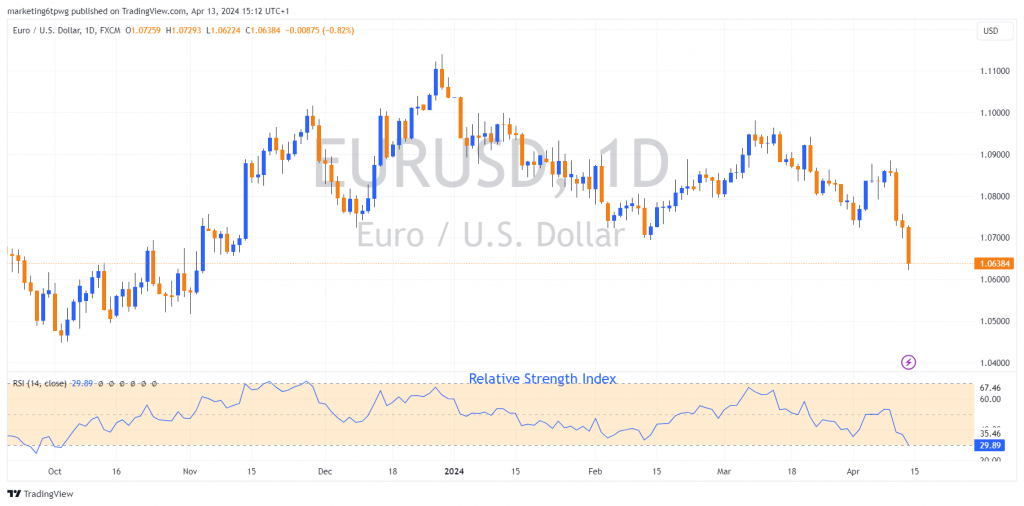
- Relative Strength Index (RSI): RSI measures the speed and change of price movements on a scale of 0 to 100. It is commonly used to identify overbought or oversold conditions in a market.
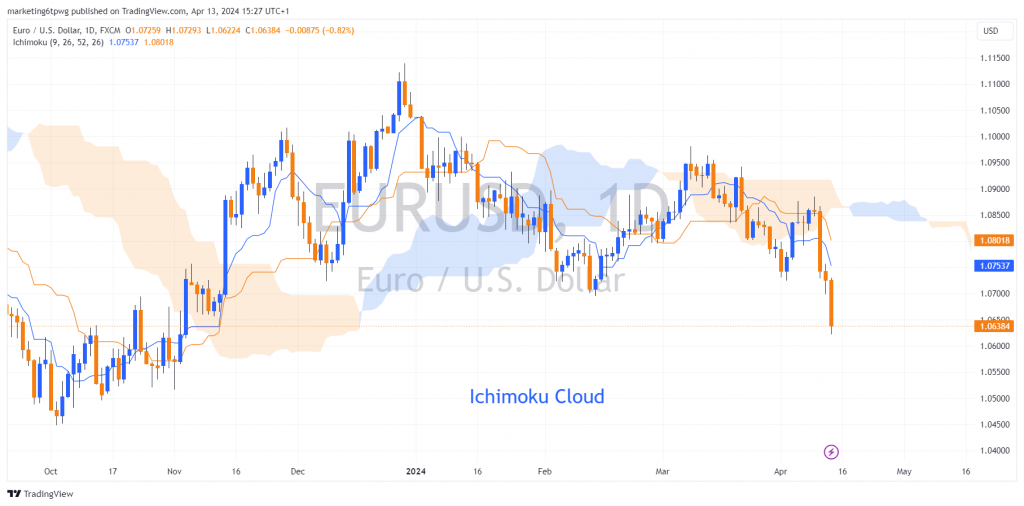
- Ichimoku Clouds: This indicator offers a comprehensive look at resistance and support levels, momentum, and trend direction, all in one view.
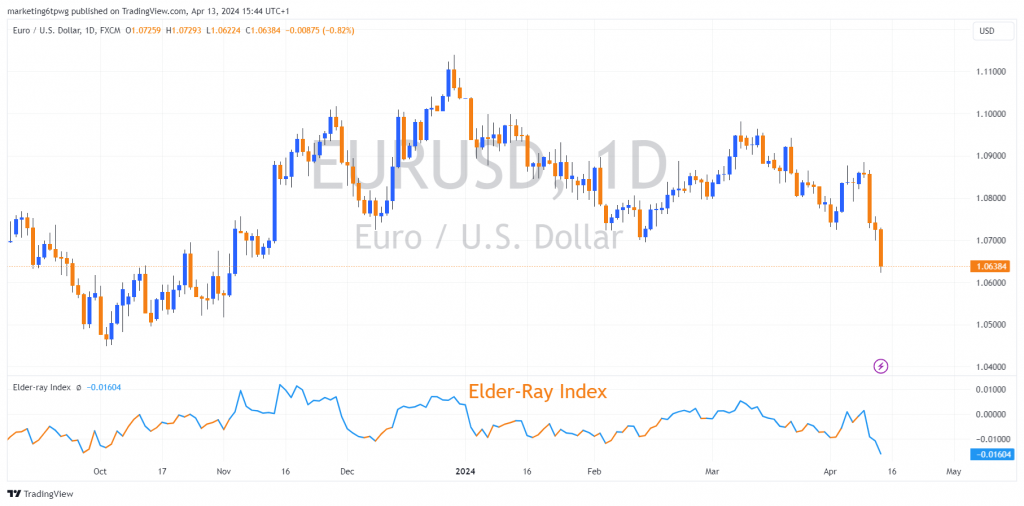
- Elder Ray Index: Developed by Dr. Alexander Elder, this indicator uses Bear and Bull power indicators to measure buying and selling pressure.
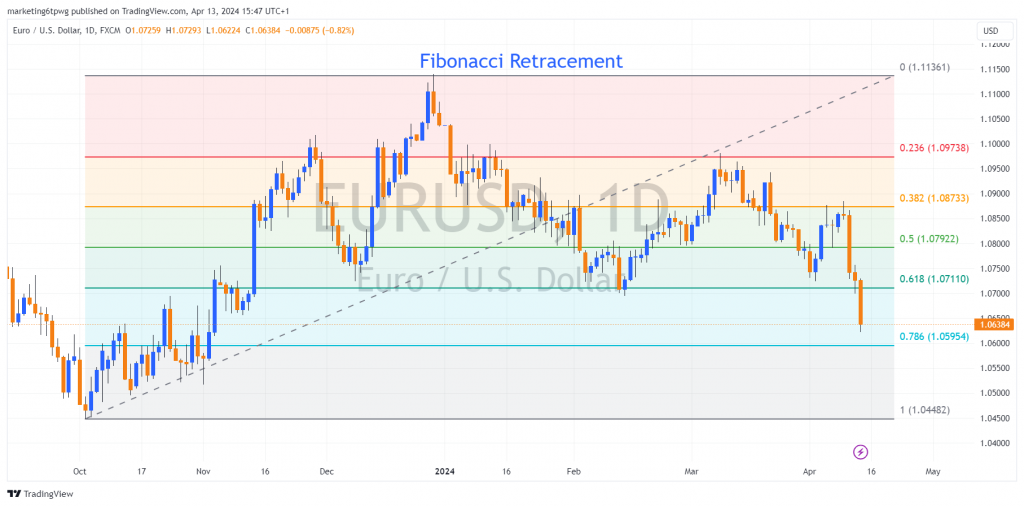
- Fibonacci Retracement: Used to identify strategic levels that prices might retrace before resuming the original trend. This is based on the Fibonacci sequence identified by mathematician Leonardo Fibonacci.
Practical Tips for Using Advanced Forex Charts
Navigating through advanced charting requires precision and understanding:
- Thorough Understanding: Each chart type has unique traits and uses. Understanding these can significantly improve decision-making.
- Avoid Overcomplication: Utilizing too many indicators or charts can lead to analysis paralysis. Focus on a few that complement each other.
- Integrate Fundamental Analysis: Combining technical analysis with fundamental insights from economic reports and news can provide a rounded perspective on market movements, enhancing the effectiveness of your trading strategy.
Advanced Charting Software and Tools
When it comes to applying advanced charting techniques, the choice of software can be pivotal:
- MetaTrader 4 and 5: Widely used for Forex trading, these platforms offer robust charting capabilities, including custom indicators and automated trading scripts.
- TradingView: Known for its social networking features, this platform provides powerful charting tools and a wide range of data visualization options.
- NinjaTrader: Offers extensive options for charting and trading, especially useful for sophisticated traders who require advanced technical analysis tools.
Each platform has its strengths and weaknesses, and the best choice depends on specific trading needs, such as the complexity of the analysis, usability, and cost.
Conclusion
Advanced Forex charts are more than just tools; they are essential instruments that can sculpt informed and effective trading strategies. As traders progress in their careers, understanding and utilizing these charts can lead to significant improvements in predicting market movements and managing trading risks. Continual learning and practice with these advanced charting techniques are encouraged for anyone serious about succeeding in the competitive world of Forex trading.
Additionally, while you’re learning technical analysis and understanding complicated forex charts, you can benefit from Opofinance technical views tool. Our clients can utilize this tool to deliver unique and invaluable combination of senior analyst expertise and automated algorithms. Simply create a trading account on Opofinance and benefit from the many trading tools offered by our team to facilitate your trading and ensure your success.