In the world of swing trading, mastering strategies that provide clear entry and exit points is critical. The Fibonacci Retracement Swing Trading Strategy is one of the most effective approaches for predicting price movements and optimizing trade decisions. By leveraging specific retracement levels derived from the famous Fibonacci sequence, traders are better equipped to identify potential support and resistance zones in both trending and correcting markets.

This strategy allows traders to anticipate price reversals and continuations with remarkable accuracy. It’s a must-have tool for any serious swing trader looking to maximize gains while minimizing risk. In this article, we’ll explore in depth how to use Fibonacci retracement for swing trading, the benefits of the strategy, common mistakes to avoid, and some advanced techniques to take your swing trading to the next level. Whether you’re a seasoned pro or just starting, this guide will provide you with actionable insights and strategies you can implement right away.
Moreover, when you’re trading with a regulated forex broker like Opofinance, using technical tools like Fibonacci retracement helps enhance your trading experience by providing an extra layer of precision. Let’s dive into the details of how Fibonacci retracement can transform your swing trading.
What is the Fibonacci Retracement Swing Trading Strategy?
The Fibonacci Retracement Swing Trading Strategy is a technical analysis method based on the Fibonacci sequence, a mathematical series in which each number is the sum of the two preceding ones. In trading, Fibonacci retracement levels—such as 23.6%, 38.2%, 50%, 61.8%, and 78.6%—are used to predict areas of potential support and resistance.
These retracement levels are calculated based on a price move’s high and low points, and they help traders predict where the market may reverse or continue after a correction. For swing traders, identifying these levels is crucial because they provide precise entry and exit points in a trade.
Swing traders often deal with price fluctuations that last from a few days to a few weeks. By using Fibonacci retracement, they can determine where to enter or exit trades based on the market’s natural ebbs and flows.
Read More: Master Stochastic Swing Trading
Why Fibonacci Retracement?
Fibonacci retracement is a widely used tool for several reasons:
- Simplicity: Despite its mathematical origins, applying Fibonacci retracement levels to charts is straightforward, requiring only basic knowledge of swing high and swing low points.
- High Predictive Power: Fibonacci retracement levels often align closely with areas of market support or resistance, making them highly effective for swing traders looking to time their trades.
- Applicability Across Markets: Fibonacci retracement levels can be used across different asset classes, including stocks, commodities, and forex, which makes them versatile for traders operating in multiple markets.
The Fibonacci retracement swing trading strategy stands out for its simplicity, precision, and the ability to predict market reversals with confidence.
How to Use Fibonacci Retracement for Swing Trading: A Step-by-Step Guide
Step 1: Identify the Trend
Before applying Fibonacci levels, it’s crucial to determine the market’s trend. Swing trading often involves following the prevailing market trend, whether it’s upward (bullish) or downward (bearish). Understanding the broader trend ensures that you’re not trading against the market’s momentum, which significantly reduces the risk of failed trades.
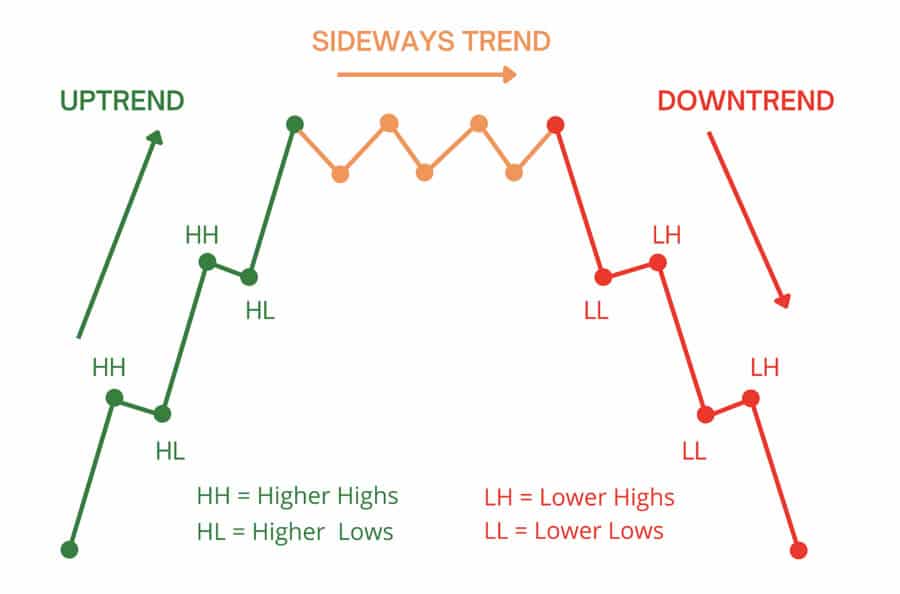
For example, if the market is in an uptrend, you’ll want to look for buying opportunities when the price pulls back to one of the Fibonacci levels. If the market is in a downtrend, you’d do the opposite—look for short-selling opportunities when the price retraces upwards.
Step 2: Draw Fibonacci Levels
To apply Fibonacci retracement levels, you need to identify two critical points: the swing high and the swing low. In an uptrend, the swing low is the starting point, and the swing high is the ending point. In a downtrend, it’s the opposite. Using these two points, draw the Fibonacci retracement levels on your chart, which will automatically plot the 23.6%, 38.2%, 50%, 61.8%, and 78.6% levels.
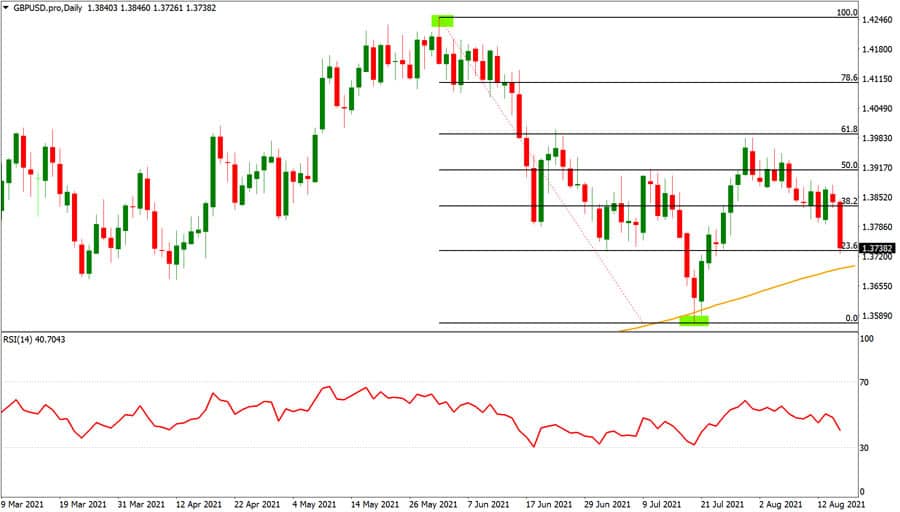
Let’s say the price of a stock or currency pair rises from $100 to $150. The swing low is $100, and the swing high is $150. After a run-up, the price begins to retrace. Applying Fibonacci retracement would help you determine how far the price is likely to pull back before continuing its upward trend.
Read More: 7 Powerful Secrets to Master Ichimoku Cloud Swing Trading Strategy
Step 3: Wait for Retracement
Once you’ve drawn the Fibonacci levels, the next step is to wait for the price to retrace back to one of these key levels. The most commonly watched retracement levels are 38.2%, 50%, and 61.8%. These levels act as potential support in an uptrend or resistance in a downtrend.
For example, if a currency pair’s price retraces to the 61.8% level and begins to bounce back, it could signal a good opportunity to enter a long position in the direction of the overall trend.
Step 4: Confirmation with Other Indicators
While Fibonacci retracement is a powerful tool, combining it with other technical indicators can significantly improve the accuracy of your trades. Popular indicators include:
- Moving Averages: If the price retraces to a Fibonacci level and aligns with a 50-period or 200-period moving average, it provides a stronger confirmation of a potential reversal.
- Relative Strength Index (RSI): RSI can confirm whether a retracement is likely to continue or if a reversal is imminent. An oversold RSI condition combined with a 61.8% retracement level, for example, offers a high-probability buying opportunity.
- Candlestick Patterns: Reversal candlestick patterns such as Doji, Hammer, or Engulfing at Fibonacci retracement levels can provide additional confirmation for trade entries.
Key Benefits of Fibonacci Retracement in Swing Trading
1. Identifying Reversal Zones
One of the main advantages of Fibonacci retracement is its ability to identify potential reversal points. Swing traders can use retracement levels to determine the points at which the market is likely to reverse its direction. This helps traders avoid entering trades too early and positions them to catch the market as it rebounds.
The most frequently used retracement levels—38.2%, 50%, and 61.8%—are considered highly reliable for identifying areas where the price might reverse after a retracement.
Fibonacci retracement gives traders an edge by highlighting zones where the market is most likely to reverse direction, providing a low-risk, high-reward trading opportunity.
2. Risk Management
Fibonacci retracement levels are also valuable for risk management. Since these levels provide clear potential reversal points, traders can use them to set stop-loss levels strategically. For example, if you enter a trade at the 61.8% retracement level, you can set your stop-loss slightly below this level to minimize losses if the price continues to move against you.
By doing so, you reduce the risk of large losses and protect your capital. The clearer your levels are, the easier it becomes to manage risk in volatile markets.
3. Versatility Across Timeframes
Fibonacci retracement works across different timeframes, making it an incredibly versatile tool. Whether you’re day trading on a 15-minute chart or swing trading on a daily or weekly chart, Fibonacci retracement levels provide valuable insights into where the market may move next.
The ability to use Fibonacci retracement across multiple timeframes gives traders more flexibility and precision in their trading decisions.
Read More: The Highest Win Rate Swing Trading Strategy Revealed
Common Mistakes When Using Fibonacci Retracement
1. Blindly Relying on Fibonacci Levels
One common mistake traders make is relying solely on Fibonacci retracement levels without considering other factors. While Fibonacci levels are useful, they should not be the sole basis for entering or exiting a trade. It’s essential to use them in conjunction with other technical analysis tools such as moving averages, volume analysis, and candlestick patterns to confirm signals.
For instance, just because the price touches the 61.8% retracement level doesn’t mean it will automatically reverse. Look for confirmation, such as a reversal candlestick pattern or an overbought/oversold signal from RSI, to increase the probability of success.
2. Ignoring the Bigger Picture
Focusing too much on Fibonacci retracement levels without considering the broader market structure is another common pitfall. For example, if the overall market is in a strong downtrend, buying at a Fibonacci retracement level in hopes of a reversal may not be the best approach. It’s vital to consider the market’s broader trend and momentum when using Fibonacci retracement.
By aligning Fibonacci retracement levels with the broader trend, you ensure that you’re trading in the direction of the market, which significantly increases your chances of success.
3. Overtrading
Another mistake traders often make when using Fibonacci retracement is overtrading. Not every retracement level will result in a profitable trade. If the market is choppy or lacks a clear trend, retracement levels may generate false signals. To avoid overtrading, ensure that you have strong confirmation before entering a trade, and don’t rely on Fibonacci retracement levels alone.
Advanced Fibonacci Swing Trading Techniques
Using Fibonacci Extensions
While Fibonacci retracement is used to identify potential pullback levels, Fibonacci extensions help predict how far the price might travel in the direction of the trend after the retracement is complete. The most common Fibonacci extension levels are 161.8%, 261.8%, and 423.6%. These levels provide traders with potential price targets for their trades.
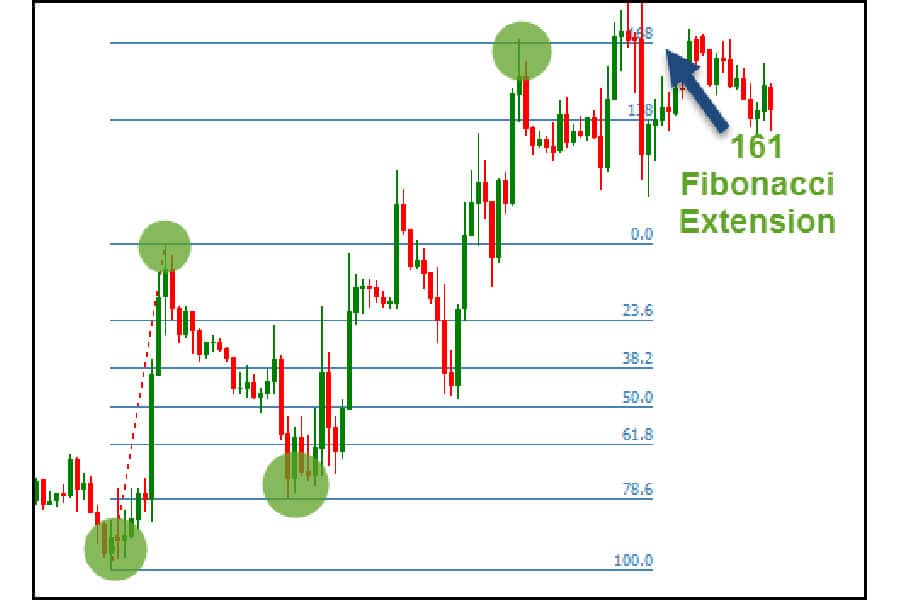
For example, if you enter a long position after a retracement to the 61.8% level, you can use Fibonacci extensions to determine potential take-profit targets, allowing you to plan your trade exit more effectively.
Combining Fibonacci with Moving Averages
Moving averages are another powerful tool that can be combined with Fibonacci retracement levels to increase the accuracy of your trades. When Fibonacci retracement levels align with key moving averages (such as the 50-day or 200-day moving average), it provides a strong indication that the retracement level is likely to hold.
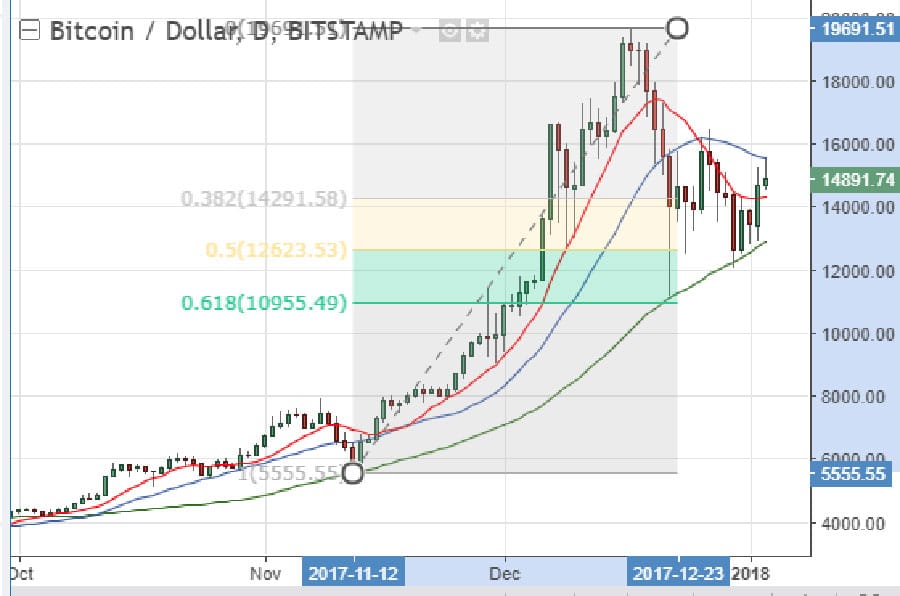
For example, if the price retraces to the 61.8% Fibonacci level, and that level coincides with the 50-day moving average, it provides a stronger confirmation for entering the trade.
Trend Continuation vs. Reversal
Knowing whether the market will continue in the current trend or reverse is essential for swing traders. Fibonacci retracement can help identify these key moments. Typically, a retracement to the 38.2% or 50% level suggests the trend will continue, while a retracement to the 78.6% level or deeper may indicate a reversal.
For instance, in a strong uptrend, a pullback to the 38.2% or 50% Fibonacci level often signals a continuation of the trend, offering a prime entry point. In contrast, a retracement to the 78.6% level may suggest the trend is weakening, increasing the likelihood of a reversal.
7 Powerful Fibonacci Swing Trading Secrets

Secret #1: The Golden Ratio Zone
The 61.8% retracement level, known as the Golden Ratio, is statistically the most powerful reversal zone. Professional traders often place their highest probability trades when price reaches this level and shows confirmation signals.
Secret #2: Time Confluence
Combine Fibonacci time zones with retracement levels. When price reaches a Fibonacci retracement level at the same time as a Fibonacci time zone, the probability of a reversal increases significantly.
Secret #3: The 50% Magnet
While not an official Fibonacci ratio, the 50% retracement level often acts as a price magnet. Many institutional traders use this level for profit-taking, making it a crucial zone for potential reversals.
Secret #4: Multiple Timeframe Validation
Apply Fibonacci retracements on at least three timeframes:
- Higher timeframe for trend direction
- Medium timeframe for trade setup
- Lower timeframe for precise entry When all three align, your trade probability increases dramatically.
Secret #5: The Fibonacci Extension Edge
Use Fibonacci extensions (127.2%, 161.8%) as profit targets. These levels often act as strong resistance or support, providing optimal exit points for your trades.
Secret #6: Volume Confirmation
Monitor volume at Fibonacci retracement levels. Higher volume at these levels indicates stronger validation of potential reversals. Lower volume suggests the level might not hold.
Secret #7: The Fibonacci Failure Strategy
When price breaks through a Fibonacci level with strong momentum, it often continues to the next level. Skilled traders capitalize on these ‘failures’ by entering trades in the direction of the breakout.
Opofinance Services: A Trusted Broker for Your Trading Needs
When implementing the Fibonacci retracement swing trading strategy, it’s essential to use a reliable ASIC-regulated forex broker that offers the right tools and features for traders. Opofinance stands out as a trusted partner for traders looking to maximize their trading potential.
Opofinance is officially featured on the MT5 brokers list, offering one of the most advanced trading platforms with a wide range of technical tools, including Fibonacci retracement. Its platform provides traders with the ability to apply Fibonacci levels easily and combine them with other advanced indicators.

In addition, Opofinance provides safe and convenient deposits and withdrawals, ensuring traders have a seamless experience. For those interested in learning from successful traders, Opofinance’s social trading services allow you to copy trades from experienced traders, accelerating your learning curve and boosting your profitability.
With Opofinance, you’re equipped with everything you need to apply the Fibonacci retracement swing trading strategy effectively and grow as a trader.
Conclusion
The Fibonacci retracement swing trading strategy is an indispensable tool for any swing trader looking to maximize profits and minimize risk. By understanding how to apply Fibonacci retracement levels, combining them with other technical indicators, and following a disciplined approach, traders can identify key entry and exit points with a high degree of accuracy.
Whether you’re using basic Fibonacci retracement levels or more advanced techniques like Fibonacci extensions, this strategy offers a reliable way to predict market movements and capitalize on price retracements. Additionally, by partnering with a trusted broker like Opofinance, you can enhance your trading experience with advanced tools, secure transactions, and the opportunity to learn from experienced traders.
Incorporate Fibonacci retracement into your swing trading arsenal today, and take your trading skills to new heights.
Can Fibonacci retracement levels be used in all market conditions?
Fibonacci retracement levels are highly effective in trending markets but may give false signals in choppy or sideways markets. In these conditions, combining Fibonacci retracement with other technical indicators, such as moving averages or oscillators, can help improve accuracy and reduce the likelihood of false signals.
What are the most reliable Fibonacci retracement levels?
The most reliable Fibonacci retracement levels are 38.2%, 50%, and 61.8%. These levels are commonly used by traders to identify potential areas of price reversal or continuation. Among these, the 61.8% level is often regarded as the “golden ratio” in Fibonacci analysis due to its frequent occurrence in nature and markets.
How does Fibonacci retracement work with other trading strategies?
Fibonacci retracement works well when combined with other trading strategies, such as trendline analysis, moving averages, and candlestick patterns. For instance, a retracement to a Fibonacci level that coincides with a trendline or moving average provides stronger confirmation for a trade. Similarly, candlestick patterns like engulfing or hammer patterns at Fibonacci retracement levels can signal a high-probability trade setup.


