

Are you ready to dive into the exciting world of forex trading? Wondering where to begin your journey? Look no further! We’ve got you covered with a beginner-friendly guide to five essential indicators that will kickstart your forex adventure and set you on the path to success. When choosing a platform, make sure to work with a regulated forex broker to ensure a safe and secure trading experience.
Remember when you first learned to ride a bike? Those wobbly first attempts, the thrill of finding your balance, and the pride of finally cruising down the street? Well, starting your forex journey is a lot like that – a mix of excitement, nervousness, and the promise of newfound freedom. Let’s get those training wheels on and start pedaling towards your financial goals!
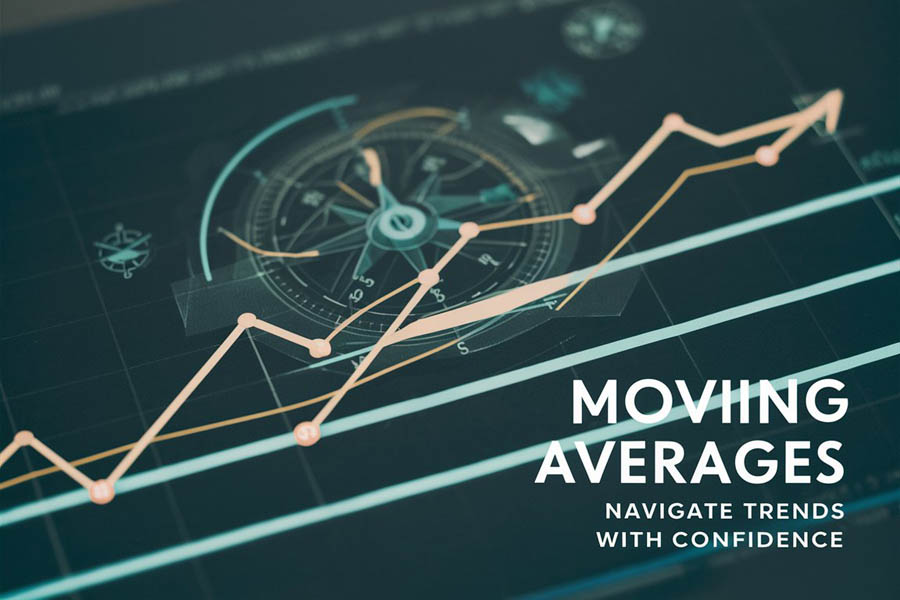
1. Moving Averages: Your Forex GPS
Ever wished you had a GPS for the forex market? Well, moving averages are pretty close! They’re like that friendly voice guiding you through the twists and turns of currency trends, helping you navigate the complex world of forex with more confidence.
What are moving averages?
Imagine you’re trying to figure out if it’s getting warmer or colder outside. Instead of just looking at today’s temperature, you check the average over the past week. That’s basically what a moving average does for forex prices – it smooths out the day-to-day jumps to show you the overall direction, giving you a clearer picture of the market’s trajectory.
Types of moving averages:
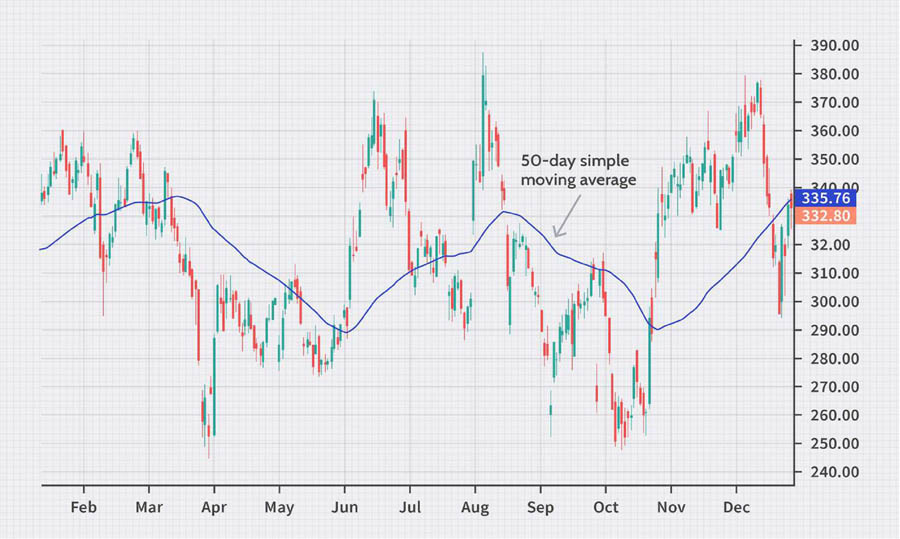
- Simple Moving Average (SMA): The straightforward average over a set number of periods, offering a clear view of the overall trend.
- Exponential Moving Average (EMA): Gives more weight to recent prices, making it quicker to react to changes and potentially catching trends earlier.
How to use them:
When a shorter-term moving average crosses above a longer-term one, it might signal an uptrend. The opposite could indicate a downtrend. It’s like spotting which way the wind is blowing before setting sail! This simple yet powerful tool can help you make more informed trading decisions.
Read More: Forex Trading For Beginners
Real-life example:
Sarah, a newbie trader, noticed the 10-day EMA crossing above the 50-day EMA for EUR/USD. She took a small long position and rode a nice uptrend for a week, making her first profitable forex trade. Remember, though – no indicator is perfect, so always use them as part of a broader strategy and combine them with other analytical tools!
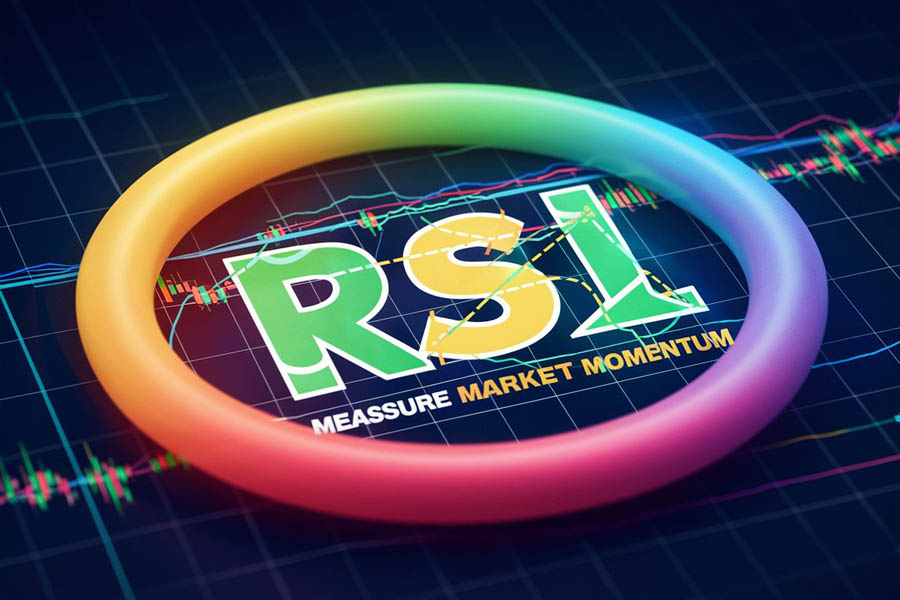
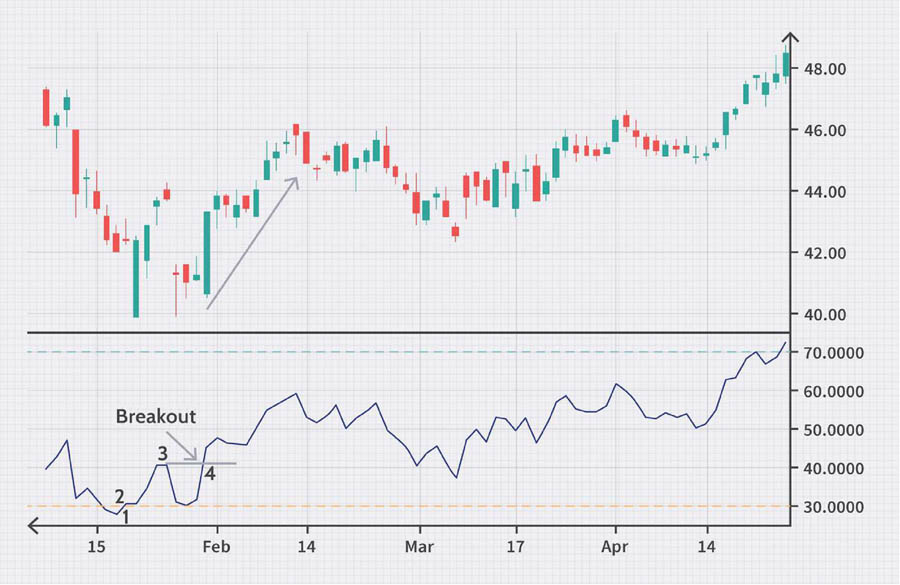
2. Relative Strength Index (RSI): Your Market Mood Ring
Remember those mood rings that changed color based on your emotions? The RSI is kind of like that for the forex market. It helps you gauge whether a currency pair is feeling “overbought” or “oversold,” giving you valuable insights into potential market reversals.
What is RSI?
RSI measures the speed and change of price movements on a scale from 0 to 100. Think of it as a speedometer for market momentum, helping you understand when the market might be moving too fast in one direction and due for a correction.
How to read it:
- RSI above 70? The market might be getting a bit too excited – could be time for a breather or potential reversal.
- RSI below 30? Things might be getting overly pessimistic – a bounce could be coming soon.
But wait, there’s a twist! In strong trends, these “normal” levels can shift. It’s like how your definition of “hot” changes depending on whether you’re in Alaska or Hawaii. Context is key when interpreting RSI readings, so always consider the broader market conditions.
Real-world application:
Tom noticed the USD/JPY’s RSI hitting 75. Instead of immediately selling, he waited for it to turn back down below 70 before taking a short position. This patience helped him avoid getting caught in a continued uptrend and improved his entry point, showcasing the importance of combining indicator signals with prudent decision-making.
3. Bollinger Bands: Your Market Squeeze Detector
Imagine you’re at a party, and everyone’s crowded into one room. Suddenly, the crowd starts to thin out – something exciting must be happening elsewhere! Bollinger Bands work similarly in forex, helping you spot when the market is getting “squeezed” and ready for a potential breakout, allowing you to prepare for significant price movements.
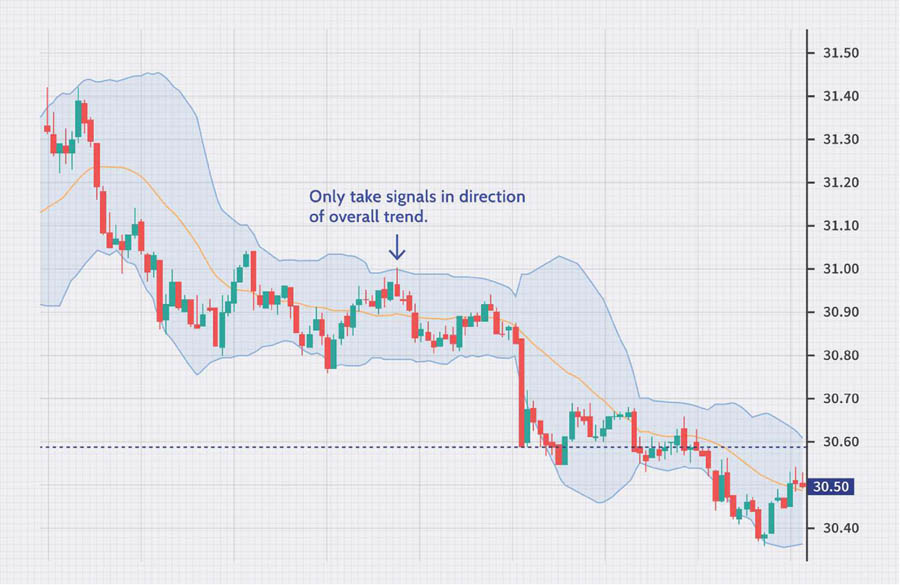
What are Bollinger Bands?
These are like flexible boundaries around price movements, typically consisting of:
- A middle band (usually a 20-period moving average)
- An upper band (2 standard deviations above the middle)
- A lower band (2 standard deviations below the middle)
How to use them:
When the bands squeeze together, it often signals that a big move is coming – though it doesn’t tell you which direction. When prices touch or go beyond the bands, it might indicate a potential reversal or continuation, depending on other factors. Bollinger Bands are excellent for visualizing market volatility and identifying potential trading opportunities.
A beginner’s story:
Maria noticed the GBP/USD Bollinger Bands tightening like a coiled spring. She set alerts for when the price broke out of this tight range. When it did, she was ready to hop on the emerging trend, making her first profitable forex trade! This experience taught her the value of patience and being prepared for market breakouts.
4. MACD: Your Trend Strength and Direction Compass
Have you ever tried to tell which way the wind is blowing by tossing a leaf in the air? The MACD (Moving Average Convergence Divergence) is a bit like that, but for forex trends. It helps you spot not just the direction, but also the strength of market movements, giving you a more comprehensive view of potential trading opportunities.
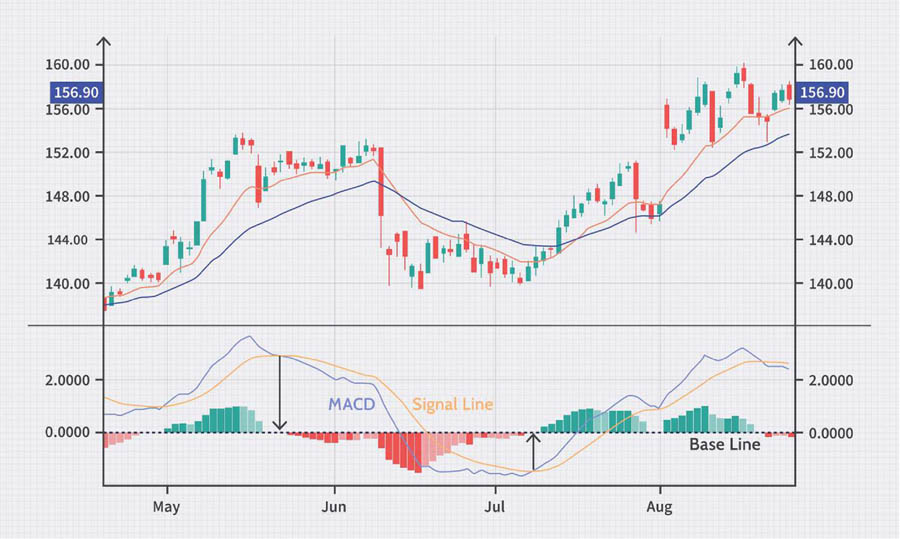
Breaking down MACD:
- The MACD line: The difference between a short-term and a long-term moving average.
- The signal line: A moving average of the MACD line.
- The histogram: Shows the distance between the MACD and signal lines.
How to read it:
- MACD crossing above the signal line? Could be a bullish signal, indicating a potential uptrend.
- MACD dipping below the signal line? Might be time to consider selling, as it could signal a downtrend.
- Histogram growing? The trend might be gaining strength, suggesting a continuation.
- Histogram shrinking? The trend could be losing steam, potentially signaling a reversal.
Real-life example:
Alex, a forex newbie, was watching AUD/USD. The MACD line crossed above the signal line, and the histogram started growing. This gave Alex the confidence to enter a long position, riding a nice uptrend for a few days. By combining MACD signals with other indicators, Alex was able to make a well-informed trading decision.
5. Stochastic Oscillator: Your Overbought/Oversold Detective
Ever been to a sale where everything’s flying off the shelves, or a store where nothing’s moving? The Stochastic Oscillator helps you spot similar situations in the forex market, identifying potential reversal points and entry opportunities.
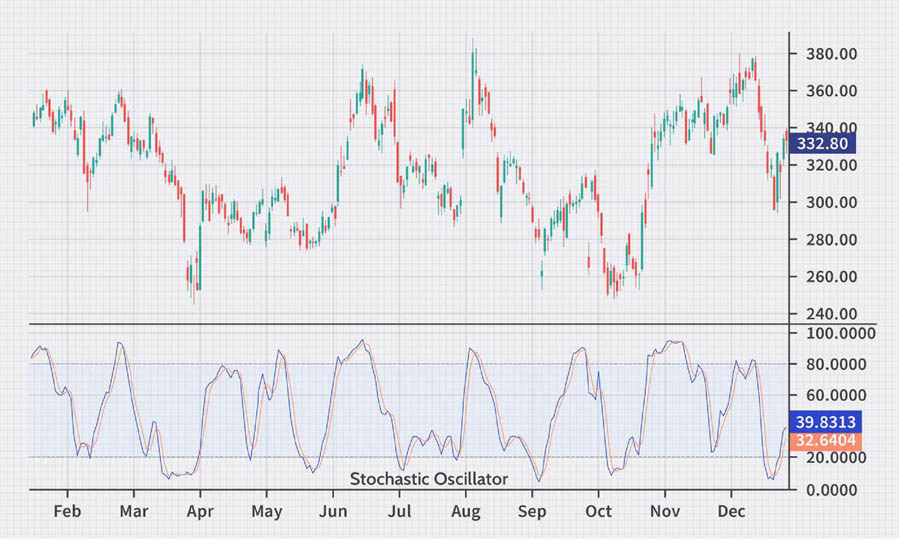
What is it?
The Stochastic compares a currency pair’s closing price to its price range over a specific period. It consists of two lines:
- %K: The main line, reflecting the current market situation.
- %D: A moving average of %K, acting as a signal line.
How to use it:
- Readings above 80 suggest overbought conditions – the party might be ending soon, and a reversal could be imminent.
- Readings below 20 indicate oversold conditions – things might be due for a turnaround, presenting potential buying opportunities.
- When %K crosses %D, it could signal a potential trend change, offering entry or exit points.
Read More: How Long Does It Take to Learn Forex?
A beginner’s tale:
Lisa noticed EUR/GBP’s Stochastic dropping below 20. She waited for the %K line to cross above the %D line before buying. This patience helped her catch a nice upward move while avoiding a premature entry. Lisa’s experience highlights the importance of waiting for confirmation signals rather than rushing into trades based on a single indicator.
Ready to Take Your Forex Trading to the Next Level?
If you’re excited to put these indicators into practice and start your forex journey, we’ve got great news for you! OpoFinance, an ASIC-regulated broker, offers an innovative social trading platform that’s perfect for beginners and experienced traders alike.

Why choose OpoFinance?
- ASIC regulation ensures a safe and transparent trading environment
- User-friendly platform suitable for all experience levels
- Social trading features allow you to learn from and copy successful traders
- Wide range of educational resources to support your trading journey
- Competitive spreads and fast execution to maximize your trading potential
With OpoFinance’s social trading platform, you can see how experienced traders are using these indicators in real-time, giving you valuable insights as you develop your own trading style. Plus, their comprehensive educational materials can help you deepen your understanding of these indicators and other crucial trading concepts.
Don’t let analysis paralysis hold you back – start your forex journey today with OpoFinance and turn those indicator insights into real trading experience! Take the first step towards your financial goals and join a community of traders who are passionate about continuous learning and improvement.
Read More: 5 Forex Indicators That Separate Winners From Losers
Putting It All Together: Your Forex Toolkit
Now that you’ve got these five indicators in your toolkit, you might be wondering, “How do I use them all together?” Great question! Think of them as different instruments in an orchestra. Each has its unique sound, but when played together, they create a beautiful symphony of market analysis.
Here’s a simple way to combine them:
- Use moving averages to get a sense of the overall trend.
- Check RSI and Stochastic for potential overbought or oversold conditions.
- Look at Bollinger Bands for possible breakout opportunities.
- Confirm with MACD to gauge trend strength and potential reversals.
Remember, no single indicator is perfect. They’re tools to help you make informed decisions, not crystal balls predicting the future. Always use them in conjunction with proper risk management and continual learning to develop a robust trading strategy.
Conclusion
Starting your forex trading journey might feel like stepping into a whole new world. But guess what? Every expert trader was once a beginner, just like you. With these five indicators as your starting point, you’re well on your way to navigating the exciting waters of forex trading.
Remember, the key to success in forex isn’t just about indicators – it’s about patience, continuous learning, and responsible risk management. So, take your time, practice with a demo account, and never stop asking questions. Your forex adventure is just beginning, and the possibilities are as vast as the global currency market itself!
How often should I check these indicators?
It depends on your trading style. For day trading, you might check them several times a day. For swing trading, daily or weekly checks might suffice. The key is consistency and finding a routine that works for you. Experiment with different timeframes to see what aligns best with your trading goals and lifestyle.
Can I use these indicators for other financial markets?
Absolutely! While we’ve focused on forex here, these indicators are widely used in stock, commodity, and cryptocurrency markets too. The principles remain similar, though you might need to adjust settings for different market characteristics. Always backtest and adapt your strategies when applying these indicators to new markets.
Is it necessary to use all five indicators at once?
Not at all! Many successful traders use just two or three indicators. Start with one or two that resonate with you, understand them deeply, then gradually add others if you feel the need. Quality of analysis trumps quantity of indicators every time. Focus on mastering a few indicators rather than overwhelming yourself with too many at once.


