

Forex charts are graphical representations of historical exchange rates between currency pairs, serving as a cornerstone of technical analysis in forex trading. These charts are essential tools for traders, providing a visual depiction of price movements over various periods. By analyzing these charts, traders can identify trends, make informed predictions about future price movements, and ultimately make strategic trading decisions. Selecting the right broker for forex trading plays a key role in accessing these tools effectively.

Importance of Forex Charts in Technical Analysis
The role of forex chart types is crucial in technical analysis. Different chart types offer unique perspectives on price data, helping traders to visualize market behavior and spot trading signals. Understanding these chart types is fundamental for anyone looking to delve into forex trading. The primary chart types—line charts, bar charts, and candlestick charts—each present price information differently, catering to various analytical needs and trading strategies. Additionally, less common chart types such as Heikin Ashi and Renko charts provide alternative methods for interpreting market data, further enriching a trader’s toolkit.
The Dynamic Nature of the Forex Market
The forex market is one of the most dynamic and liquid financial markets globally, with daily trading volumes exceeding $6 trillion. Given the market’s complexity and rapid pace, traders must rely on robust analytical tools to navigate and capitalize on trading opportunities effectively. Forex charts are among the most vital of these tools, providing insights into market trends, potential price reversals, and other critical factors influencing trading decisions.
Predicting Future Price Trends with Historical Data
One of the core principles of technical analysis is that historical price movements can help predict future price trends. Forex charts embody this principle by offering a historical record of price data, which traders can analyze to forecast future movements. By understanding the different types of forex charts and how to interpret them, traders can develop a more nuanced understanding of market dynamics and enhance their trading strategies.
The Fundamental Role of Forex Charts
Forex charts are indispensable tools for forex traders, providing a visual representation of price movements and trends. These charts allow traders to analyze historical data, identify patterns, and make informed decisions about future price movements. By understanding the different types of forex charts and how to interpret them, traders can develop a more comprehensive understanding of the market and enhance their trading strategies.
Technical Analysis and Market Behavior
Forex charts are essential for technical analysis, a method of evaluating price movements and trends based on historical data. Technical analysis relies on the principle that historical price movements can help predict future price trends. By analyzing forex charts, traders can identify patterns and trends that provide insights into market behavior and potential price movements.
Identifying Support and Resistance Levels
Forex charts are also useful for identifying key support and resistance levels. Support levels are price points where a currency pair tends to find buying interest, while resistance levels are points where selling interest tends to emerge. By identifying these levels on forex charts, traders can make more informed decisions about entry and exit points for their trades.
Mastering Forex Chart Types
Overall, understanding the different types of forex charts and how to interpret them is fundamental for any trader involved in technical analysis. Each chart type offers unique insights into market behavior, helping traders to make informed decisions. By mastering these charts and patterns, traders can improve their chances of success in the forex market.
Main Types of Forex Charts
In forex trading, charts are indispensable tools that traders use to analyze price movements and identify trading opportunities. There are several types of forex charts, each offering unique advantages and insights. The three most commonly used chart types are line charts, bar charts, and candlestick charts. Additionally, there are specialized charts such as Heikin Ashi and Renko charts that provide alternative perspectives on price data.
Line Charts
How Line Charts Represent Price Movements
Line charts are the simplest form of forex charts, representing price movements over a specific time period. They are created by connecting a series of data points, typically the closing prices of the currency pairs, with a continuous line. Line charts plot a single point for each period’s closing price, which is then connected with a line. This straightforward approach makes it easy to see the overall direction of the market and identify trends. While they do not provide as much detailed information as other chart types, their simplicity is advantageous for quickly assessing the general market trend.
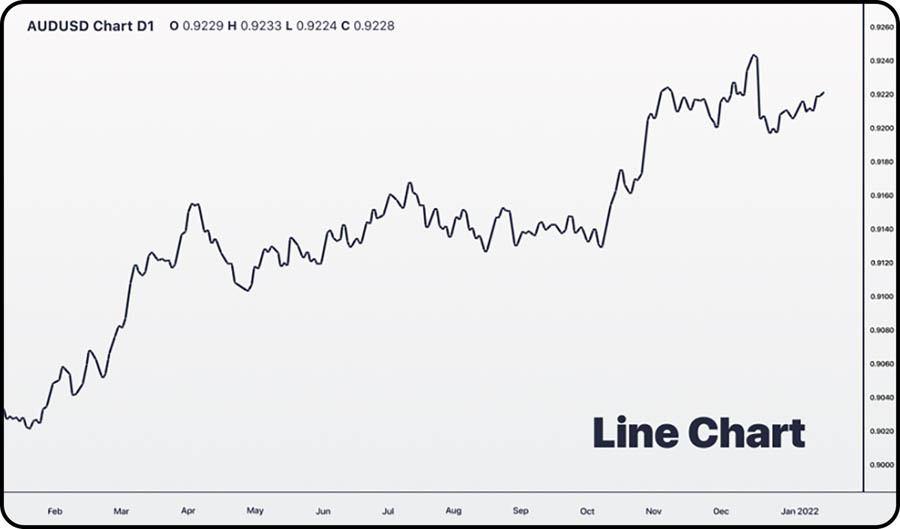
Simplicity and Usefulness of Line Charts
Line charts are particularly useful for beginners due to their simplicity. They strip away the noise of more complex charts, allowing traders to focus on the broader picture. By highlighting the overall trend, line charts help traders to make basic trading decisions without being overwhelmed by too much data. Despite their simplicity, line charts can be powerful tools for identifying significant support and resistance levels. Support levels are price points where a currency pair tends to find buying interest, while resistance levels are points where selling interest tends to emerge. By identifying these levels on a line chart, traders can make more informed decisions about entry and exit points for their trades.
Bar Charts
Depicting Price Data with Bar Charts
Bar charts offer a more detailed representation of price movements compared to line charts. Each bar on the chart shows the opening, high, low, and closing prices for a given time period. A bar chart displays a vertical line representing the price range of the currency pair for a specific period. The top of the bar indicates the highest price, and the bottom shows the lowest price. Small horizontal lines to the left and right of the bar indicate the opening and closing prices, respectively. This structure allows traders to see the range of price movements within each period.
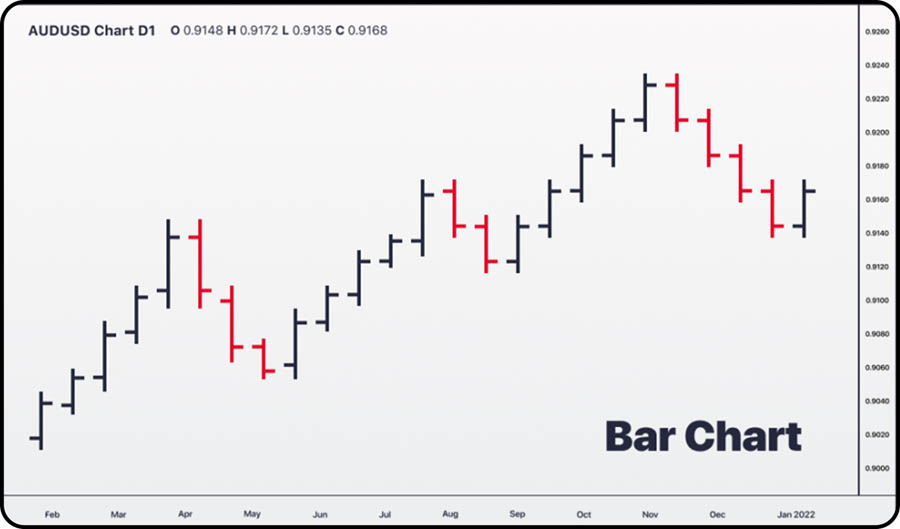
Advantages of Bar Charts
Bar charts provide more detailed information than line charts, making them useful for traders who want to analyze the market more deeply. They reveal not just the closing price, but the range of price movements and how prices fluctuated within each period. This detailed view can help traders to identify patterns and potential trading opportunities. One of the key advantages of bar charts is their ability to show the relationship between the opening and closing prices, as well as the high and low prices for each period. This information can be crucial for identifying trends and potential reversals. For example, if the closing price is consistently higher than the opening price over several periods, this may indicate a bullish trend.
Candlestick Charts
Detailed Price Information in Candlestick Charts
Candlestick charts are among the most popular and widely used chart types in forex trading. They provide a wealth of information in a visually intuitive format, making them a favorite among both novice and experienced traders. Candlestick charts display the opening, high, low, and closing prices within a given time frame. Each candlestick consists of a body and wicks (or shadows). The body represents the range between the opening and closing prices, while the wicks show the highest and lowest prices during the period.
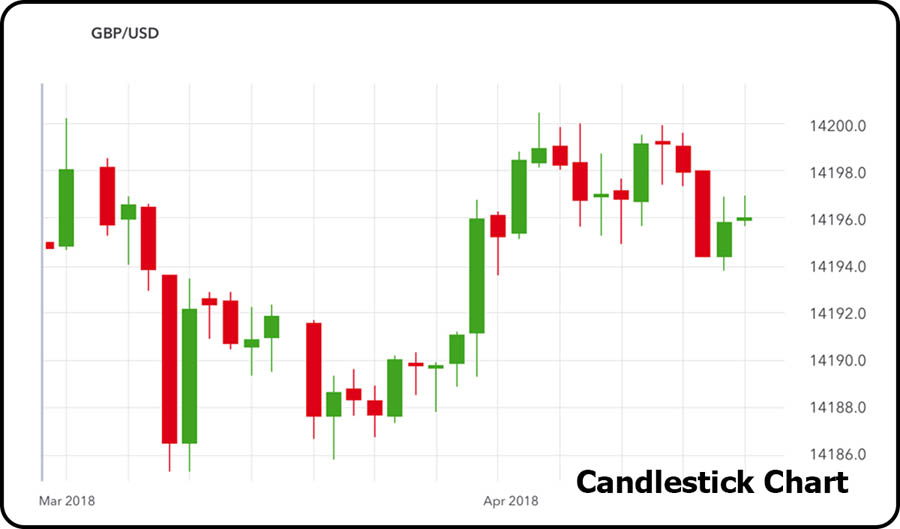
Visual Representation of Price Action
The color and size of the candlestick’s body provide insights into market sentiment. A green (or white) candlestick indicates that the closing price was higher than the opening price, signaling bullish sentiment. Conversely, a red (or black) candlestick shows that the closing price was lower than the opening price, indicating bearish sentiment. The length of the wicks also reveals how volatile the market was during the period. Candlestick charts are particularly useful for identifying patterns that can signal potential reversals or continuations of the current trend. For example, a long green candlestick with little or no wick indicates strong bullish sentiment, while a long red candlestick with little or no wick indicates strong bearish sentiment. By identifying these patterns, traders can make more informed decisions about their trades.
Popularity Among Forex Traders
Candlestick charts are highly favored due to their ability to convey a lot of information quickly and intuitively. They help traders to identify patterns and potential reversal or continuation signals, making them a powerful tool for technical analysis. The popularity of candlestick charts is also due to their versatility. They can be used for various time frames, from short-term intraday trading to long-term trend analysis. This makes them suitable for a wide range of trading strategies and styles.
Read More: Fundamental Analysis in Forex
Heikin Ashi and Renko Charts
While less common than line, bar, and candlestick charts, Heikin Ashi and Renko charts offer unique perspectives that can be valuable for certain trading strategies.
Heikin Ashi Charts
Heikin Ashi charts are a variant of candlestick charts that use modified formulas to provide a smoother view of price action. They aim to filter out market noise and highlight the underlying trend more clearly.
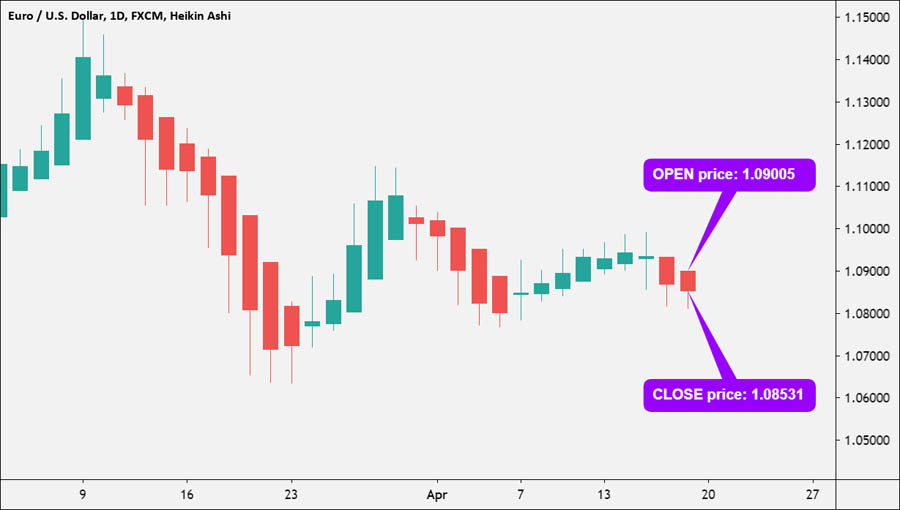
How Heikin Ashi Charts Work
Heikin Ashi charts calculate each candlestick using the average of the open, close, high, and low prices from the previous period, which helps to smooth out price fluctuations. This makes it easier to identify trends and potential reversals. Heikin Ashi charts are particularly useful for trend traders, as they help to filter out minor price fluctuations and highlight the main trend. For example, a trader using Heikin Ashi charts to analyze the USD/JPY currency pair can more easily identify the overall trend without being distracted by minor price movements.
Renko Charts
Renko charts focus on price movement rather than time. They are constructed by placing a brick in the next column once the price moves a specified amount.
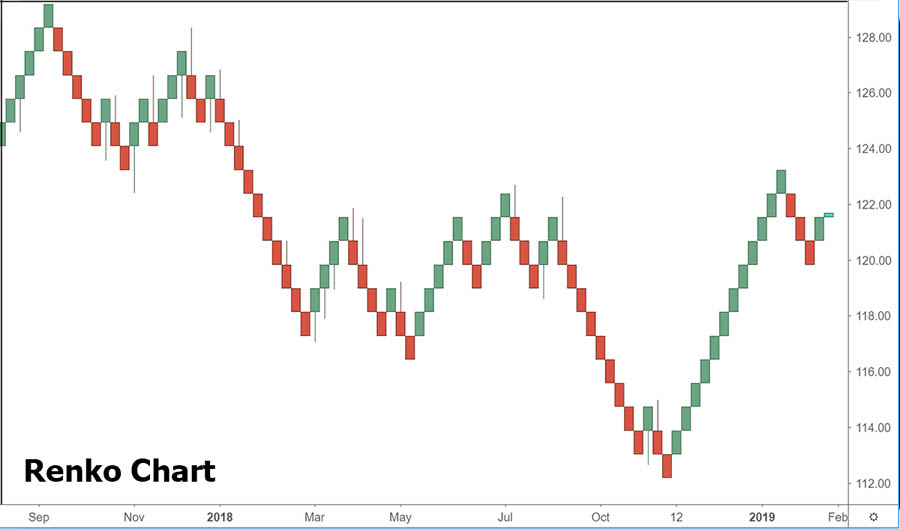
Advantages of Renko Charts
Renko charts are useful for identifying key support and resistance levels, as well as filtering out minor price fluctuations. They help traders to focus on significant price movements, making them a valuable tool for trend-following strategies. Renko charts are particularly effective for identifying trends and potential reversals. By focusing on price movement rather than time, they help traders to filter out noise and focus on the main trend. This makes them a valuable tool for traders who rely on trend-following strategies.
Read More: Forex Terminology for Beginners
Choosing the Right Chart Type
Selecting the appropriate chart type depends on various factors, including your trading style and the level of detail you need.
Factors to Consider
- Trading Style: Day traders might prefer bar or candlestick charts for their detailed price information, while long-term traders might find line charts more useful for identifying overall trends.
- Level of Detail: If you need detailed price data, bar and candlestick charts are ideal. For a simpler overview, line charts may suffice.
- Market Conditions: In volatile markets, Heikin Ashi and Renko charts can help to filter out noise and highlight the main trend.
Choosing the right chart type is crucial for effective technical analysis. Different chart types offer unique perspectives on price data, and selecting the one that best suits your trading style and analytical needs can significantly enhance your trading performance.
The Role of Personal Preference and Experience
Personal preference and experience also play significant roles in choosing the right chart type. Traders who are more comfortable with visual representations may prefer candlestick charts, while those who favor simplicity might lean towards line charts. Experimenting with different chart types and time frames can help traders find the most suitable tools for their trading strategies.
Beyond Chart Types – Chart Patterns
Chart patterns play a crucial role in forex trading, offering insights into market psychology and potential future price movements based on recurring formations created by currency pair price movements.
Introduction to Chart Patterns
Chart patterns are visual formations that reflect the price movements of a currency pair. They provide valuable insights into market sentiment and can signal potential opportunities for traders.
Categories of Chart Patterns
- Continuation Patterns: These patterns suggest that the current trend is likely to continue. Examples include flags, pennants, and rectangles.
- Reversal Patterns: These patterns indicate that the current trend may be reversing. Examples include head and shoulders, double tops, and double bottoms.
Chart patterns serve as essential tools for technical analysis, enabling traders to make informed decisions by recognizing these formations and understanding their implications for future price movements.
Importance of Recognizing Chart Patterns
Recognizing chart patterns is critical for forex traders as they offer insights into potential price movements and market psychology. By studying historical patterns, traders can gain a deeper understanding of market behavior and enhance their ability to forecast future trends.
Importance of Further Research
While understanding basic chart patterns is fundamental, delving deeper into this area through additional research enhances technical analysis skills. Numerous resources are available for traders seeking to expand their knowledge of chart patterns, improving their ability to interpret market dynamics and optimize trading strategies.
Mastering chart patterns empowers traders to refine their trading decisions, anticipate market movements more accurately, and ultimately enhance their overall trading performance in the dynamic forex market.
Conclusion
Understanding forex chart types is fundamental for traders engaged in technical analysis, offering unique insights into market behavior crucial for informed decision-making. Forex trading platforms typically offer a range of chart types—from simple line charts to detailed bar charts and comprehensive candlestick charts—tailored to different trading needs.
Forex charts are indispensable tools, providing critical insights into market trends, potential reversals, and factors influencing trading decisions. By mastering these charts and patterns, traders can enhance their strategies and increase their success in the forex market.
Most trading platforms ensure accessibility to various chart types, empowering traders to conduct effective analysis aligned with their trading styles. Whether utilizing line charts for simplicity, bar charts for detail, or candlestick charts for comprehensive information, each type enhances traders’ understanding of market dynamics.
Mastering forex charts involves continuous learning and practice. Traders benefit from studying different chart types, experimenting with settings, and analyzing historical data to deepen their understanding of market behavior. This ongoing process equips traders with the skills needed to navigate and succeed in the dynamic forex market effectively.
What is the best forex chart type for beginners?
Line charts are ideal for beginners due to their simplicity. They provide a clear view of the overall market trend without overwhelming new traders with too much data.
How do candlestick charts help in trading?
Candlestick charts provide detailed price information and visually represent market sentiment. They help traders identify patterns and potential trading signals, making them a powerful tool for technical analysis.
Can I use multiple chart types simultaneously?
Yes, using multiple chart types can provide a more comprehensive view of the market. Traders often use a combination of line, bar, and candlestick charts to analyze different aspects of price movements.
What are the main advantages of Renko charts?
Renko charts focus on price movement rather than time, helping traders to filter out minor fluctuations and focus on significant price changes. This makes them useful for identifying key support and resistance levels.
Why are Heikin Ashi charts popular among trend traders?
Heikin Ashi charts smooth out price action, making it easier to identify trends and potential reversals. They help trend traders to filter out noise and focus on the main trend.
Are there other chart types I should be aware of?
In addition to the main chart types, there are specialized charts like Point and Figure charts, Kagi charts, and Range bars. These charts offer unique perspectives and can be useful for specific trading strategies.


3 Responses
I love it when people come together and share opinions, great blog, keep it up.