

Ever feel like you’re navigating the financial markets without a map, struggling to pinpoint reliable support and resistance or guess when trends might shift? It’s a common frustration for traders facing seemingly chaotic price swings. But what if there was a method that aimed to bring order by forecasting not just price levels, but also crucial time cycles?
The gann square trading strategy, especially using the famous Square of 9, offers a unique perspective based on geometry and natural rhythms. Developed by the legendary W.D. Gann, this approach, when used thoughtfully with a reliable forex trading broker, could reshape how you see market movements. In this article, we’ll dive into what the gann square trading strategy involves, how the Square of 9 component works, and how you might apply it to your trading.
W.D. Gann: The Legend and His Ideas
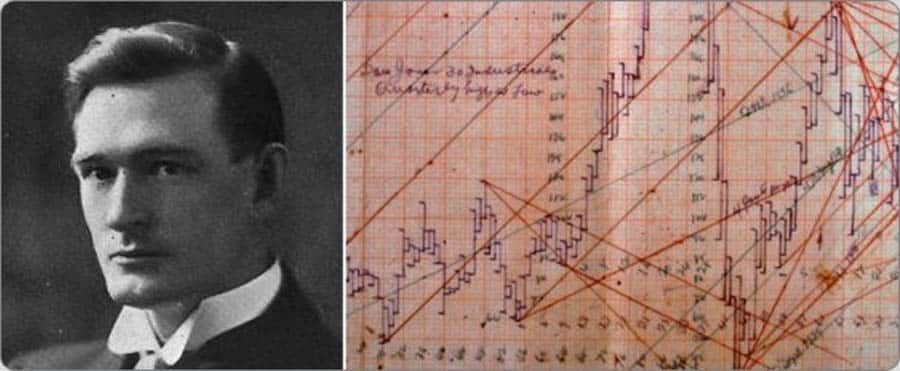
Before we unpack the Gann Square itself, let’s get to know the mind behind it. William Delbert Gann (1878-1955) wasn’t just a trader; he was a financial market theorist who gained almost mythical status for his market predictions and trading success. Blending mathematics, geometry, and even astronomy, Gann developed a unique worldview where markets moved according to predictable, natural laws.
Who Was W.D. Gann?
Starting his trading journey in the early 20th century, Gann quickly became known for his analytical skills. Stories about his accurate forecasts, sometimes made years in advance, and his ability to generate significant returns cemented his legendary reputation. While some tales might be embellished, his impact on technical analysis is undeniable. He authored several books and courses, sharing his intricate theories which proposed that market movements weren’t random but followed inherent patterns and cycles.
Gann’s Core Concepts
Gann’s philosophy was built on a few key ideas that intertwined:
- Time/Price Relationship: Central to his work was the idea that time and price are intrinsically linked. He believed specific price changes correlated with set time periods, and when these elements “squared out,” major market turns were likely. This is a cornerstone of the gann square trading strategy.
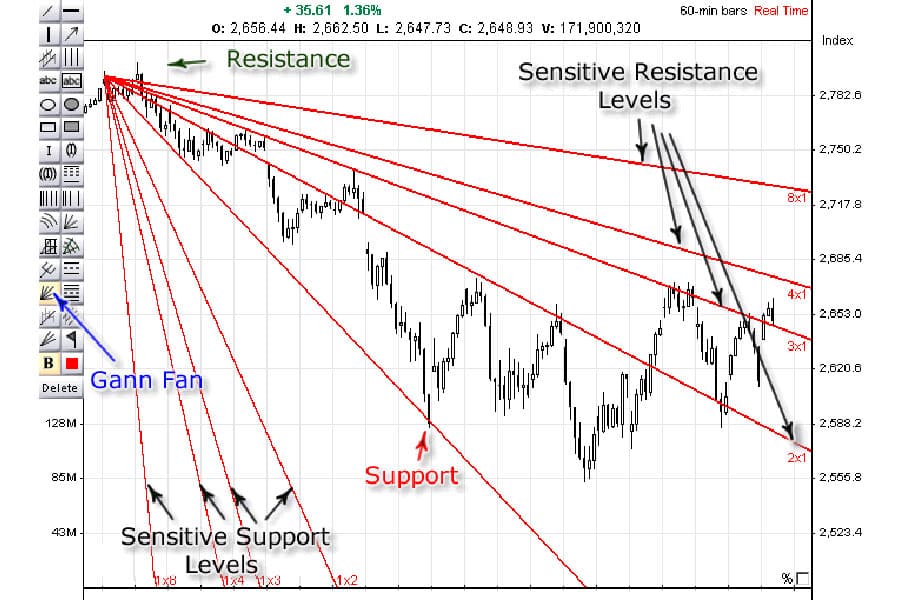
- Geometry and Angles: Gann used geometric angles drawn from key price points (known as Gann Angles or Gann Fans) to identify trends, support, and resistance. He theorized that markets follow specific angular paths.
- Numerology and Vibration: Numbers held deep significance for Gann. He studied historical data searching for recurring numerical patterns and believed numbers possessed unique ‘vibrations’ that influenced market behaviour.
- Natural Cycles: Observing cycles in nature, Gann posited that similar rhythms, from seasonal tendencies to longer historical patterns, occurred in financial markets.
Gann’s Toolkit
To put his theories into practice, Gann created several analytical tools, many still popular today:
- Gann Angles (Gann Fan): Lines drawn at specific angles (e.g., 1×1, 1×2, 2×1) from price pivots to gauge trend strength and identify support/resistance.
- Master Charts: Complex calculators like the Square of 9, Square of 52, and Hexagon Chart, designed to forecast price and time levels.
- Cardinal and Ordinal Squares: Key structural elements within tools like the Square of 9.
- Time Cycles: Identifying repeating time periods (like 90 days, 1 year) thought to influence market reversals.
Among these tools, the Gann Square of 9 stands out as one of the most intriguing and forms the basis of the specific gann square trading strategy we’re exploring here.
Read More: Most Effective Forex Trading Indicators
What is the Gann Square? (Focus on So9)
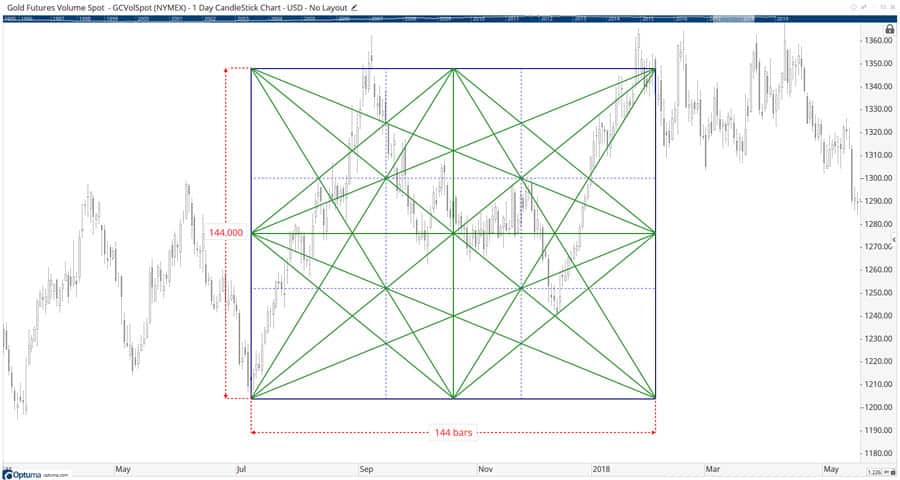
When traders discuss the “Gann Square,” they’re usually referring to the specific tool known as the “Gann Square of 9” (sometimes called the “Gann Wheel”). It’s important not to confuse it with other Gann tools like the Gann Box (a geometric overlay on charts) or Gann Angles. The Square of 9 is a unique numerical grid designed for forecasting market movements, integral to the gann square of nine trading strategy.
The Gann Square of 9 Explained
Imagine a spiral of numbers starting with ‘1’ at the center and expanding clockwise. This is the essence of the Gann Square of 9. Each full rotation forms a larger square, and the numbers within this structure hold specific mathematical relationships. It acts like a calculator, aiming to uncover the underlying harmony and cyclical nature of market price and time.
Purpose of the Square of 9
Why use this complex-looking square? Its main goals, particularly within a gann square trading strategy, are:
- Forecasting Price Levels: To identify potential future support and resistance zones based on the numerical relationships within the spiral.
- Identifying Time Cycles: To pinpoint dates or time windows where market reversals or significant activity might occur.
- Finding Market Symmetry: To reveal harmonic connections between price ranges and time intervals.
- Squaring Price and Time: To find points where a key price level aligns with a key time cycle, which Gann considered extremely important potential turning points.
Essentially, the gann square of 9 trading strategy uses this tool as a potential roadmap for future market movements.
Structure of the Gann Square of 9
Understanding how the Square of 9 is built helps in appreciating its potential applications. The arrangement of numbers follows a specific logic representing growth and cycles, which is key to the gann square trading strategy.
Construction: The Spiral Unfolds
It starts with ‘1’ in the middle. ‘2’ goes to the left, ‘3’ above ‘2’, ‘4’ above ‘1’, ‘5’ above the square to the right of ‘1’, and so on, spiraling outwards clockwise. ‘9’ completes the first square around the center ‘1’. This spiral continues, with each layer forming a bigger square (the next layer ends at 25, then 49, 81, etc. – squares of odd numbers).
Significance of the Spiral
This spiral mimics natural growth patterns. Gann believed markets expanded similarly. The way the numbers are arranged ensures that those lying on key axes or diagonals relative to the center have distinct mathematical relationships, often connected to squares and square roots.
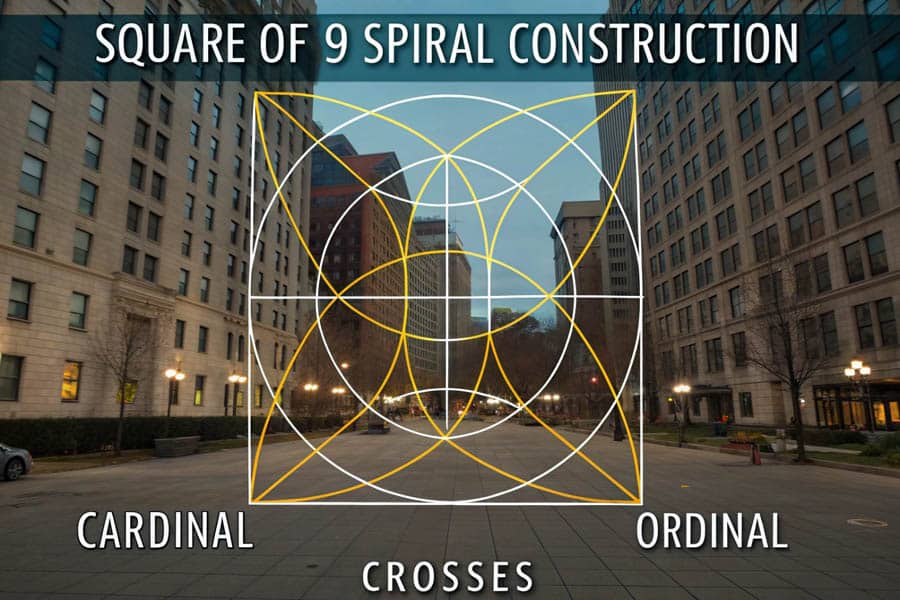
Key Components: Crosses and Angles
Within the square, two important structures emerge:
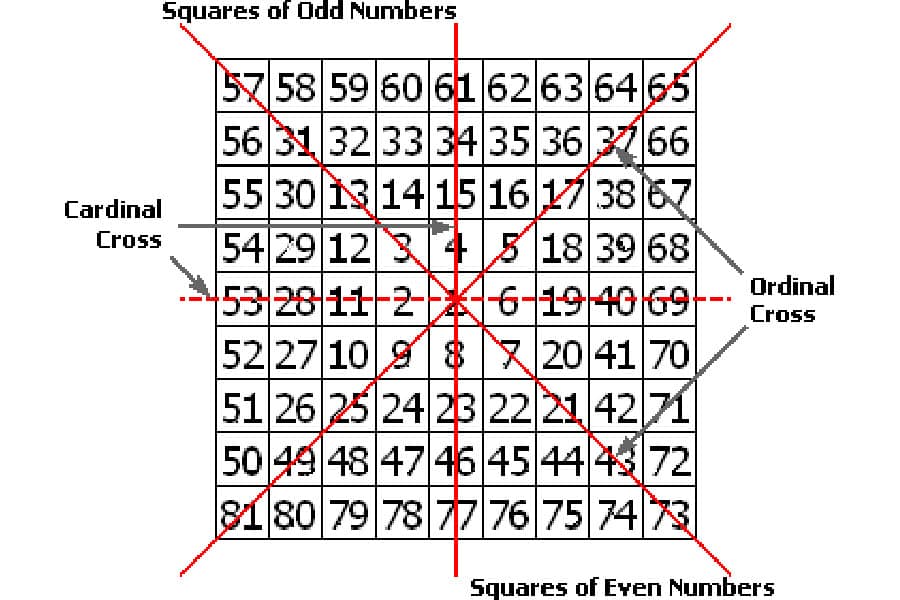
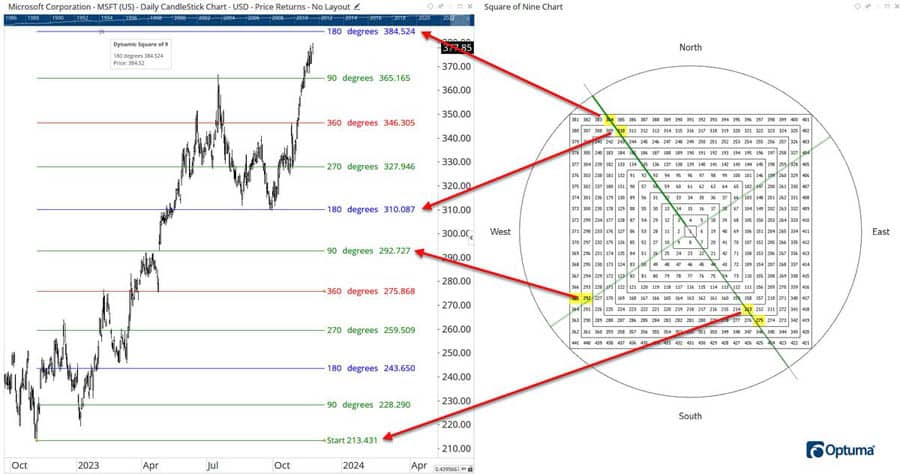
- Cardinal Cross: Numbers falling on the direct vertical and horizontal lines passing through the center ‘1’. These correspond to 0, 90, 180, and 270 degrees and are seen as primary support/resistance points in a gann square trading strategy.
- Ordinal Cross (Fixed Cross): Numbers falling on the main diagonal lines passing through the center ‘1’. These align with 45, 135, 225, and 315 degrees and are also key support/resistance levels, sometimes considered secondary to the Cardinal Cross.
Angles and Degrees
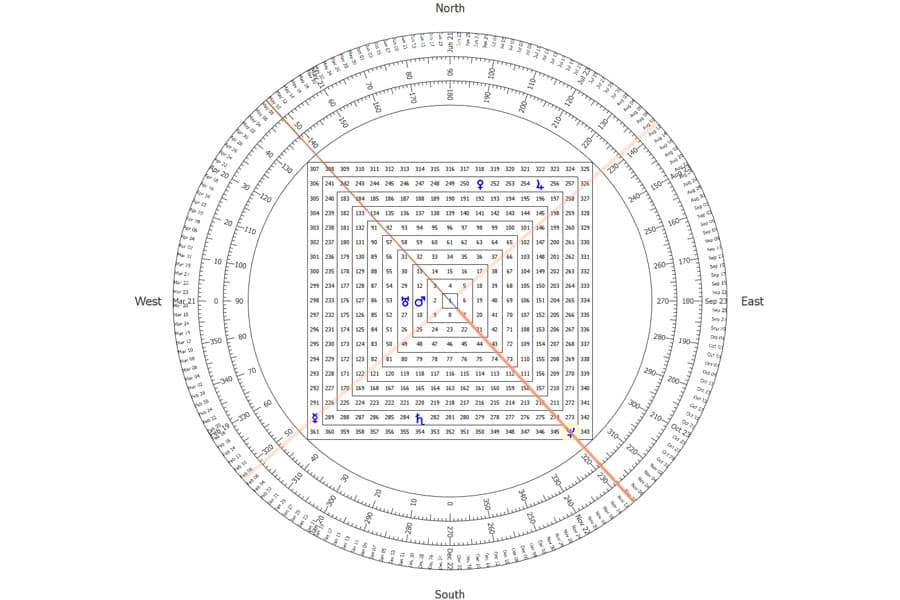
You can imagine a 360-degree circle overlaid on the Square of 9. Every number sits at a specific angle from the center. Rotations around the square (like 90, 180, or 360 degrees) represent significant increments in price or time. These angles are fundamental for calculating future price targets and timing potential market turns using the gann square of nine trading strategy.
Calculating Levels with the Square of 9
While it might look intimidating, calculating key levels using the Square of 9 follows a logical process based on square roots. You can do it by hand or, more commonly today, use specialized calculators when implementing your gann square trading strategy.
Identifying the Starting Point
This is arguably the most critical step. You need to anchor the calculation to a meaningful price point on the chart. This is typically a significant high or low (like an all-time high, a major bottom, or a recent important swing point). The quality of your analysis heavily depends on choosing the right starting price for the gann square trading strategy calculations.
Manual Calculation Method
The math revolves around the square root of your chosen starting price:
- Get the Square Root: Calculate the square root of the starting price (let’s call it √Price).
- Choose the Angle/Rotation: Decide how many degrees you want to project forward or backward (e.g., 90 degrees for the next Cardinal level, 180 for opposition, 360 for a full cycle).
- Find the Increment: A full 360-degree rotation on the square corresponds mathematically to adding or subtracting ‘2’ from the square root. Therefore, other key angles correspond to fractions of 2:
- 45 degrees: Add/Subtract 0.25 (2 / 8)
- 90 degrees: Add/Subtract 0.50 (2 / 4)
- 135 degrees: Add/Subtract 0.75
- 180 degrees: Add/Subtract 1.00 (2 / 2)
- 225 degrees: Add/Subtract 1.25
- 270 degrees: Add/Subtract 1.50
- 315 degrees: Add/Subtract 1.75
- 360 degrees: Add/Subtract 2.00
Add the increment to √Price to find levels above the start price (resistance/targets). Subtract to find levels below (support).
- Calculate New Square Root: Perform the addition or subtraction: (√Price ± Increment).
- Square the Result: Square the value obtained in the previous step: (√Price ± Increment)². This final number is the calculated Gann level for that specific angle.
For instance, if a major low was $64: √64 = 8 For 90-degree resistance: (8 + 0.5)² = (8.5)² = 72.25 For 180-degree resistance: (8 + 1.0)² = (9)² = 81 For 90-degree support: (8 – 0.5)² = (7.5)² = 56.25 For 180-degree support: (8 – 1.0)² = (7)² = 49
This generates the key support and resistance levels radiating from the $64 starting point, usable within a gann square trading strategy.
Using Gann Square of 9 Calculators
Manual calculations can be tedious and prone to error, especially in fast-moving markets. Thankfully, numerous online Gann Square of 9 calculators and software tools automate this process. You simply:
- Input the Price: Enter your chosen starting price (a swing high/low, or sometimes the current price).
- Adjust Step/Pip Value (If Needed): For instruments with very small price units like Forex, you might need to adjust the input price (e.g., multiply EUR/USD price like 1.0850 by 10000 to get 10850) for the square root math to work effectively. Remember to divide the output levels by the same factor.
These calculators instantly provide a range of potential support and resistance levels based on the key Gann angles, making the gann square of 9 trading strategy much more accessible.
Applying the Gann Square of 9 Strategy
With an understanding of the structure and calculations, you can start applying the gann square of 9 trading strategy. The goal is to use the calculated levels and potentially the time elements to inform trading decisions. Effective implementation of the gann square trading strategy relies on careful observation.
Identifying Support and Resistance
This is the most straightforward use. Calculate the Gann levels based on a significant recent pivot point. The levels generated (especially those on the Cardinal and Ordinal crosses) act as potential areas where the price might react.
- If the price approaches a calculated level from below, it’s potential resistance.
- If the price approaches from above, it’s potential support.
Traders then watch the price action at these levels for confirmation – does it bounce off, or does it break through?
Forecasting Price Targets
If the price decisively breaks a Gann support or resistance level, the next Gann level in that direction often becomes the logical target. For example, if price breaks the 90-degree resistance at 72.25 (from our $64 example), the next potential target within the gann square trading strategy would be the 180-degree level at 81.
Identifying Time Turning Points
This is a more advanced aspect of the gann square trading strategy. Gann believed time cycles could be mapped onto the square just like price. By converting degrees to time units (e.g., 90 degrees might equate to 90 trading days, calendar days, or even weeks, depending on the context and timeframe), traders attempt to forecast dates where market turns are more likely. If a major low occurred on June 1st, one might look for potential turns around 90 or 180 days later.
Squaring of Price and Time
Gann placed immense importance on moments when price and time “squared out.” This happens when the price reaches a significant Gann level (e.g., the 180-degree level from a major low) at precisely the corresponding time cycle point (e.g., 180 days after that low). These convergences were considered high-probability points for major trend reversals within the gann square trading strategy framework.
Read More: Elliott Wave Strategy
Developing a Gann Square Trading System
Simply knowing the Gann levels isn’t enough. You need to build a structured trading plan around them. A practical gann square trading strategy requires clear rules for entries, exits, and managing risk.

Defining Entry Signals
How do you enter a trade based on Gann levels?
- Reversal Entry: Look for price to hit a Gann support level and show signs of turning higher (like a bullish candlestick pattern). Enter long. Conversely, enter short if price hits Gann resistance and shows bearish signals.
- Breakout Entry: Enter long when the price clearly breaks above a Gann resistance level, anticipating continuation to the next level. Enter short when price breaks below Gann support. Confirmation (like a candle closing beyond the level) is often preferred.
Setting Stop-Loss Levels
Protecting your capital is vital in any gann square trading strategy. Stop-losses are typically placed just beyond the Gann level that prompted the trade:
- For long entries at support, place the stop slightly below that level.
- For short entries at resistance, place the stop slightly above that level.
- For breakouts, the stop might go back behind the broken level; if hit, it signals the breakout failed.
Adjust the stop distance based on market volatility and your personal risk tolerance.
Determining Profit Targets
Gann levels themselves provide natural profit targets:
- If you entered long at the 90-degree support, your first target might be the original pivot, and the second target could be the 90-degree resistance level above it.
- If you entered short at the 180-degree resistance, your target might be the 90-degree resistance (now acting as potential support) or the original pivot.
Traders might take partial profits at the first level or use trailing stops based on subsequent Gann levels.
Specific Applications
The beauty of the gann square of 9 trading strategy is its adaptability:
- Intraday Trading: Use recent highs/lows from the current or previous day as starting points. Calculated levels can guide entries and exits for short-term trades. Time cycles might be measured in minutes or hours. This is a popular way to use the gann square trading strategy for faster results.
- Swing Trading: Anchor calculations to major swing highs/lows on daily or weekly charts. The resulting levels help define trades held for several days or weeks. Time cycles would typically be measured in days or weeks.
Combining with Other Analysis
While Gann’s methods can be used standalone, many traders find they work best when combined with other technical tools. Using indicators like MACD or RSI to confirm momentum at a Gann level, or identifying traditional chart patterns near these levels, can increase the probability of a successful trade. Relying solely on the gann square trading strategy without any confirmation can be risky.
Practical Examples & Chart Illustrations
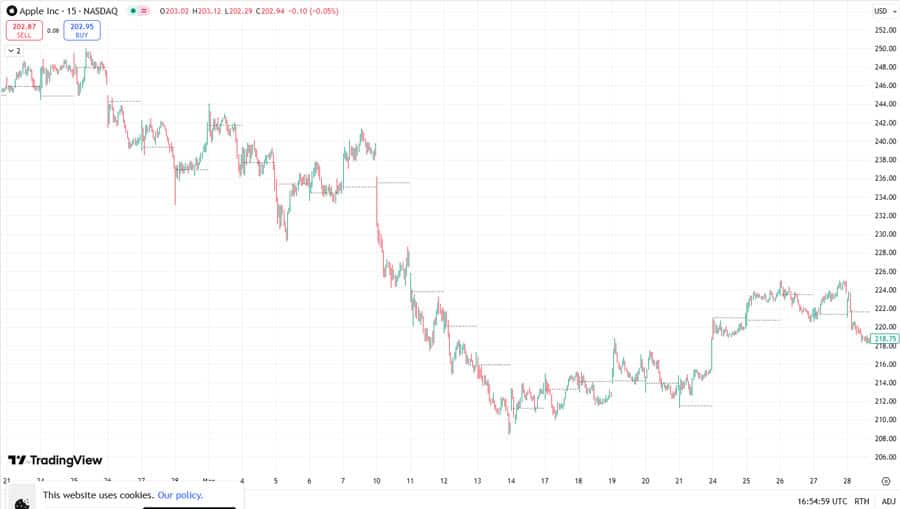
Let’s make this more concrete. Imagine looking at a stock chart, say Apple (AAPL), and applying the gann square trading strategy principles.
Step-by-Step Walkthrough
- Identify a Pivot: Find a significant recent swing high, perhaps at $195. This is our starting point.
- Calculate Levels: Use a Gann calculator with 195 as the input.
- √195 ≈ 13.964
- 90-degree support (below): (13.964 – 0.5)² ≈ (13.464)² ≈ $181.28
- 180-degree support: (13.964 – 1.0)² ≈ (12.964)² ≈ $168.07
- 360-degree support: (13.964 – 2.0)² ≈ (11.964)² ≈ $143.14
- (We calculate support levels since we started from a high).
- Plot Levels: Draw horizontal lines on the AAPL chart at $195 (pivot), $181.28, $168.07, and $143.14.
- Observe Price Action: Watch how AAPL interacts with these lines as part of your gann square trading strategy analysis.
- If the price falls from $195 and finds buying interest near $181.28, showing bullish candle patterns, it could be a long entry signal targeting $195 or higher.
- If price slices through $181.28 without pausing, the next likely area of support is $168.07. A short could be considered on the break, targeting $168.07.
- Strong bounces or breaks are key signals.
- Time Analysis (Optional): Note the date of the $195 high. Project forward 45, 90, 180 days etc., and see if price makes significant moves or finds support/resistance near those dates, especially if near a plotted Gann price level.
Successful vs. Failed Signals
Charts will show times where price respects these calculated levels almost perfectly, offering great trade setups. You’ll also see times when price ignores a level completely or chops around it indecisively. A failed signal might be a bounce off support that quickly reverses and breaks lower, or a breakout above resistance that immediately falls back below. This underscores why confirmation and stop-losses are non-negotiable parts of any trading strategy, including the gann square of nine trading strategy.
Read More: Unconventional Forex Trading Strategies
Advantages of the Gann Square Strategy
Using the Gann Square of 9 approach, as part of a complete gann square trading strategy, can offer traders some unique benefits:
- Forward-Looking: Unlike many indicators that react to past price, Gann’s methods aim to project future potential support, resistance, and turning points.
- Objective Levels: Once the starting pivot is chosen, the calculations provide clear, objective price levels to monitor, reducing guesswork in identifying S/R.
- Integrated Approach: It uniquely combines price, time, and geometric patterns, offering a more holistic view of potential market structure.
- Versatile Application: Gann believed his principles applied universally, so the strategy can potentially be adapted to stocks, forex, commodities, and indices.
Limitations and Criticisms
However, the gann square trading strategy isn’t a magic bullet and comes with significant challenges:
- Complexity: Gann’s overall work is dense and requires considerable effort to grasp fully. The Square of 9 itself has nuances that take time to learn. Mastering the gann square trading strategy is not a quick process.
- Subjectivity in Pivot Selection: Choosing the “correct” starting high or low is crucial but can be subjective. Different traders might choose different pivots, leading to different key levels.
- Requires Practice/Tools: Effective use often necessitates specialized calculators or charting software (like TradingView indicators or dedicated Gann software) and significant practice.
- Forecasting vs. Trading Reality: Predicting a level is not the same as executing a profitable trade. Real-world factors like volatility, slippage, and emotions impact actual results.
- Skepticism: Gann’s methods, especially the time cycle and more esoteric aspects, are often viewed skeptically by mainstream financial academics and may be considered closer to numerology by some.
Explore Advanced Trading with Opofinance
Implementing sophisticated strategies like the gann square trading strategy requires a supportive trading environment. Opofinance, regulated by ASIC, offers features tailored for traders looking beyond the basics:
- Advanced Trading Platforms: Access powerful charting and analysis tools on popular platforms like MT4, MT5, cTrader, and the intuitive OpoTrade. These are ideal for plotting Gann levels and integrating various analytical techniques necessary for a gann square trading strategy.
- Innovative AI Tools: Gain an edge with AI-driven insights from the AI Market Analyzer, personalized feedback from the AI Coach, and responsive AI Support, potentially complementing your Gann analysis.
- Social & Prop Trading: Connect with other traders through social trading features or challenge yourself with proprietary trading opportunities offered by Opofinance.
- Secure & Flexible Transactions: Manage your funds easily with secure deposit and withdrawal options, including cryptocurrencies. Opofinance ensures convenience by charging zero fees on these transactions.

Elevate your trading experience with a broker equipped for the demands of modern strategies.
Conclusion: Weighing Gann’s Method
The gann square trading strategy, particularly focusing on the Square of 9, presents a unique and intriguing method for analyzing financial markets. By weaving together price, time, and geometry, it seeks to forecast key levels and potential turning points, offering a different lens through which to view market dynamics. However, its complexity and the subjectivity involved, especially in choosing starting points, cannot be understated. It demands significant study, practice, and rigorous backtesting. While not a guaranteed path to profit, understanding the gann square trading strategy can add a valuable dimension to a trader’s analytical toolkit when used wisely alongside other methods and disciplined risk management. It remains a fascinating approach within the broader world of technical analysis.
Key Takeaways
- W.D. Gann: Pioneering market theorist focused on mathematical relationships in markets.
- Gann Square of 9: A spiral number chart used to forecast price/time levels via square roots, central to the gann square trading strategy.
- Key Structure: Cardinal (0/90/180/270°) and Ordinal (45/135/225/315°) crosses mark important potential S/R zones.
- Core Calculation: (√Start Price ± Angle Increment)² = Gann Level.
- Uses: Identify S/R, project price targets, forecast potential time turning points.
- Strategy Elements: Define entries (reversals/breakouts at levels), set stops (just beyond levels), target next levels within your gann square trading strategy.
- Challenges: Complex, subjective pivot choice, needs practice/tools.
- Best Practice: Combine with other analysis for confirmation and always use strict risk management.
References: +
What is the difference between the Gann Square of 9 and a Gann Box?
The Gann Square of 9 is primarily a numerical calculator derived from a spiral pattern, used to calculate potential price and time levels based on square root relationships from a chosen starting price. It isn’t usually drawn directly on a price chart. A Gann Box, conversely, is a geometric tool drawn directly onto the price chart, connecting significant highs and lows. It divides the enclosed price and time range into key proportional sections (like eighths or thirds), creating a grid of support/resistance lines and time zones overlaid on the price action. Both stem from Gann’s work, but they are distinct tools in construction and application, though both might be incorporated into a broader technical approach.
Are there specific markets where the Gann Square of 9 strategy works best?
W.D. Gann himself claimed his principles were universal, applicable to stocks, commodities, and futures. Today, traders apply the gann square of 9 trading strategy across all asset classes, including forex. Its perceived effectiveness often depends more on the market’s current behavior (e.g., clear trends vs. choppy ranges) and the skill of the analyst applying the gann square trading strategy rather than the specific market. Markets exhibiting strong trends and respecting geometric patterns might seem more conducive, but correct application is key anywhere.
What are the most common mistakes beginners make when using the Gann Square of 9?
A primary mistake when first attempting a gann square trading strategy is choosing an insignificant starting price pivot, which leads to irrelevant calculated levels. Calculation errors, especially with manual methods or incorrect scaling (pips/decimals), are also common. Another pitfall is treating the levels as absolute buy/sell signals without seeking confirmation from price action or other indicators, and neglecting essential risk management like setting appropriate stop-losses. Finally, misinterpreting or over-emphasizing the time cycle aspect without proper validation can lead to flawed forecasts.


One Response
BEST