In the world of technical analysis, one pattern stands out for its power to signal potential trend reversals—the hammer candlestick pattern. Recognizing this pattern can open doors for traders aiming to capture market shifts before others notice. The hammer candlestick pattern, known for its unique shape and high success rate in forecasting market moves, is crucial for spotting reversals, particularly in volatile forex, stock, or cryptocurrency markets.

If you’re trading with an online forex broker or a regulated forex broker, understanding and applying the hammer candlestick can sharpen your strategy. This article unpacks the structure, variations, and applications of the hammer candlestick pattern, exploring why traders worldwide rely on it as a staple in technical analysis.
Structure of a Hammer Candlestick Pattern
The structure of the hammer candlestick pattern is simple yet distinct, making it easily recognizable to traders across all markets. Its unique shape—resembling a hammer—indicates a potential reversal, giving a visual cue of a shift in market sentiment. Recognizing this pattern accurately is essential for any trader looking to identify trend reversals and make strategic trading decisions.
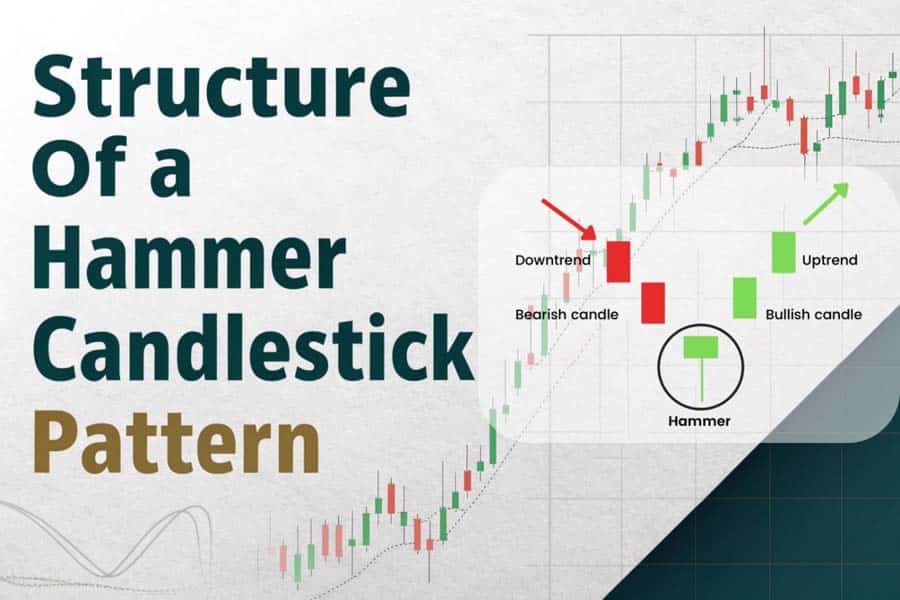
Explore the key components that define the hammer candlestick pattern and its significance in trading.
Key Components of the Hammer Candlestick Pattern
The hammer candlestick pattern has a few distinct features that set it apart from other patterns:
- Small Candle Body: The body of the hammer is small and positioned at the upper end of the price range. This small body signifies that while there was some movement during the trading session, it was limited by the close proximity of the opening and closing prices. In a hammer pattern, this small body represents price consolidation, indicating a potential pause in the current downtrend.
- Long Lower Shadow (Wick): The defining characteristic of the hammer candlestick is its long lower shadow, which is usually twice or more the length of the candle body. This long wick shows that sellers pushed prices significantly lower during the session, only to have buyers step in and drive prices back up near the open. The longer the lower shadow, the stronger the indication that buyers have taken control from sellers, suggesting a possible shift in market sentiment.
- Minimal or No Upper Shadow: In a typical hammer pattern, there is little to no upper shadow. This absence of an upper wick indicates that, after buyers regained control, they managed to keep prices near the upper end of the range without facing significant selling pressure. This lack of an upper shadow reinforces the idea that the market may be ready for a reversal, with sellers losing control over price direction.
- Color of the Candle: While the hammer candlestick can appear in either a bullish (green) or bearish (red) form, a green (bullish) hammer often provides a stronger signal. This is because a green hammer suggests that the close was higher than the open, signaling more robust buying interest and reinforcing the potential for a reversal. However, both colors are considered valid hammer patterns and can indicate a trend reversal.
Read More: Shooting Star Candlestick Pattern
The Hammer’s Shape and Its Market Implications
The shape of the hammer pattern tells a story of market dynamics. As sellers initially push the price lower, the appearance of a long lower shadow shows that buyers returned, willing to absorb the selling pressure and lift the price back up. This shift from a downward move to an upward push indicates that buyers may have started to control the price action, and the existing downtrend may be weakening. The hammer’s structure is an early indicator of a possible bullish reversal, which traders can use to anticipate potential price increases.
The Importance of the Hammer Pattern’s Location in a Downtrend
The hammer pattern is most effective when it appears after an established downtrend. For the pattern to hold significant meaning, it should form after a series of lower lows and lower highs, confirming the market is in a bearish phase. When a hammer appears in a downtrend, it indicates a potential floor or support level where buyers are willing to step in. This positioning strengthens the pattern’s relevance as a reversal signal, suggesting that a bullish move may follow as sellers lose momentum.
Types of Hammer Patterns
Hammer candlestick patterns are versatile indicators that signal potential market reversals. While traders commonly recognize the standard Bullish Hammer, there are variations that carry different implications depending on the trend and structure. Understanding each type of hammer pattern and its role in trading strategy can help traders better interpret market shifts and execute timely trades. Let’s explore the three primary types of hammer patterns and their unique characteristics.
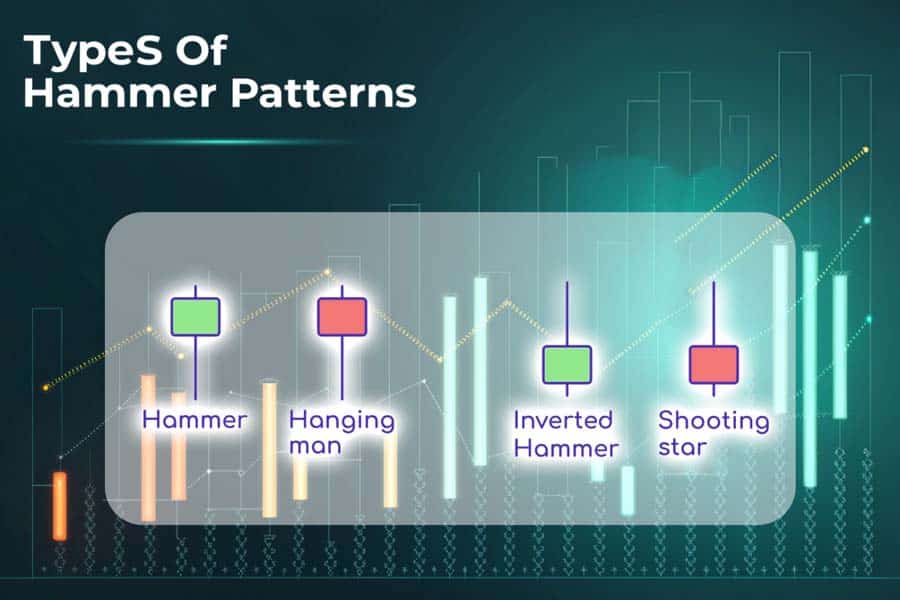
Explore the diverse types of hammer candlestick patterns and their unique market implications.
1. Bullish Hammer Pattern
The Bullish Hammer Pattern is the most common and widely recognized form of the hammer candlestick. It typically appears in a downtrend and signals a potential bullish reversal, where buyers begin to regain control over price action.
- Characteristics:
- Found at the bottom of a downtrend, indicating a possible market reversal.
- Small body located at the upper end, with a long lower shadow at least twice the length of the body.
- Generally, a green (bullish) hammer provides a stronger reversal signal than a red (bearish) hammer, as it shows the price closed higher than it opened.
- Market Implications: The bullish hammer represents a period where sellers initially dominate the session, pushing the price down, but buyers step in aggressively and manage to close near the high of the day. This shift in momentum suggests that the downward trend might be weakening, with buyers potentially initiating a reversal.
- Trading Insight: Traders often look for confirmation by observing the next candlestick. If the following candlestick is bullish and closes above the hammer’s high, it provides further validation that a bullish reversal may be underway, signaling a potential entry point.
2. Bearish Hammer Pattern (Hanging Man)
The Bearish Hammer, often called the Hanging Man, appears in an uptrend and signals a possible bearish reversal. Unlike the standard hammer, the Hanging Man indicates that the uptrend may be losing steam, potentially leading to a downward reversal.
- Characteristics:
- Appears after a prolonged uptrend, where it forms at or near market highs.
- Structure is similar to the bullish hammer, with a small upper body and a long lower shadow.
- The color can be green or red; however, a red Hanging Man generally provides a stronger bearish signal.
- Market Implications: The Hanging Man reflects a day where sellers pushed prices lower, but buyers managed to pull the price back up close to the open. However, the fact that sellers were able to exert significant downward pressure within an uptrend signals a potential weakening of buying interest.
- Trading Insight: When the Hanging Man appears, traders look for confirmation in the following candlestick. A bearish candlestick following the Hanging Man, particularly if it closes below the Hanging Man’s low, can indicate the start of a reversal, signaling traders to consider selling positions.
3. Inverted Hammer Pattern
The Inverted Hammer appears after a downtrend and suggests a potential bullish reversal, but its structure is different. The Inverted Hammer has a long upper shadow and a small body positioned near the low of the session, often with little or no lower shadow.
- Characteristics:
- Forms at the bottom of a downtrend, signaling that a reversal could be on the horizon.
- Small body located at the lower end of the range, with a long upper shadow.
- Color can be green or red, but as with the bullish hammer, a green Inverted Hammer typically signals a stronger bullish reversal potential.
- Market Implications: The Inverted Hammer shows that buyers attempted to push the price higher during the session, though they were ultimately unable to maintain those higher levels. Despite this, the attempt indicates a change in sentiment, with buyers beginning to challenge the prevailing downtrend.
- Trading Insight: Traders often wait for a bullish confirmation, such as a strong bullish candle following the Inverted Hammer. When this confirmation appears, it signals that buyers may be taking control, providing a potential entry point for long positions.
Comparing Hammer Patterns
Each of these hammer patterns plays a unique role in technical analysis:
- The Bullish Hammer is the most straightforward and typically indicates a positive reversal.
- The Hanging Man is a warning of a possible bearish reversal during an uptrend.
- The Inverted Hammer suggests a reversal similar to the Bullish Hammer but requires strong confirmation due to its unique structure.
Understanding the different types of hammer candlestick patterns allows traders to interpret market behavior accurately and anticipate potential reversals. The choice of pattern can also help in selecting appropriate entry and exit strategies for maximum effectiveness in trading.
Read More: Morning Star Candlestick Pattern
Identifying the Hammer Candlestick Pattern
Master the art of identifying hammer candlestick patterns in your trading charts for better decision-making.
Formation Conditions
To correctly identify a hammer pattern, look for the following:
- Downtrend: The market should be in a downtrend for the hammer to indicate a possible reversal.
- Long Lower Shadow: The wick should be at least twice the length of the candle’s body.
- Minimal Upper Shadow: There should be little to no wick above the body.
Example Scenarios
Imagine a scenario where a currency pair, let’s say EUR/USD, is experiencing a downtrend, with consecutive red candles. Suddenly, a hammer candlestick forms with a long lower shadow and a green body. This could be a signal that the downtrend is losing momentum, and buyers are beginning to take control.
Pro Tip for Advanced Traders:
Advanced traders might use volume analysis in conjunction with the hammer candlestick pattern. Higher volume during the formation of a hammer often strengthens the signal, indicating more buyer interest at that price level.
Psychology Behind the Hammer Pattern
The hammer candlestick pattern reveals the psychology of market participants, showcasing a transition from sellers to buyers. In a downtrend, most traders are selling, pushing prices lower. The hammer indicates that sellers initially pushed the price down, but buyers returned to drive it back up, creating the distinct lower wick. This shift demonstrates that bulls are stepping in to counter bearish momentum, often foreshadowing a trend reversal.
In contrast, the inverted hammer, especially when coupled with a regulated forex broker or a technical analysis platform, can hint at potential selling exhaustion at the top of an uptrend, showing a shift in sentiment toward the bears.
Trading Strategies Using the Hammer Candlestick Pattern: A Hands-On Guide
Mastering the hammer candlestick pattern goes beyond just spotting the shape on a chart; it’s about knowing when and how to act. This guide breaks down straightforward strategies for entering trades, setting exits, and managing risks—all based on the hammer’s signals. Here’s how to turn this powerful reversal signal into confident, strategic trades.
Unlock practical trading strategies using the hammer candlestick pattern to enhance your market performance.
1. Entry Points: How to Time Your Trade Entry for Better Results
The hammer candlestick pattern suggests a potential reversal, but confirming this signal with a few more checks can improve the odds. Taking the time to confirm the pattern ensures that you’re aligning with the market’s momentum.
- Wait for the Next Candle’s Confirmation
When a hammer appears, don’t rush to enter. Wait for the next candlestick to close above the hammer’s high. This additional bullish signal shows that buyers are coming in, increasing the likelihood of an upward move. For example, if a hammer appears on a support level and the following candle closes higher, it suggests buyers are stepping in, making this an ideal entry opportunity. - Volume as a Strength Indicator
Volume is a key indicator of strength in a hammer pattern. If the hammer forms with notably higher volume than recent candles, it signals that buyers are coming in strong. For example, a hammer with 50% more volume than the average can give you extra confidence that the market is indeed shifting direction. - Using Fibonacci Levels for Precision
Fibonacci retracement levels can add extra clarity to your hammer pattern trade. If a hammer forms near a key level, such as 61.8%, it signals that a reversal is more likely to happen in this zone. For example, if you see a hammer form at a 61.8% retracement during a downtrend, it reinforces the idea that the market might be ready for an upward turn.
2. Exit Strategies: Setting Targets and Protecting Your Gains
An exit strategy is key to making sure gains don’t slip away, especially when using hammer patterns. Setting clear profit targets and stop-losses can help you lock in profits and minimize losses.
- Take Profits at Key Resistance Levels
Once you’ve entered a trade, set a profit target near the next resistance level. This point is often where the price might pause or reverse, making it a logical area to take profits. For instance, if you enter a trade at a support level with a hammer pattern, setting your target just below a recent resistance can help ensure you capture gains while avoiding potential pullbacks. - Stop-Loss Below the Hammer’s Low
Place your stop-loss just below the hammer’s lower shadow. This way, if the market moves against you, you minimize losses while allowing some flexibility for the trade. For example, if the hammer’s low is $50, a stop-loss at $49.50 gives the trade breathing room while still keeping risk in check.
3. Risk Management: Balancing Reward and Protecting Capital
Risk management is essential when trading hammer patterns, especially since reversals don’t always play out as expected. With a few sound rules, you can keep potential losses small and manage each trade more confidently.
- Set a Risk-to-Reward Ratio of at Least 1:2
Using a minimum risk-to-reward ratio of 1:2 means that your potential profit should be at least double your risk. For example, if your stop-loss is 0.5% below your entry, aim for a profit target of 1% or more. This approach ensures that even if only half your trades are profitable, you can still end up in the green. - Combine with RSI or MACD Indicators
To avoid false signals, consider using the hammer pattern alongside indicators like RSI (Relative Strength Index) or MACD (Moving Average Convergence Divergence). If the RSI is below 30 when the hammer forms, it indicates an oversold condition, which strengthens the case for a bullish reversal. Similarly, if the MACD starts showing a bullish crossover, it further confirms that buyers might be taking control. - Gradual Entry: Scaling into Your Position
Instead of going all in, consider scaling into your position. If the hammer pattern looks strong, buy an initial portion. If the next candle also confirms an upward trend, you can add to the position. This approach reduces risk and gives you the flexibility to adjust if the trend changes.
Example: Applying Hammer Pattern Strategies in Forex Trading
Suppose you’re trading the USD/JPY forex pair and notice a hammer forming on the daily chart near a long-standing support level. The downtrend has been steady, but now you see increased volume on the hammer day, a sign that buyers might be coming in.
- Entry: Wait for the next day’s candle, which closes above the hammer’s high, confirming the potential reversal.
- Profit Target: Set your target 1.5% above your entry, aligning with a resistance level.
- Stop-Loss: Place your stop-loss just below the hammer’s low, protecting your trade in case the reversal doesn’t hold.
Following this step-by-step approach ensures you’re not only recognizing the hammer pattern but trading it effectively in live market conditions. By using clear, strategic rules, you can take full advantage of the hammer pattern’s reversal signals across different markets, from forex to stocks and beyond.
Read More: Doji Candlestick Pattern
Differences Between Similar Patterns
Shooting Star vs. Bullish Hammer
The shooting star looks like an inverted hammer but appears at the top of an uptrend. It signals potential bearish reversal, with the long wick showing rejected buying pressure.
Inverted Hammer vs. Bearish Hammer
While both patterns signal reversals, the inverted hammer points to a possible bullish reversal at the end of a downtrend, while the hanging man indicates potential bearish reversal.
Understanding these subtle distinctions can empower traders to make more accurate decisions, reducing the chance of costly mistakes.
Limitations of the Hammer Candlestick Pattern
The hammer candlestick pattern is not foolproof. False signals can occur, particularly in choppy or range-bound markets. It’s essential to use additional indicators like RSI, MACD, or Bollinger Bands to confirm potential reversals.
How to Mitigate Risks
Using the hammer candlestick pattern in conjunction with other technical indicators increases the probability of accuracy. Relying solely on the hammer without a confirmation strategy can lead to false entries, making it essential to assess market conditions holistically.
Opofinance: A Trustworthy, Regulated Broker for All Traders
If you’re looking for a reliable platform to trade with confidence, Opofinance offers a secure environment backed by ASIC regulation, bringing peace of mind and transparency to every transaction. As an ASIC-regulated broker, Opofinance meets strict standards, ensuring that client funds and trading activities are safe and compliant with global regulatory practices.
One of the standout features of Opofinance is its inclusion in the official MT5 brokers list, providing traders access to the advanced MetaTrader 5 (MT5) platform, known for its robust analytical tools, lightning-fast execution, and flexible trading options across various asset classes. Whether you’re new to trading or an experienced trader, the MT5 platform empowers you with insights and flexibility to make informed decisions.

Key Advantages of Trading with Opofinance
- Social Trading Services: Opofinance offers a social trading feature, allowing traders to follow and copy successful strategies from top traders. This is an excellent opportunity for beginners to learn from professionals and benefit from proven trading tactics while managing risk.
- Safe Deposit and Withdrawal Methods: Opofinance prioritizes convenience and safety in all financial transactions, offering secure deposit and withdrawal methods that cater to traders worldwide. The seamless processes ensure that you can access your funds quickly, so you’re never delayed in taking advantage of market opportunities.
Opofinance’s combination of regulatory oversight, advanced technology, and user-friendly features make it a solid choice for traders of all levels. Ready to take your trading to the next level? Sign up with Opofinance today and experience a world-class trading environment with unmatched support and transparency.
Conclusion
The hammer candlestick pattern is an essential tool in a trader’s arsenal, offering valuable insights into potential market reversals. Its distinct characteristics, such as a small body with a long lower shadow, indicate market indecision and the possibility of a shift in trend. Whether it’s the bullish hammer, bearish hanging man, or the inverted hammer, understanding each type’s implications is crucial for effective decision-making.
Successful trading with the hammer pattern requires more than just identifying the candlestick. Traders must consider the surrounding market context, volume, and confirmation signals from other indicators to avoid false signals. When used in combination with other technical tools like RSI or MACD, the hammer pattern can significantly enhance a trader’s strategy, improving both entry and exit points.
However, it’s important to remember that no pattern is foolproof. Always practice solid risk management techniques and use a combination of tools to maximize your chances of success.
Key Takeaways:
- Hammer Candlestick Pattern is a valuable tool for spotting potential market reversals.
- Different types, such as the bullish hammer, bearish hanging man, and inverted hammer, provide traders with critical market insights.
- Volume and market context are key to confirming the hammer pattern’s reliability.
- Always use additional indicators to improve the accuracy of your trading strategy and manage risk effectively.
By incorporating the hammer candlestick pattern into your trading strategy, you’ll be equipped to make more informed decisions and potentially improve your trading outcomes.
Can the hammer pattern be used on all time frames?
Yes, but the pattern is generally more reliable on higher time frames like the daily or weekly chart, where market noise is minimized.
How do I confirm a hammer candlestick pattern?
Confirmation typically involves waiting for a bullish candle immediately following the hammer, combined with other indicators such as RSI for added confidence.
Are hammer patterns effective in highly volatile markets?
Hammer patterns can be challenging in volatile markets. Additional tools and indicators should be used to verify signals.


