Imagine you’re navigating the fast-paced world of trading, where every second counts and every pattern tells a story. Suddenly, you spot a formation that could signal a pivotal shift in the market—a Hanging Man Candlestick Pattern. This powerful indicator can be the difference between capitalizing on a profitable trend and avoiding costly reversals. The Hanging Man Candlestick Pattern is not just another chart formation; it’s a strategic tool that, when understood and applied correctly—especially with the right broker for forex—can enhance your trading strategies across forex, stocks, and cryptocurrency markets.
In this comprehensive guide, we’ll delve deep into the Hanging Man Candlestick Definition, explore its anatomy, formation, and significance, and equip you with actionable trading strategies. Whether you’re trading with a regulated forex broker like Opofinance or managing your investments independently, mastering the Hanging Man pattern can elevate your trading game. Let’s embark on this journey to unlock the secrets of the Hanging Man Candlestick Pattern and transform your trading approach.
Anatomy of the Hanging Man Candlestick Pattern
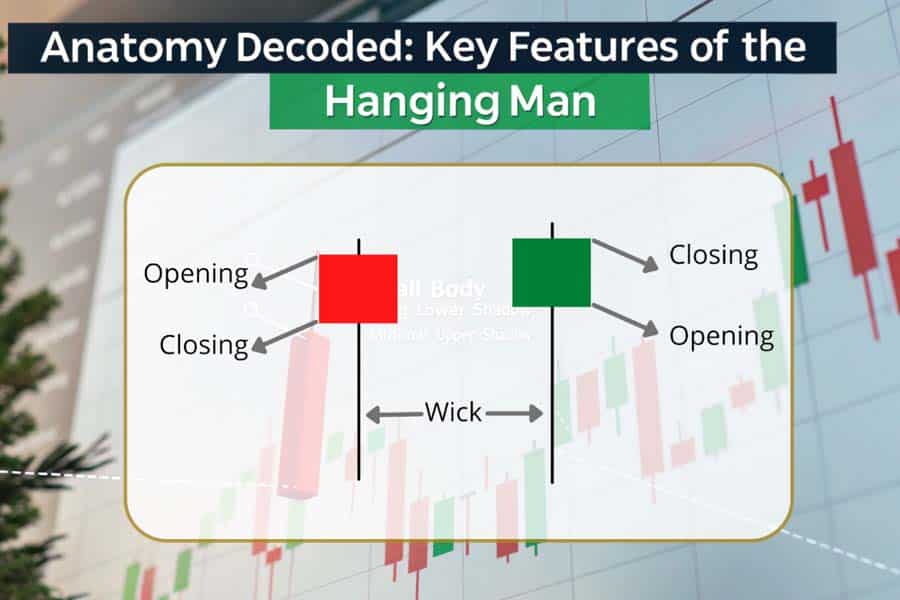
Dive into the structural elements of the Hanging Man candlestick pattern.
Structure and Components
Understanding the Hanging Man Candlestick Pattern begins with dissecting its structure. This pattern is characterized by three main components:
- Small Real Body at the Upper End of the Trading Range: The real body, which represents the difference between the open and close prices, is small and situated near the top of the trading range. This indicates that the opening and closing prices are close to each other, reflecting indecision in the market.
- Long Lower Shadow: The lower shadow is at least twice the length of the real body. This long shadow signifies that sellers pushed the price significantly lower during the trading session, but buyers managed to bring it back up by the close.
- Little to No Upper Shadow: The absence of a significant upper shadow suggests limited selling pressure above the opening price, reinforcing the notion that the upward movement was not sustained.
Color Variations
The Hanging Man Candlestick Pattern can appear in two color variations, each conveying different nuances:
- Bullish Hanging Man: When the real body is green (or white), it indicates that the closing price was higher than the opening price. While still a bearish signal, the bullish color can suggest a less aggressive reversal, potentially indicating a temporary pullback rather than a full trend reversal.
- Bearish Hanging Man: A red (or black) real body signifies that the closing price was lower than the opening price. This variation adds stronger bearish confirmation, signaling a more definitive shift from bullish to bearish sentiment.
Pro Insight: A red Hanging Man Candlestick Pattern at the top of an uptrend provides a more compelling bearish signal compared to its bullish counterpart, making it a crucial indicator for traders looking to safeguard their investments.
Read More: Dark Cloud Cover Candlestick Pattern
Formation and Occurrence of the Hanging Man Pattern
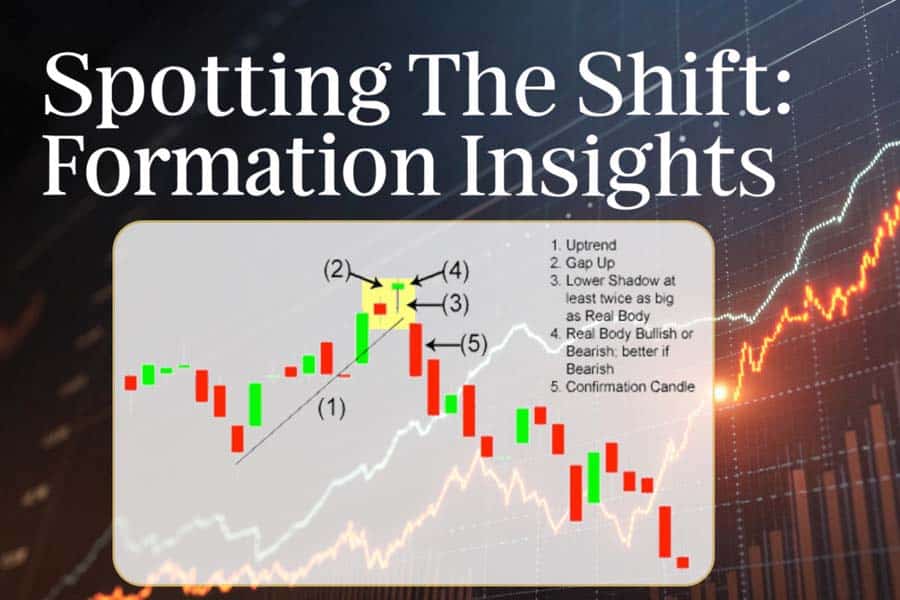
Learn how the Hanging Man forms and signals a change in market dynamics.
Typical Market Conditions Leading to Its Formation
The Hanging Man Candlestick Pattern typically forms under specific market conditions that signal a potential shift in trend dynamics:
- Strong Uptrend: The pattern emerges after a sustained uptrend, where buyers have been consistently driving prices higher. This context is essential for the pattern to signify a reversal rather than a standalone event.
- Exhaustion of Buying Pressure: The long lower shadow reflects significant selling pressure that, despite being countered by buyers, indicates that the upward momentum may be waning.
- Increased Market Volatility: Heightened volatility during the trading session can contribute to the formation of the pattern, as large price swings create the characteristic long lower shadow.
Position Within an Uptrend
For the Hanging Man Candlestick Pattern to hold validity, its position within the market trend is paramount:
- Top of an Uptrend: The pattern must appear near the apex of an uptrend. Its location within this phase transforms it from a mere candlestick formation into a potential warning signal of a trend reversal.
- Proximity to Resistance Levels: When the Hanging Man forms close to established resistance levels or key moving averages, it adds credibility to the reversal signal, as it aligns with areas where selling pressure is historically strong.
Psychological Implications for Traders
The formation of the Hanging Man Candlestick Pattern encapsulates the psychological battle between buyers and sellers:
- Buyers’ Initial Dominance: The pattern begins with buyers pushing the price higher, reflecting bullish sentiment and optimism in the market.
- Sellers Gaining Momentum: As the session progresses, sellers emerge with renewed vigor, driving the price lower. The inability of buyers to sustain the higher price leads to the formation of the long lower shadow.
- Trader Sentiment Shift: The presence of the Hanging Man signals to traders that the bullish sentiment may be weakening, and sellers are starting to gain control, creating uncertainty and caution among bullish traders.
Interpretation and Significance of the Hanging Man Pattern
Indications of Potential Trend Reversal
The Hanging Man Candlestick Pattern serves as a harbinger of possible trend reversals, especially in the following ways:
- Bearish Reversal Signal: The pattern suggests that the upward momentum is losing strength, and a bearish reversal may be imminent. Traders interpret this as an opportunity to consider exiting long positions or initiating short positions.
- Shift in Market Sentiment: The formation reflects a change in market sentiment from bullish to bearish, indicating that sellers are starting to dominate the trading session.
- Price Decline Anticipation: While the Hanging Man alone does not confirm a reversal, it raises the expectation of a potential price decline, prompting traders to prepare accordingly.
Market Sentiment Analysis
Analyzing the Hanging Man Candlestick Pattern within the broader market context provides deeper insights into its significance:
- Exhaustion of Buyers: The small real body signifies that buyers have exhausted their ability to push the price higher, indicating a potential slowdown in the uptrend.
- Emergence of Sellers: The long lower shadow highlights the sellers’ efforts to bring the price down, reflecting increasing selling pressure and the potential for a downward trend.
- Balance of Power: The pattern reveals a shift in the balance of power from buyers to sellers, signaling that the market dynamics are changing in favor of bearish sentiment.
Confirmation Signals to Validate the Pattern
To enhance the reliability of the Hanging Man Candlestick Pattern, traders seek confirmation through additional signals:
- Next Session’s Price Action: A subsequent candlestick that closes below the Hanging Man’s real body strengthens the bearish reversal signal, confirming the pattern’s validity.
- Volume Analysis: Higher trading volume during the formation of the Hanging Man adds weight to the pattern, indicating strong selling interest and increasing the likelihood of a trend reversal.
- Technical Indicators: Utilizing indicators such as the Relative Strength Index (RSI) or Moving Average Convergence Divergence (MACD) can provide corroborative evidence. For instance, an RSI in overbought territory coupled with a Hanging Man can enhance the bearish outlook.
Trading Strategies Using the Hanging Man Candlestick Pattern

Transform candlestick insights into profitable trading strategies.
Identifying the Pattern in Real-Time
Effective trading using the Hanging Man Candlestick Pattern begins with accurate identification in real-time:
- Chart Scanning: Continuously monitor charts, especially on higher timeframes like daily or weekly, to spot the pattern as it forms at the top of uptrends.
- Shadow-to-Body Ratio: Ensure the lower shadow is at least twice the length of the real body, a critical criterion for validating the pattern.
- Contextual Placement: Confirm that the pattern appears near significant resistance levels or key moving averages to enhance its reliability as a reversal signal.
Read More: Shooting Star Candlestick Pattern
Entry and Exit Points
Strategic entry and exit points are essential for maximizing profits and minimizing risks when trading the Hanging Man pattern:
- Entry Point: Enter a short position only after the confirmation of the pattern. This occurs when the next candlestick closes below the real body of the Hanging Man, signaling a confirmed bearish reversal.
- Stop Loss: Place a stop loss order just above the high of the Hanging Man candlestick. This protects against false signals and limits potential losses if the market does not move as anticipated.
- Take Profit: Set take profit levels near established support zones, key Fibonacci retracement levels, or previous swing lows. These targets provide clear exit points to secure profits from the anticipated price decline.
Risk Management Techniques
Implementing robust risk management practices is crucial when trading the Hanging Man pattern:
- Risk-Reward Ratio: Aim for a minimum risk-reward ratio of 1:2. This means for every dollar risked, seek a potential profit of two dollars, ensuring that profitable trades outweigh losses over time.
- Position Sizing: Avoid overleveraging positions based solely on the Hanging Man pattern. Calculate appropriate position sizes based on your overall risk tolerance and account size.
- Diversification: Use the Hanging Man pattern as part of a diversified trading strategy. Combining it with other patterns and indicators can reduce the likelihood of false signals and enhance overall trading performance.
Examples of Successful Trades
Real-world examples illustrate the effectiveness of trading strategies based on the Hanging Man Candlestick Pattern:
- Forex Example: Suppose the EUR/USD pair is in a strong uptrend, approaching a key resistance level. A red Hanging Man forms, followed by a bearish candlestick that closes below the Hanging Man’s body. Entering a short position here, with a stop loss above the resistance level and targeting a support level, could yield a profitable trade as the pair retraces.
- Stock Market Example: Consider a high-growth tech stock experiencing a rapid rise. Near a psychological resistance level, a Hanging Man candlestick appears, indicating potential exhaustion of buying pressure. Confirming the pattern with declining volume and a subsequent bearish candlestick, a trader might initiate a short position, targeting the next support level for a successful trade.
Pro Insight: Combining the Hanging Man pattern with other technical tools, such as trend lines and momentum indicators, can significantly enhance trade accuracy and profitability.
Comparison with Similar Candlestick Patterns
Hanging Man vs. Hammer Candlestick
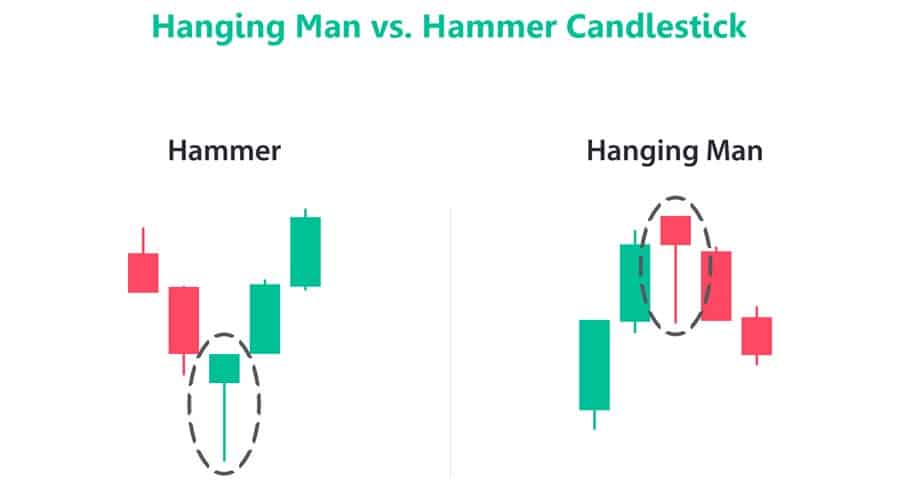
While the Hanging Man Candlestick Pattern shares similarities with the Hammer Candlestick Pattern, they serve different purposes based on their positions within market trends:
- Key Differences:
- Position in Trend: The Hanging Man appears at the top of an uptrend, signaling a potential bearish reversal, whereas the Hammer forms at the bottom of a downtrend, indicating a possible bullish reversal.
- Market Sentiment: The Hanging Man reflects weakening bullish sentiment, while the Hammer signifies a shift towards bullish sentiment.
- Similarities:
- Both patterns feature a small real body and a long lower shadow, highlighting a significant price movement within the trading session.
- Both require confirmation through subsequent price action to validate their signals.
Hanging Man vs. Shooting Star Candlestick
Another pattern often compared to the Hanging Man is the Shooting Star Candlestick Pattern:
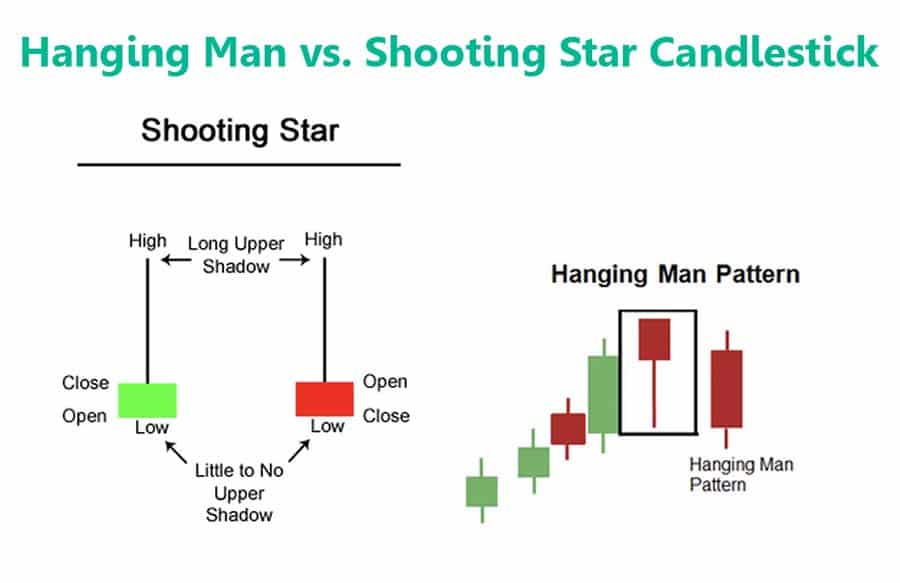
- Distinct Features:
- Upper Shadow: Unlike the Hanging Man, the Shooting Star has a long upper shadow and little to no lower shadow, signaling selling pressure after an initial price rise.
- Position in Trend: The Shooting Star appears at the top of an uptrend, similar to the Hanging Man, but its structure emphasizes different aspects of market sentiment.
- Applications:
- Both patterns indicate bearish reversals, but the Shooting Star emphasizes failed attempts to maintain higher prices, while the Hanging Man highlights sellers’ emergence during an uptrend.
Pro Insight: Understanding the nuanced differences between these patterns ensures accurate recognition and appropriate strategic responses, enhancing overall trading effectiveness.
Read More: Morning Star Candlestick Pattern
Limitations and Considerations of the Hanging Man Pattern
Potential False Signals
While the Hanging Man Candlestick Pattern is a valuable indicator, it is not infallible and can produce false signals:
- Market Noise: In highly volatile or sideways markets, the pattern may appear without leading to a significant trend reversal, resulting in misleading signals.
- Single Pattern Reliance: Relying solely on the Hanging Man without considering other indicators or market context increases the risk of acting on false signals.
Importance of Additional Indicators
To mitigate the risk of false signals, it is essential to use the Hanging Man pattern in conjunction with other technical indicators:
- Relative Strength Index (RSI): An RSI in overbought territory strengthens the bearish signal of the Hanging Man, suggesting that the uptrend may be exhausting.
- Moving Averages: Combining the pattern with moving averages can provide dynamic support or resistance levels, enhancing the reliability of reversal signals.
- Volume Analysis: High trading volume during the formation of the Hanging Man adds validity, indicating significant selling interest.
Market Conditions Affecting Reliability
The effectiveness of the Hanging Man Candlestick Pattern can be influenced by various market conditions:
- Strong Bullish Trends: In exceptionally strong uptrends, the pattern may have less impact, as the prevailing momentum can override the reversal signal.
- Low Liquidity Environments: In markets with low liquidity, price movements may be more erratic, increasing the likelihood of false signals.
- External Market Events: News releases, economic data, and geopolitical events can influence market sentiment and affect the pattern’s reliability.
Pro Insight: Always assess the broader market environment and incorporate multiple indicators to enhance the accuracy and reliability of trading signals based on the Hanging Man pattern.
Practical Examples and Case Studies
Historical Instances of the Hanging Man Pattern
Examining historical instances of the Hanging Man Candlestick Pattern provides valuable lessons for traders:
- S&P 500 in 2020: During the COVID-19 pandemic-induced volatility, the S&P 500 exhibited a Hanging Man pattern near its peak before a significant market correction. Traders who recognized and acted on this pattern managed to mitigate losses during the downturn.
- Bitcoin in 2021: BTC/USD formed a Hanging Man at the $65,000 level, signaling a potential reversal. Following confirmation with a bearish candlestick, traders initiated short positions, capitalizing on the subsequent price retracement.
Analysis of Outcomes
- Successful Trades: In both examples, traders who identified the Hanging Man pattern and awaited confirmation were able to execute timely trades, resulting in profitable outcomes. The key was not just spotting the pattern but also confirming it with subsequent price action and additional indicators.
- Lessons Learned:
- Patience is Crucial: Waiting for confirmation prevents premature entries based on false signals.
- Comprehensive Analysis: Combining the Hanging Man with other technical tools and understanding the broader market context enhances trade accuracy.
- Adaptability: Markets evolve, and the application of the Hanging Man pattern should be flexible to accommodate different trading environments and asset classes.
Lessons for Traders
- Confirmation Before Action: Always wait for the next candlestick to confirm the reversal signal before initiating trades.
- Integrate with Broader Analysis: Use the Hanging Man pattern as part of a comprehensive trading strategy that includes trend analysis, support and resistance levels, and other indicators.
- Continuous Learning: Regularly review past trades to understand how the Hanging Man pattern behaves in various market conditions, refining your strategy accordingly.
Pro Insight: Historical case studies reinforce the importance of not only recognizing the Hanging Man pattern but also applying disciplined trading practices to maximize its effectiveness.
Opofinance Services: Your Partner in Trading Success
When it comes to leveraging the Hanging Man Candlestick Pattern effectively, partnering with a reliable broker can make all the difference. Opofinance stands out as an ASIC-regulated broker offering a suite of services designed to enhance your trading experience:
- Safe and Convenient Transactions: Opofinance ensures seamless deposits and withdrawals, allowing you to focus on your trading strategies without worrying about financial logistics.
- Social Trading Features: Engage with a community of experienced traders through Opofinance’s social trading platform. Follow and copy successful traders, gaining insights and strategies that can complement your use of candlestick patterns like the Hanging Man.
- MT5 Broker Listing: Officially featured on the MT5 brokers list, Opofinance provides access to the robust MetaTrader 5 platform, known for its advanced charting tools, automated trading capabilities, and comprehensive market analysis features.
- Regulated Environment: As an ASIC-regulated broker, Opofinance guarantees a secure and transparent trading environment, ensuring your investments are protected and your trading activities comply with industry standards.

Ready to elevate your trading experience? Join Opofinance today and unlock unparalleled opportunities with cutting-edge tools, expert support, and a secure trading ecosystem.
- Start Trading with Opofinance Today! Join Now
Conclusion
The Hanging Man Candlestick Pattern is an indispensable tool for traders aiming to navigate the complexities of financial markets with precision and confidence. By understanding its anatomy, formation, and significance, you can harness its power to anticipate potential trend reversals and make informed trading decisions.
However, the true strength of the Hanging Man pattern lies in its integration with comprehensive trading strategies and confirmation signals. Relying solely on this pattern without considering the broader market context and additional technical indicators can lead to false signals and suboptimal trading outcomes.
Partnering with a reputable, regulated forex broker like Opofinance further enhances your trading capabilities, providing you with the necessary tools and support to implement effective strategies. Whether you’re a seasoned trader or just starting, mastering the Hanging Man Candlestick Pattern can significantly contribute to your trading success.
Key Takeaways
- Hanging Man Candlestick Pattern Defined: A bearish reversal pattern forming at the top of an uptrend, characterized by a small real body, long lower shadow, and minimal upper shadow.
- Significance in Trading: Indicates weakening bullish momentum and the potential for a trend reversal, allowing traders to anticipate and act on market shifts.
- Strategic Trading Tips: Always confirm the pattern with subsequent price action and additional indicators like RSI or MACD before executing trades.
- Opofinance Advantage: Trading with Opofinance offers a secure, regulated environment with advanced tools and social trading features, enhancing your ability to leverage patterns like the Hanging Man effectively.
How does the Hanging Man candlestick pattern compare to other reversal patterns?
While the Hanging Man is a reliable bearish reversal signal, it differs from other patterns like the Engulfing Pattern or Doji. The Hanging Man specifically indicates a potential reversal at the top of an uptrend with its distinct long lower shadow, whereas other patterns may signal reversals in different contexts or market conditions. It’s essential to use the Hanging Man in conjunction with other indicators to confirm its signals.
Can the Hanging Man pattern be applied to all financial markets?
Yes, the Hanging Man Candlestick Pattern is versatile and can be applied across various financial markets, including stocks, forex, commodities, and cryptocurrencies. Its effectiveness may vary depending on the asset’s volatility and trading volume, but the fundamental principles remain consistent, making it a valuable tool for traders in different markets.
What timeframes are most effective for trading the Hanging Man pattern?
The Hanging Man Candlestick Pattern is most effective on higher timeframes such as daily, weekly, or even monthly charts. These timeframes tend to filter out short-term market noise, providing more reliable signals. However, it can also be used on shorter timeframes like 4-hour or hourly charts for more active trading strategies, provided proper risk management techniques are employed.


