The Harami candlestick pattern is a game-changer in the world of trading, acting as a beacon for savvy traders seeking to navigate the turbulent waters of market reversals. Imagine standing at the edge of a cliff, watching the tide shift beneath you—this pattern captures that pivotal moment when momentum falters and new opportunities arise. With roots in Japanese candlestick charting, the Harami pattern not only provides visual cues but also reveals the psychological battle between buyers and sellers, making it an essential tool for anyone serious about maximizing their trading success.
The Harami candlestick pattern meaning comes from the Japanese word for “pregnant,” reflecting its visual appearance. The pattern consists of two candles: a large “mother” candle followed by a smaller “baby” candle. This combination signifies a potential reversal in the prevailing trend, making it a cornerstone for many traders.
If you’re trading with a regulated forex broker, you can optimize your trades by combining the Harami pattern with additional tools like moving averages or RSI for confirmation. This article will guide you through the pattern’s components, types, applications, and strategies, ensuring you can leverage it effectively in your trading decisions.
What Is the Harami Candlestick Pattern?
The Harami candlestick pattern is a two-candle charting formation that holds significant importance in technical analysis due to its ability to signal market indecision and potential trend reversals. Its unique structure makes it a valuable tool for traders seeking to identify shifts in market momentum early.
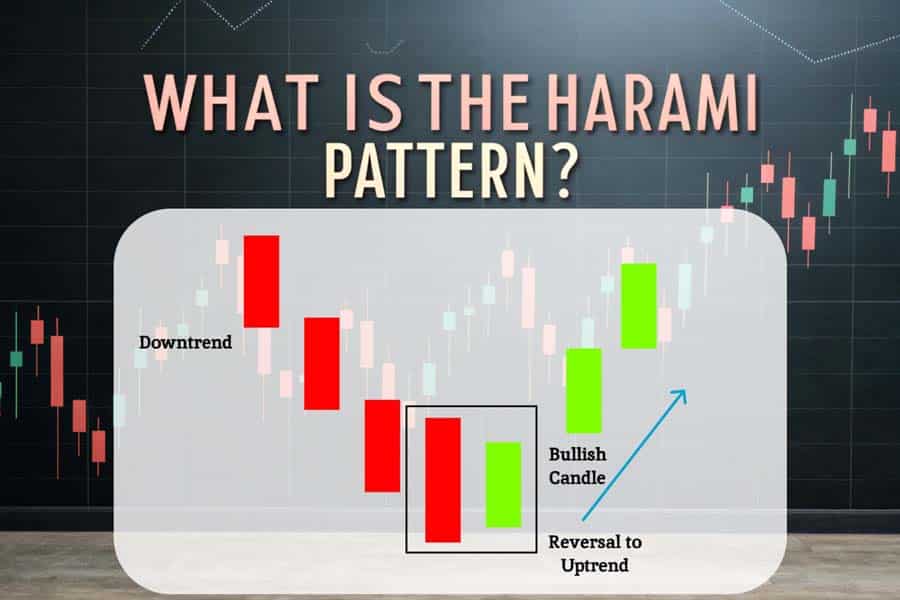
Discover the significance of the Harami pattern in trading.
Key Elements of the Harami Candlestick Pattern
- The “Mother” Candle
- A large candlestick representing the dominant trend in the market.
- This candle typically signals strong market momentum, either bullish (uptrend) or bearish (downtrend).
- The “Baby” Candle
- A smaller candlestick that is entirely within the body of the mother candle.
- This smaller candle indicates a slowdown in momentum, suggesting uncertainty among traders about the prevailing trend.
This formation reflects a critical pause in the market, where traders reassess their positions, leading to potential price reversals.
Historical Context
The term “Harami” comes from Japanese, meaning “pregnant.” This name perfectly describes the visual representation of the pattern, where the smaller “baby” candle is nestled within the larger “mother” candle.
The Harami pattern originates from Japanese candlestick charting techniques, a method developed centuries ago by rice merchants to predict price movements. Today, it is widely adopted by modern traders for its reliability and ability to simplify complex market behaviors into actionable signals.
Why Is the Harami Pattern Significant in Trading?
- Early Signal for Trend Reversals
The Harami candlestick pattern serves as an early warning sign of a potential reversal in the market.- A Bullish Harami suggests that a downtrend may be losing momentum, hinting at an upcoming uptrend.
- A Bearish Harami signals the weakening of an uptrend, indicating potential downward movement.
- Market Sentiment Indicator
The pattern captures the psychological tug-of-war between buyers and sellers. The mother candle represents a dominant side, while the baby candle reflects hesitation or a shift in sentiment. - Broad Applicability Across Markets
Whether in the forex market, stock trading, or commodities, the Harami pattern’s versatility ensures it can be used effectively across different asset classes.
An Easy Analogy for Clarity
Think of the Harami pattern as a large ship (the mother candle) that slows down in a calm sea (the baby candle). This slowdown suggests a potential change in direction—just as the market may pivot after a Harami formation.
This combination of historical reliability, psychological insight, and clear visual representation makes the Harami candlestick pattern a trusted ally for traders aiming to stay ahead of market trends.
Key Components of the Harami Pattern
The Harami candlestick pattern is defined by two distinct candlesticks that carry significant implications for market analysis. Each component plays a critical role in identifying this pattern and its potential impact on market trends.
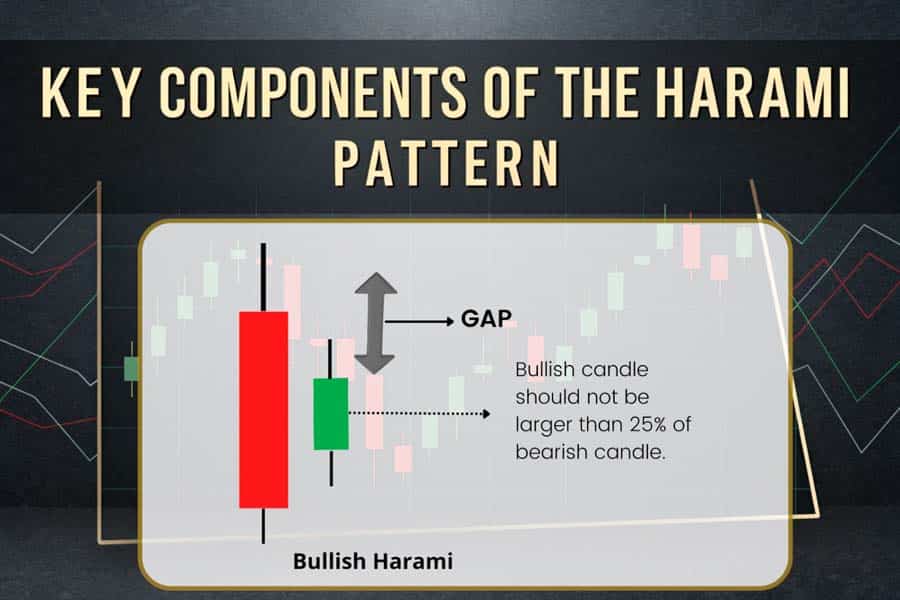
Explore the essential components that define the Harami pattern.
1. The Mother Candlestick
The mother candlestick represents the dominant trend in the market and forms the foundation of the Harami pattern.
- Prevailing Market Trend: This candle reflects the strength of the current trend, whether bullish or bearish.
- Size and Significance: It is characterized by its large body, which stands out compared to surrounding candles.
- Momentum Indicator:
- A bullish (green) mother candlestick indicates strong upward momentum.
- A bearish (red) mother candlestick suggests strong downward pressure.
Think of the mother candlestick as a market’s “statement” of dominance, showing clear control by either buyers or sellers.
2. The Baby Candlestick
The baby candlestick is a smaller, subdued candle entirely contained within the body of the mother candlestick.
- Market Hesitation: This smaller candle reflects indecision or hesitation among traders.
- Size and Positioning:
- The baby candle’s body and shadows do not breach the mother candle’s body.
- Psychological Insight: It signals that the dominant trend may be losing steam, providing an opportunity for a potential reversal.
This subtle shift in size reflects a “pause” in the market’s confidence, hinting at a possible change in direction.
3. Color Significance of the Candles
The interplay of colors between the mother and baby candlesticks provides crucial clues about market sentiment.
Bullish Harami
- Color Sequence: A bearish (red) mother candlestick is followed by a bullish (green) baby candlestick.
- Implication: This suggests that the downward trend is weakening, and upward momentum may follow.
Bearish Harami
- Color Sequence: A bullish (green) mother candlestick is followed by a bearish (red) baby candlestick.
- Implication: This indicates a potential end to the upward trend, with a likely downward move on the horizon.
The contrast in colors between the two candles amplifies the visual clarity of the Harami pattern, making it easier for traders to spot emerging opportunities.
Why These Components Matter
The combination of the mother candlestick’s dominance and the baby candlestick’s hesitation captures a moment of market tension. This tension often precedes a significant price movement, offering traders the chance to act decisively.
By understanding these components in detail, traders can interpret the Harami candlestick pattern more effectively and use it as a reliable indicator of market shifts.
Read More: Shooting Star Candlestick Pattern
Types of Harami Patterns
The Harami candlestick pattern comes in two primary forms: the Bullish Harami and the Bearish Harami. Each type has unique characteristics, implications, and conditions under which it forms, providing traders with actionable insights into market sentiment.

Learn about the two primary types of Harami patterns.
1. Bullish Harami
The Bullish Harami is a reversal pattern that signals a potential shift from a downtrend to an uptrend, making it particularly valuable for identifying buying opportunities.
Formation Criteria
- Appears during a downtrend, often after sustained bearish momentum.
- The first candlestick is large and bearish (red), showcasing the strength of the downtrend.
- The second candlestick is smaller and bullish (green), completely engulfed within the body of the first candle.
Market Implications
The Bullish Harami reflects a loss of selling pressure, indicating that buyers might be preparing to re-enter the market.
- Sellers dominate initially but fail to maintain control, as buyers begin to push back.
- This shift often leads to a trend reversal or at least a temporary upward correction.
Ideal Conditions
- Most effective in oversold markets where downward momentum is exhausted.
- Commonly observed near key support levels, which act as a floor for prices.
Example
Consider the EUR/USD pair in a downtrend. If a Bullish Harami forms near a support zone at 1.1000, it might signal an opportunity to go long, expecting a reversal or upward bounce.
Advanced Tip
To confirm the reliability of a Bullish Harami, pair it with technical indicators like:
- Relative Strength Index (RSI): Look for values below 30 to confirm oversold conditions.
- Stochastic Oscillator: A bullish crossover in oversold regions strengthens the signal.
Proven strategies like this can help you capture market reversals with confidence and precision.
Read More: Evening Star Candlestick Pattern
2. Bearish Harami
The Bearish Harami signals a potential reversal from an uptrend to a downtrend, alerting traders to possible shorting opportunities.
Formation Criteria
- Appears during an uptrend, typically after sustained bullish momentum.
- The first candlestick is large and bullish (green), representing strong buying pressure.
- The second candlestick is smaller and bearish (red), entirely within the body of the first candle.
Market Implications
The Bearish Harami suggests that buyers are losing steam, and sellers may be gearing up to regain control.
- The smaller bearish candle indicates hesitation among buyers and a potential reversal in sentiment.
- Often, this leads to a downward move or at least a temporary pullback.
Ideal Conditions
- Frequently observed in overbought markets, where upward momentum is waning.
- Commonly forms near resistance levels, where prices struggle to break higher.
Example
Imagine GBP/USD is in an uptrend and approaches a resistance level at 1.3000. A Bearish Harami forms, signaling a potential opportunity to short the pair as a reversal looms.
Advanced Tip
Enhance the reliability of a Bearish Harami by confirming with:
- RSI: Look for values above 70 to indicate overbought conditions.
- Volume Analysis: A decline in volume during the second candle strengthens the bearish reversal signal.
Why Recognizing These Patterns Is Crucial
Understanding the Bullish and Bearish Harami patterns allows traders to:
- Time their entries and exits with greater precision.
- Reduce risks by aligning trades with broader market trends.
- Maximize profits by acting on early reversal signals.
By mastering these patterns, traders can capitalize on market transitions, turning hesitation into profitable opportunities.
How to Identify Harami Patterns on Charts
The Harami candlestick pattern stands out on charts for its distinct visual and contextual features. Proper identification is crucial to harness its full potential in trading strategies.
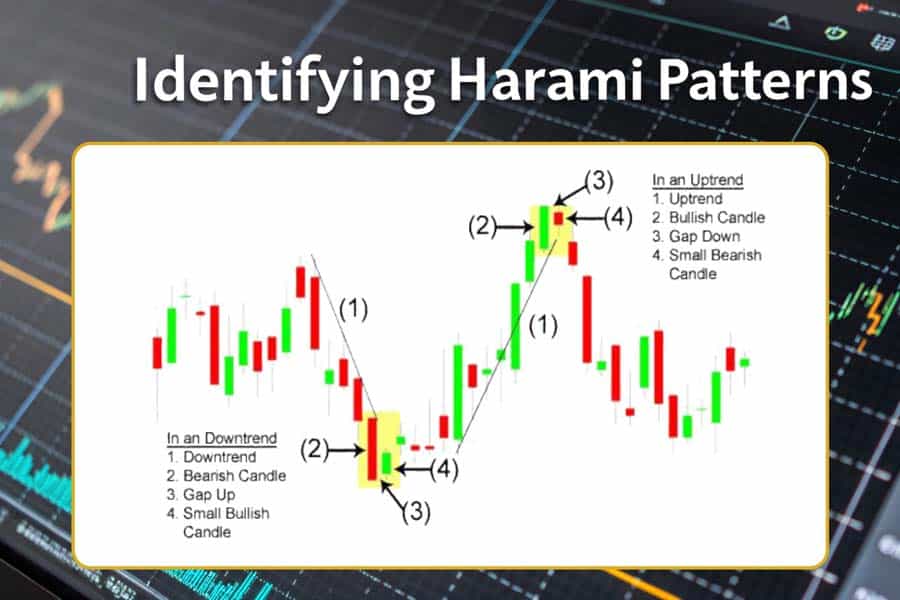
Master the art of spotting Harami patterns on trading charts.
1. Visual Recognition
Accurate visual analysis is the first step to spotting Harami patterns. Follow these guidelines:
- Look for Engulfment: The baby candlestick must be entirely engulfed within the body of the mother candlestick. This means the high and low of the smaller candle stay within the range of the larger one.
- Trend Context Matters:
- For a Bullish Harami, the pattern should form during a downtrend to signal potential reversal upward.
- For a Bearish Harami, the pattern should emerge during an uptrend, hinting at a reversal downward.
- Candle Size Difference: The stark contrast in the sizes of the two candles helps confirm the pattern.
Visualizing the interplay between these candlesticks is like watching a tug-of-war where one side is losing steam.
2. Key Indicators for Confirmation
While the pattern is visually apparent, confirm its validity with these technical tools:
Volume Analysis
- A decline in volume during the formation of the baby candlestick often validates the market’s indecision.
- Look for increased volume in the subsequent breakout direction for stronger confirmation.
Oscillators
- RSI (Relative Strength Index):
- Values below 30 for Bullish Harami indicate oversold conditions.
- Values above 70 for Bearish Harami suggest overbought conditions.
- MACD (Moving Average Convergence Divergence):
- Crossovers in MACD can confirm a momentum shift aligning with the Harami signal.
Trendlines and Levels
- The Harami pattern gains more credibility when it aligns with key support (for Bullish Harami) or resistance levels (for Bearish Harami).
- A trendline breakout in the direction of the anticipated reversal reinforces the signal.
Pro Tip: Use chart annotations to track and review Harami patterns and their success rates over time. This practice sharpens pattern recognition and builds confidence.
3. Common Mistakes to Avoid
Mistakes in recognizing and interpreting the Harami pattern can lead to false signals. Avoid these pitfalls:
- Misinterpreting Non-Harami Candles: Ensure the baby candlestick is entirely within the mother candlestick’s range. A partial overlap does not qualify.
- Ignoring Market Trends: Confirm the broader market trend before acting. A Bullish Harami in an uptrend or a Bearish Harami in a downtrend often produces unreliable signals.
- Neglecting Indicator Confirmation: Overreliance on visual cues without validating through RSI, MACD, or trendlines can lead to costly errors.
Avoiding these mistakes ensures you trade on solid signals and reduces the risk of false entries.
Read More: Engulfing Candlestick Pattern
Trading Strategies Using the Harami Pattern
Once identified, the Harami pattern offers actionable strategies for both entry and risk management.

Unlock effective trading strategies using the Harami pattern.
1. Entry Points
Timing is critical when trading Harami patterns:
- Bullish Harami:
- Enter a long position when the price breaks above the high of the baby candlestick.
- This breakout confirms the shift in sentiment from bearish to bullish.
- Bearish Harami:
- Enter a short position when the price falls below the low of the baby candlestick.
- This indicates the market is transitioning from bullish to bearish sentiment.
2. Stop-Loss Placement
Minimizing risk is as important as identifying the right entry:
- Place stop-loss orders just beyond the range of the mother candlestick.
- For a Bullish Harami, set the stop-loss slightly below the mother candle’s low.
- For a Bearish Harami, set it slightly above the mother candle’s high.
This placement protects against unexpected market movements while keeping risk manageable.
3. Exit Strategies
Maximizing gains while protecting profits is crucial:
- Profit Targets: Use prior support (for Bullish Harami) or resistance levels (for Bearish Harami) as benchmarks for exits.
- Trailing Stops: Implement trailing stop-losses to lock in gains and allow for potential continuation in the favorable direction.
4. Combining with Other Indicators
Enhance the reliability of your trades by using additional technical indicators:
- RSI: Helps confirm whether the market is overbought (Bearish Harami) or oversold (Bullish Harami).
- Moving Averages: Align trades with the broader trend direction. For instance, a Bullish Harami above the 200-day moving average is more reliable.
- MACD: A MACD crossover supports the Harami signal, offering additional confidence in the trade.
Why These Strategies Work
The combination of visual analysis, technical indicators, and disciplined risk management ensures that trades based on the Harami pattern are backed by solid evidence. These strategies empower traders to act with confidence and precision, transforming market hesitation into opportunities.
Understanding the Psychology Behind the Harami Pattern
The Harami candlestick pattern is not only a technical indicator but also a reflection of the market’s underlying psychology. Understanding the emotional forces at play during the formation of this pattern can help traders make more informed decisions, as it reveals when market sentiment is shifting. By recognizing these psychological shifts, traders can anticipate potential reversals and adjust their strategies accordingly.

Delve into the psychological dynamics that influence the Harami pattern.
1. The Bullish Harami: From Bearish Dominance to Potential Reversal
The Seller’s Loss of Control
A Bullish Harami typically forms after a strong downtrend, where the market has been dominated by sellers. However, when the second, smaller candlestick (the “baby”) appears within the body of the larger bearish candlestick (the “mother”), it suggests that the bearish momentum is starting to fade.
What It Means for Market Sentiment
- Sellers Are Exhausted: The large bearish candle indicates a period of selling dominance. When the second candle fails to continue the downtrend and instead shows a bullish move, it signifies a shift in control—buyers are starting to enter the market.
- Trader Mindset: This shift can trigger a sense of hope and confidence among traders that the downtrend may be coming to an end. The indecision signaled by the Harami pattern might prompt traders to enter long positions, anticipating an upward reversal.
Why Traders Act on It
Traders are often on the lookout for signs of an oversold market, and the Bullish Harami is seen as a confirmation that the market may be ready for a rebound. When combined with other indicators, such as RSI showing oversold conditions, the potential for a profitable long trade increases.
2. The Bearish Harami: From Bullish Optimism to Market Disruption
The Buyer’s Loss of Momentum
A Bearish Harami forms after a prolonged uptrend. The first candle, a large bullish candle, suggests strong buyer sentiment. But when a small bearish candle forms within its range, it signals that the upward momentum is losing steam.
What It Means for Market Sentiment
- Buyers Are Fading: The large bullish candlestick shows a period of strong buying, but the formation of the smaller bearish candle indicates hesitation from the buyers, who may be losing confidence.
- Trader Mindset: This shift leads traders to consider that the uptrend may be ending, and a reversal may be imminent. In this case, traders start questioning the sustainability of the uptrend, leading them to consider short positions.
Why Traders Act on It
The Bearish Harami is a sign that the market is losing bullish momentum. Traders, particularly those who use reversal strategies, view this as a signal to enter short positions. It often appears near resistance levels, making it a reliable pattern for catching potential bearish movements.
3. The Battle of Bulls vs. Bears: A Key to Recognizing Market Shifts
At the heart of the Harami pattern is a psychological battle between bulls and bears. The pattern symbolizes a moment of indecision, where one side is weakening but hasn’t entirely lost control. This dynamic provides crucial insights into the market’s emotional state and can be a valuable indicator of an impending trend reversal.
Indecision at the Core
- Bullish Harami: Signals a shift in momentum where sellers are tiring and buyers may be taking over, albeit cautiously.
- Bearish Harami: Marks a time when buyers are hesitant, and sellers may begin to dominate, threatening the continuation of the uptrend.
Trader Emotional Triggers
Traders often feel the emotional weight of these shifts:
- For a Bullish Harami, the emotional trigger may be hope—hope that the market will turn around after a long decline. This triggers action, as traders look to capitalize on a potential upward move.
- For a Bearish Harami, the emotional trigger may be fear—fear that the market is overbought and that a correction or trend reversal is imminent. This fear encourages traders to act quickly before the market turns against them.
4. How Traders Use the Harami Pattern to Navigate Market Sentiment
The Harami pattern is more than just a candlestick formation—it’s a tool for reading the market’s emotional landscape. By recognizing the psychological shifts it represents, traders can fine-tune their strategies for more accurate trade entries and exits.
Bullish Harami: A Signal for Cautious Optimism
- Traders enter long positions when they see a Bullish Harami after a downtrend, but with a focus on confirming the signal with additional indicators (e.g., RSI for oversold conditions). The formation suggests a potential reversal, but traders stay vigilant, watching for confirmation before making a move.
Bearish Harami: A Sign of Potential Downturn
- When a Bearish Harami forms during an uptrend, traders begin to consider shorting the market. The smaller bearish candle within the larger bullish one suggests that the market may no longer be able to sustain the uptrend. Combined with resistance levels, it becomes a clear signal that the trend could reverse.
Opofinance Services: A Reliable Partner for Traders
Looking for a trusted online forex broker to enhance your trading experience? Opofinance, regulated by ASIC, offers exceptional trading solutions tailored to your needs. Its inclusion on the MT5 brokers list highlights its credibility and reliability.

Why Choose Opofinance?
- Social Trading: Learn and replicate strategies from top traders in real-time.
- Secure Transactions: Enjoy safe and convenient deposits and withdrawals.
- Comprehensive Tools: Access advanced charts, indicators, and educational resources.
Opofinance empowers traders at all levels to excel in the markets with a seamless and user-friendly platform.
Conclusion
The Harami candlestick pattern is a crucial tool in technical analysis, recognized for its ability to signal potential market reversals. Understanding the Harami candlestick pattern meaning is essential for traders aiming to improve their market timing and profitability. This pattern consists of two candles: a large “mother” candle followed by a smaller “baby” candle, which together indicate a shift in market sentiment.The significance of the Harami pattern lies in its ability to capture moments of indecision among traders, often leading to trend reversals. A Bullish Harami suggests that a downtrend may be losing momentum, signaling a potential upward movement, while a Bearish Harami indicates that an uptrend may be weakening, hinting at possible downward pressure. By recognizing these patterns early, traders can position themselves effectively to capitalize on emerging opportunities.Incorporating the Harami candlestick pattern into your trading strategy can enhance your decision-making process. It is advisable to combine this pattern with other technical indicators, such as RSI or moving averages, for confirmation. This approach not only validates the signals provided by the Harami pattern but also helps in managing risks more effectively.In summary, mastering the Harami candlestick pattern strategy is vital for traders looking to navigate market fluctuations successfully. By understanding its components and implications, traders can leverage this powerful indicator to identify potential reversals and make informed trading decisions. Embracing the psychological insights behind the Harami pattern can further enhance trading performance, turning moments of uncertainty into profitable opportunities.
Key Takeaways
- The Harami pattern consists of two candlesticks: a larger mother candlestick and a smaller baby candlestick.
- Bullish Harami indicates potential upward reversals, while Bearish Harami hints at downward reversals.
- Combine the pattern with RSI, MACD, or trendlines for improved accuracy.
- Avoid relying solely on the Harami pattern without additional confirmation.
- Partnering with a trusted forex trading broker like Opofinance can amplify your success.
How can I differentiate between a Bullish and Bearish Harami?
To differentiate between a Bullish and Bearish Harami, observe the color and position of the candles. A Bullish Harami appears during a downtrend, featuring a large bearish (red) mother candle followed by a smaller bullish (green) baby candle. In contrast, a Bearish Harami forms during an uptrend, characterized by a large bullish (green) mother candle followed by a smaller bearish (red) baby candle. This distinction is crucial for interpreting market sentiment and potential reversals.
What are the best market conditions to trade the Harami pattern?
The best market conditions for trading the Harami pattern are typically found at key support or resistance levels. For a Bullish Harami, look for this pattern in oversold markets near support levels, indicating that selling pressure may be waning. For a Bearish Harami, it is most effective in overbought markets near resistance levels, suggesting that buying momentum is fading. This context enhances the reliability of the signals provided by the Harami pattern.
Can the Harami candlestick pattern be used in all financial markets?
Yes, the Harami candlestick pattern is versatile and can be applied across various financial markets, including forex, stocks, and commodities. Its ability to signal potential reversals makes it a valuable tool for traders regardless of the asset class. However, traders should always consider the specific characteristics of each market and adjust their strategies accordingly.


