

Knowing how to use macd and rsi indicator together is about building a complete trading system, not just reacting to blinking lights on a chart. While many traders learn what these tools do in isolation, the real edge comes from combining the MACD’s momentum insights with the RSI’s strength measurement. This synergy allows you to confirm high-probability setups and avoid false signals. To execute these strategies effectively, partnering with a reliable and regulated forex broker is paramount. This article provides a definitive, rule-based framework for integrating these two powerful indicators into a cohesive strategy for both reversal and trend-following opportunities.
Key Takeaways
- Synergy is Key: MACD tracks momentum and trend direction, while RSI measures the speed and strength of price movements, identifying overbought or oversold conditions. Using them together provides a system of confirmation.
- Two Core Strategies: This guide details two actionable strategies: High-Probability Reversals (using RSI divergence + MACD crossover) and Advanced Trend Continuation (using MACD trend filter + RSI pullbacks).
- Rules Over Emotion: A successful strategy is built on a non-negotiable set of rules for entry, exit, and risk management. This article provides a professional pre-trade checklist.
- Confirmation is Mandatory: The core principle is to use one indicator to form a hypothesis (e.g., RSI divergence suggests a potential reversal) and the other for confirmation (e.g., a MACD crossover triggers the entry).
- Context is Everything: The effectiveness of these strategies hinges on considering the higher timeframe trend and avoiding choppy, sideways markets where these indicators are prone to generating false signals.
From Indicators to a Cohesive Strategy

Many aspiring traders fall into the trap of “indicator clutter,” plastering their charts with every tool available, hoping one will magically predict the market’s next move. Experience teaches us this approach rarely works. The path to consistent profitability lies not in finding the perfect single indicator, but in building a cohesive strategy where multiple, non-correlated indicators work together to tell a more complete story. This is where learning how to use macd and rsi indicator in tandem becomes a game-changer.
Why Single Indicators Fail
Relying on a single indicator is like trying to navigate with only a speedometer. It tells you how fast you’re going, but not if you’re heading in the right direction or if there’s a cliff ahead. The RSI might scream “overbought,” but in a strong uptrend, the price can remain overbought for extended periods, stopping you out repeatedly. Similarly, a MACD crossover might signal a new trend, but it could be a false move in a ranging market. Single indicators provide a single data point, which is often insufficient for making a high-quality trading decision.
The MACD + RSI Synergy: Momentum & Strength
The power of combining the Moving Average Convergence Divergence (MACD) and the Relative Strength Index (RSI) lies in their complementary nature. They measure different aspects of price action:
- MACD is a momentum and trend-following indicator. It helps you identify the direction and force of the current trend.
- RSI is a momentum oscillator. It measures the speed and magnitude of recent price changes, helping you gauge trend strength and identify potential exhaustion points.
Together, they create a system of checks and balances. The RSI can warn you that a trend is losing steam, while the MACD can confirm when the momentum has actually shifted. This synergy is fundamental to understanding how to use macd and rsi indicator effectively.
The Professional Goal: Confirmation, Not Prediction
Professional traders don’t seek indicators that predict the future. They use them to identify and confirm high-probability scenarios based on the current market structure. The goal is not to be right 100% of the time but to build a system with a positive expectancy over many trades. By requiring a signal from both MACD and RSI, you are filtering out lower-quality setups and focusing only on those where the evidence is stacked in your favor.
Role of the MACD: Identifying Momentum
The MACD is more than just its two moving lines. For our strategies, its most potent component is the histogram, which acts as a powerful visual guide to the ebb and flow of market momentum. We use it to get an early warning of a change in power, and the crossover as our final confirmation.
Reading the MACD Histogram for Momentum
The MACD histogram visualizes the distance between the MACD line and the Signal line. When the histogram bars are getting taller, it means momentum in that direction is increasing. When they start to shrink, it’s a critical sign that momentum is waning. This is often a leading signal; the histogram can show slowing momentum before the price stalls or the MACD lines cross, giving you a valuable heads-up.
- In an uptrend: As price makes higher highs, we want to see the histogram also making higher peaks. If the price makes a new high, but the histogram peak is lower than the previous one, it’s a sign of weakening buying pressure.
- In a downtrend: As price makes lower lows, we expect the histogram to make lower troughs. If price makes a new low, but the histogram trough is shallower, it signals that selling momentum is drying up.
Using the MACD Crossover as Confirmation
The MACD crossover is one of the most classic trading signals, but a seasoned trader knows never to use it in isolation. It serves as our action trigger after another condition has been met.
- Bullish Crossover: When the MACD line (the faster line) crosses above the Signal line (the slower line), it provides confirmation that momentum has shifted to the upside. In our strategies, this will be the final trigger to enter a long position.
- Bearish Crossover: When the MACD line crosses below the Signal line, it confirms that momentum has turned to the downside. This will be our trigger to enter a short position.
Read More: What is RSI Indicator
Role of the RSI: Measuring Strength
The RSI is our primary tool for gauging the strength of a trend and, more importantly, identifying when that trend is potentially exhausted and ripe for a reversal. While many focus on simple overbought and oversold levels, its true power for our system lies in spotting divergence.
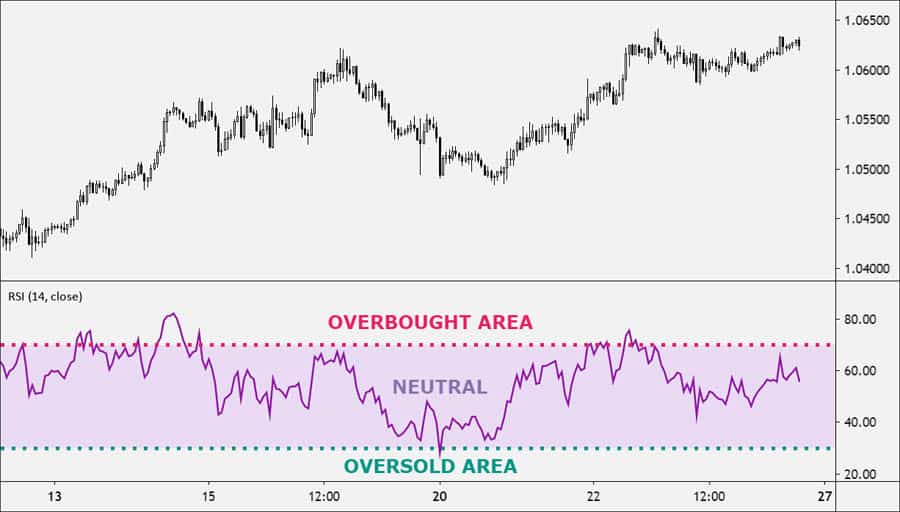
Identifying Overbought/Oversold Conditions
The traditional interpretation of RSI is that a reading above 70 indicates an “overbought” market, and a reading below 30 signals an “oversold” market. While this can be useful context, we don’t use these levels as direct entry signals. In a strong trend, an asset can stay overbought or oversold for a long time. Instead, we use these levels as “zones of interest.” When the RSI enters these territories, we start paying closer attention, looking for the other components of our strategy to align.
Spotting High-Probability RSI Divergence
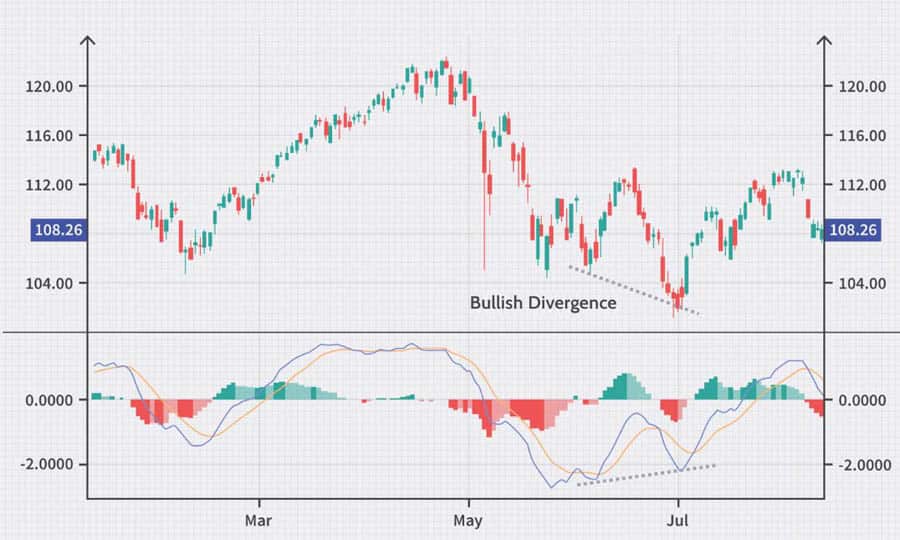
RSI divergence is one of the most reliable leading indicators of a potential trend change. It occurs when the indicator’s movement “diverges” from the movement of the price. This is a powerful sign of non-confirmation, suggesting the current trend is built on a weakening foundation.
- Bullish Divergence (A Potential Bottom): The price chart prints a new lower low (LL), but the RSI prints a higher low (HL). This tells us that despite the new low in price, the downward momentum is significantly weaker. The sellers are losing steam. This is our primary condition for the Reversal Trading strategy.
- Bearish Divergence (A Potential Top): The price chart prints a new higher high (HH), but the RSI prints a lower high (LH). This signals that even though the price pushed to a new high, the buying pressure behind the move is fading. The bulls are getting tired. This is the setup for a bearish reversal trade.
Mastering the identification of divergence is a crucial skill when learning how to use macd and rsi indicator for high-probability setups.
Read More: copy trading vs signals
Actionable MACD + RSI Trading Strategies
This is the heart of our system. We will now combine the signals from both indicators into two distinct, rule-based strategies. The key is strict adherence to the rules; no signal is acted upon without confirmation from its counterpart. This discipline is central to anyone serious about how to use macd and rsi indicator for consistent results.
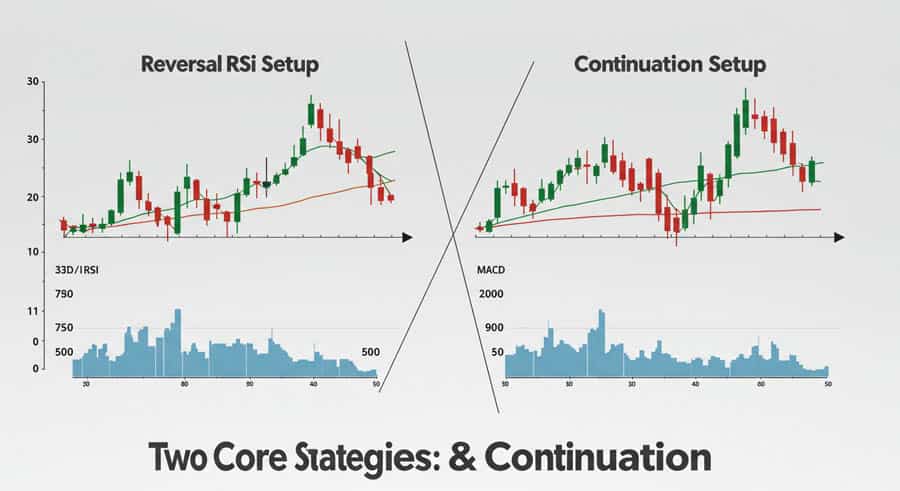
Strategy 1: High-Probability Reversal Trading
The core idea here is to catch a trend at its turning point. We use the RSI divergence as an early warning that the prevailing trend is exhausted and the MACD crossover as the final confirmation to enter the trade. This combination helps avoid the common mistake of trying to “catch a falling knife” or shorting a relentless uptrend too early.
Bullish Reversal Rules:
- Condition 1: Bullish Divergence. The market must be in a clear downtrend. Observe the price making a lower low (LL) while the RSI simultaneously makes a higher low (HL). This is our setup condition. It tells us to be on high alert for a potential bottom. Do not act yet.
- Condition 2: MACD Crossover Confirmation. After the bullish divergence is confirmed on the RSI, we wait patiently for the MACD line to cross above the Signal line. This crossover confirms that momentum has actually shifted from bearish to bullish. The shrinking MACD histogram leading up to the crossover often provides an early clue this is about to happen.
- Entry: Enter a long (buy) position at the open of the next candle after the MACD bullish crossover is confirmed and the candle has closed.
Bearish Reversal Rules:
- Condition 1: Bearish Divergence. The market must be in a clear uptrend. Watch for the price to make a higher high (HH) while the RSI makes a lower high (LH). This is the warning sign that the uptrend is running out of steam.
- Condition 2: MACD Crossover Confirmation. Following the bearish divergence on the RSI, we wait for the MACD line to cross below the Signal line. This is our evidence that momentum is now shifting to the downside.
- Entry: Enter a short (sell) position at the open of the next candle after the MACD bearish crossover is confirmed and the candle has closed.
This reversal strategy is a powerful way to implement your knowledge of how to use macd and rsi indicator.
Strategy 2: Advanced Trend Continuation
Not every trade has to be a reversal. Some of the most profitable opportunities come from joining a strong, established trend. This strategy uses the MACD to define the primary trend and the RSI to pinpoint low-risk entry points during pullbacks. This is the classic “buy the dip” or “sell the rally” approach, but with a systematic, indicator-based filter.
Uptrend Entry Rules (Buying Dips):
- Condition 1: Uptrend Confirmation. The MACD must be trading decisively above its zero line. The MACD line should also be above the Signal line. This establishes that the dominant market environment is bullish. We are only looking for buy opportunities.
- Condition 2: Low-Risk Pullback. We wait for the price to pull back, which will cause the RSI to drop. We are looking for the RSI to enter the 40-50 zone. An RSI dropping to this level indicates a healthy, temporary dip, not a full-blown reversal. It’s a sign of a pause, not a panic.
- Entry: When the price action shows a clear bullish candle (like a bullish engulfing or a hammer) in the pullback zone and the RSI starts to hook back up, crossing above the 50 line, it’s our signal to enter a long position.
Downtrend Entry Rules (Selling Rallies):
- Condition 1: Downtrend Confirmation. The MACD must be trading clearly below its zero line. This tells us the bears are in control. We are only interested in shorting opportunities.
- Condition 2: Low-Risk Rally. We watch for a corrective rally in price, which will cause the RSI to rise. Our target zone for the RSI is between 50 and 60. An RSI reaching this level in a downtrend signals a temporary bounce, providing a higher-value area to enter a short.
- Entry: When price action prints a bearish confirmation candle (like a bearish engulfing or shooting star) at the peak of the rally and the RSI begins to turn back down, crossing below the 50 line, it’s our trigger to enter a short position.
Using this trend continuation approach is another effective method that demonstrates how to use macd and rsi indicator to align with the market’s primary force.
The Pre-Trade Checklist: A Professional Approach
Amateur traders chase signals. Professionals execute a plan. Before risking a single dollar, you must run through a pre-flight checklist. This objective process removes emotion and ensures you are only taking A-grade setups that align with your strategy. Your answer to every question must be a confident “yes” before you proceed.
A. What is the higher timeframe trend? Is the daily chart trend aligned with the signal I see on my 4-hour chart? Trading in the direction of the larger trend dramatically increases your odds of success.
B. Is there a clear signal on my primary indicator? Do I have a textbook RSI divergence for a reversal, or a clean RSI pullback to the 40-50 zone for a trend continuation? If it’s ambiguous, it’s a “no.”
C. Is there a confirmation from my secondary indicator? Has the MACD crossed over to confirm my reversal signal? Is the MACD clearly above/below the zero line for my trend continuation trade? No confirmation means no trade.
D. Does price action confirm my entry? Is there a strong bullish or bearish candlestick pattern supporting my entry signal? Indicators can lag; price action is the ultimate truth.
E. Have I defined my invalidation point (stop-loss)? Do I know the exact price level at which my trade idea is proven wrong? If you don’t know where you’re wrong, you can’t trade.
Read More: wyckoff method
Non-Negotiable Rules: Risk & Trade Management
A profitable trading strategy is only one-third of the equation. The other two-thirds are rock-solid risk and trade management. You can have the best entry signals in the world and still lose money if you don’t manage your positions like a professional. This is a crucial, non-negotiable part of knowing how to use macd and rsi indicator.
Defining Your Invalidation Point (Stop-Loss Placement)
Your stop-loss is not just a random number; it is the price level that invalidates your trade idea. It should be placed at a logical point based on market structure.
- For Bullish Reversals/Dips: Place your stop-loss just below the recent swing low that formed the RSI divergence or the pullback.
- For Bearish Reversals/Rallies: Place your stop-loss just above the recent swing high that formed the divergence or the rally peak.
Placing it correctly gives your trade room to breathe without exposing you to catastrophic losses.
The 1% Rule and Position Sizing
This is the golden rule of capital preservation. Never risk more than 1% of your total trading capital on a single trade. This ensures that a string of losses—which is inevitable for any trader—will not wipe out your account. Your position size is calculated based on your entry price, your stop-loss price, and your 1% risk limit.
Position Size = (Total Capital * 1%) / (Entry Price - Stop-Loss Price)
This mathematical approach to sizing removes the guesswork and greed from your decisions.
Setting Realistic Profit Targets
Just as you need a plan to get in, you need a plan to get out with a profit. Don’t leave your exits to chance or emotion. Use objective levels on your chart.
- Support and Resistance: The most reliable targets are pre-defined horizontal support and resistance levels. For a long trade, your first target could be the next significant resistance level.
- Fibonacci Extensions: For trades that break into new highs or lows, Fibonacci extension levels (e.g., 1.272 or 1.618) can provide logical price targets.
- Risk/Reward Ratio: Always aim for trades where your potential profit (target) is at least 1.5 or 2 times your potential loss (stop-loss). If a setup doesn’t offer a favorable risk/reward ratio, skip it.
Common Mistakes to Avoid
Understanding how to use macd and rsi indicator also means knowing when not to use them. Avoiding these common pitfalls will save you from countless frustrating losses and preserve your capital for high-quality opportunities.
Mistake 1: Trading in a Choppy, Sideways Market
The MACD and RSI are trend and momentum indicators. They are designed to work in markets that are moving. In a tight, choppy, or sideways range, they will generate a constant stream of false signals. The MACD will whipsaw back and forth across its signal line, and the RSI will hover around the 50 level, providing no clear direction. If you cannot identify a clear uptrend or downtrend on your chart, the best trade is often no trade at all.
Mistake 2: Ignoring the Higher Timeframe Context
A perfect bullish reversal signal on the 1-hour chart is far less likely to succeed if the daily and weekly charts are in a powerful, waterfall-style downtrend. The higher timeframe acts like a strong current; it’s much easier to swim with it than against it. Always perform a top-down analysis, starting with the daily chart to establish the primary trend before looking for entries on your preferred trading timeframe (e.g., 4-hour or 1-hour).
Mistake 3: Acting on an RSI Signal Without MACD Confirmation
This is the most common and costly mistake many traders make. A trader sees a beautiful RSI divergence and jumps into a reversal trade, only to watch the price continue to steamroll in the original direction. The divergence is a warning, not an entry trigger. It tells you that a trend is weakening, but it doesn’t tell you when it will turn. You must wait for the MACD crossover to confirm that momentum has truly shifted. This patience is what separates disciplined traders from impulsive gamblers. Learning how to use macd and rsi indicator is an exercise in discipline.
Opofinance Services
To effectively implement the strategies discussed, your choice of broker is critical. Opofinance, an ASIC-regulated broker, provides the tools and environment necessary for serious traders. They offer a robust platform to master how to use macd and rsi indicator.
- Advanced Trading Platforms: Choose from the industry-leading platforms your strategy demands, including MT4, MT5, cTrader, and the user-friendly OpoTrade app.
- Innovative AI Tools: Gain a competitive edge with proprietary AI-driven tools. Utilize the AI Market Analyzer for insights, get personalized feedback from the AI Coach, and receive instant help from AI Support.
- Social & Prop Trading: Explore diverse trading avenues with integrated Social Trading to follow experienced traders and a Prop Trading program to trade with the firm’s capital.
- Secure & Flexible Transactions: Experience peace of mind with safe and convenient deposit and withdrawal methods. Opofinance supports traditional payments as well as modern crypto payments, ensuring your funds are accessible.
- Zero Fees on Transactions: Maximize your returns with zero fees charged by Opofinance on all deposits and withdrawals.

Explore Opofinance’s advanced trading tools today!
Conclusion: From Knowledge to Skill
Ultimately, this article has provided a comprehensive blueprint on how to use macd and rsi indicator as a complete system. We’ve moved beyond basic definitions to build two robust, rule-based strategies for both reversal and continuation scenarios, reinforced by a professional checklist and strict risk management protocols. The key is the synergy between RSI’s strength reading and MACD’s momentum confirmation. However, reading about a strategy is not enough. True mastery comes from practice. Your next step is to take this knowledge, apply it to historical charts through backtesting, and then practice in a demo account. This is the path from knowledge to genuine trading skill, turning signals on a screen into a confident, disciplined approach to the markets.
What are the best settings for MACD and RSI in these strategies?
For consistency and reliability, it’s best to stick with the standard default settings: MACD (12, 26, 9) and RSI (14 period). These are the most widely used settings, meaning more traders are reacting to the same levels, which can increase their significance.
Can I use this MACD and RSI strategy on any timeframe?
Yes, the principles of this strategy can be applied to any timeframe, from 5-minute charts for scalping to daily charts for swing trading. The key is consistency; if you identify a setup on a 1-hour chart, your risk management and profit targets should be based on that same timeframe’s market structure.
Which is more important in this system, the RSI or the MACD?
Think of them as a team with different roles. The RSI is the “scout” that identifies the potential opportunity (divergence or pullback). The MACD is the “general” that gives the final command to act (the crossover). Both are essential; the setup is invalid without a signal from each.
How does high market volatility affect these signals?
High volatility can make signals more pronounced but can also lead to wider price swings that might stop you out prematurely. During extreme volatility (like a major news release), it’s often wise to be cautious, as indicators can whipsaw. Adhering strictly to your stop-loss rules is even more critical in these conditions.
What is the single biggest challenge when first learning this strategy?
The biggest challenge for most traders is patience. It’s having the discipline to wait for all conditions of the strategy to be met before entering a trade. This means watching a potential setup form and resisting the urge to jump in before the MACD provides its final confirmation.


