

The Inner Circle Trader (ICT) market structure shift has become a game-changer in the forex trading landscape. This revolutionary approach to analyzing currency pair dynamics has caught the attention of traders worldwide, promising enhanced profitability and a deeper understanding of price movements. As regulated forex brokers adapt to this shift, traders are discovering new ways to capitalize on market inefficiencies and improve their trading outcomes in the foreign exchange market. The ICT market structure shift focuses on identifying key levels of supply and demand, institutional order flow, and market manipulation tactics in currency pairs. By incorporating these concepts into their forex trading strategies, traders can gain a significant edge in the highly competitive world of currency exchange. In this article, we’ll explore the intricacies of the ICT market structure shift and how it’s reshaping the forex trading industry.

Understanding the ICT Market Structure Shift
What is ICT Market Structure Shift?
The ICT market structure shift (MSS) is a crucial concept in forex trading that signals a potential reversal in a currency pair’s trend. As the term “shift” suggests, it indicates a change in the market’s direction, either from bullish to bearish or vice versa. The ICT market structure shift is an initial signal that the forex market is changing its trend, which can be either a short-term or long-term change in market structure.
Key Components of ICT Market Structure
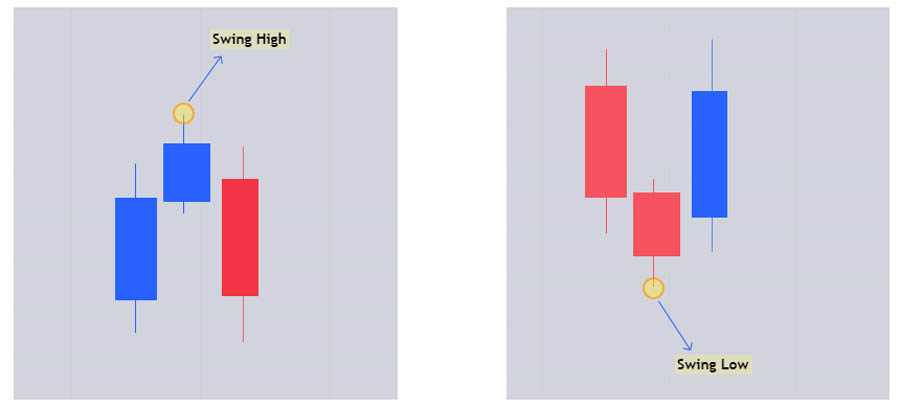
- Swing Highs: A three-candle formation where the high of the middle candle is higher than the highs of the candles on either side.
- Swing Lows: A three-candle formation where the low of the middle candle is lower than the lows of the candles on either side.
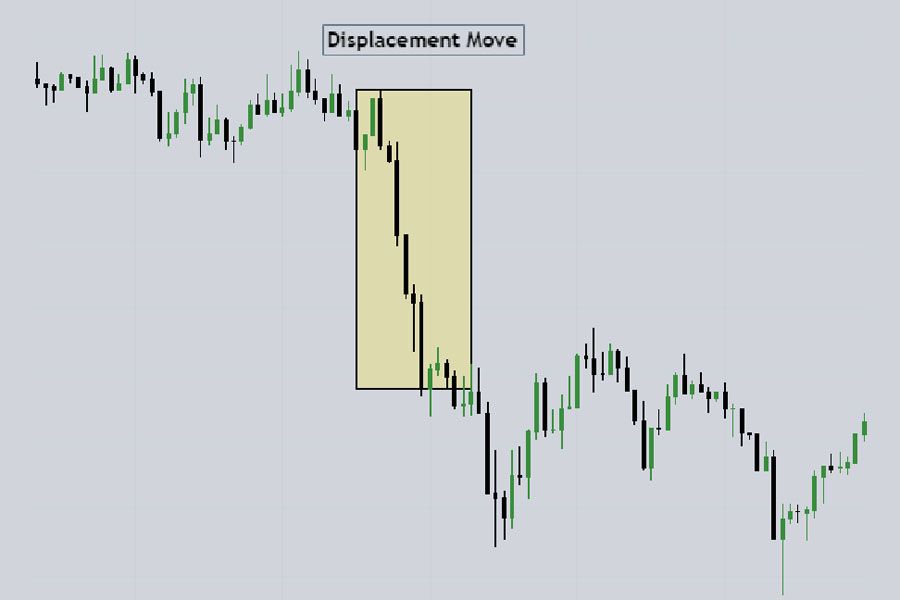
- Displacement Move: A powerful move in one direction, characterized by candles with large real bodies and short wicks, often accompanied by fair value gaps (FVGs).
The Basis of ICT Market Structure Shift
The foundation of the ICT market structure shift lies in understanding swing highs, swing lows, and displacement moves. These concepts are essential for identifying potential trend reversals in forex pairs.
How to Identify ICT Market Structure Shift in Forex Trading
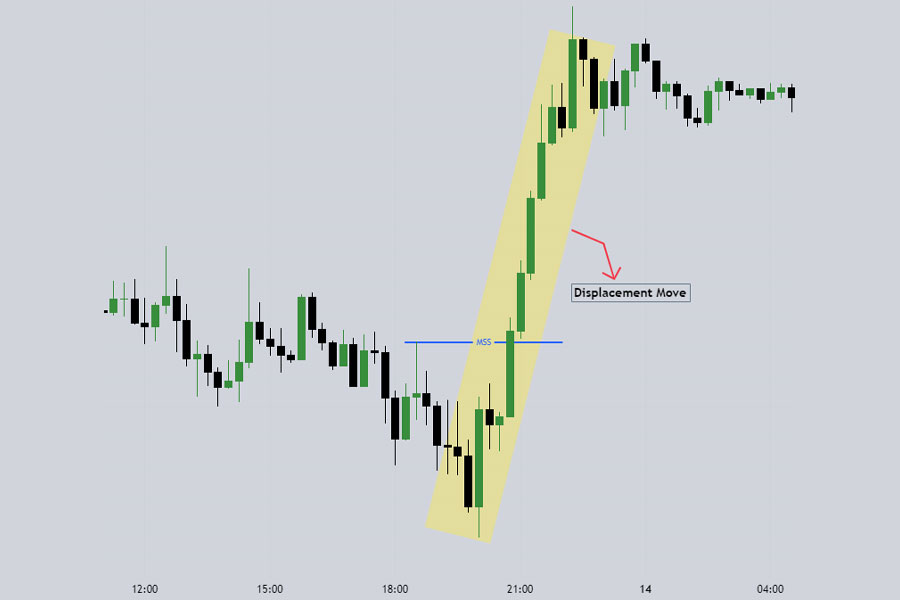
Bullish Market Structure Shift
A bullish market structure shift occurs when the forex market structure shifts from bearish to bullish. In a bearish market, price moves down, making lower swing highs. A bullish shift is identified when the price moves up with displacement and breaks the lower high (which has already taken a previous low).
Read More: Mastering ICT Market Structure
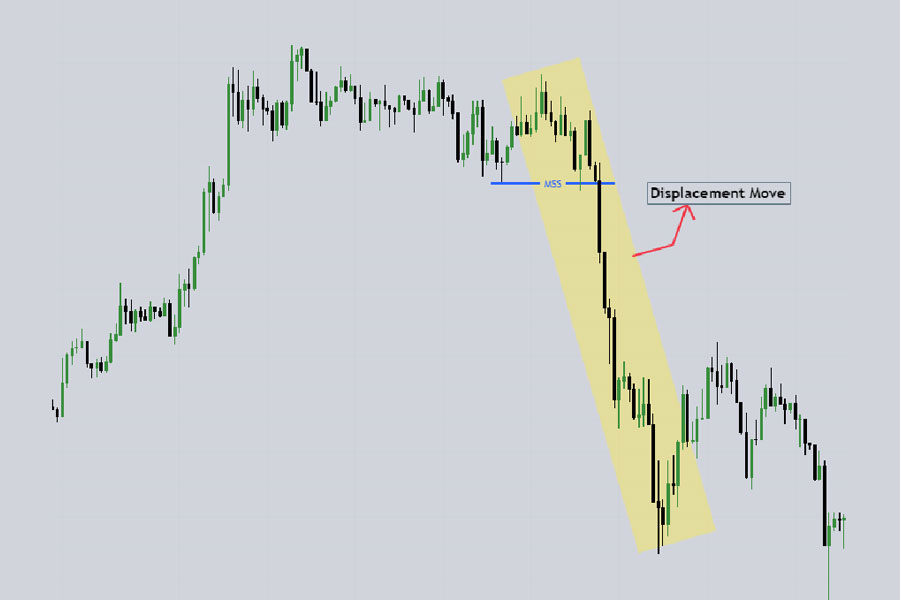
Bearish Market Structure Shift
Conversely, a bearish market structure shift happens when the forex market structure shifts from bullish to bearish. In a bullish market, price moves up, making higher swing lows. A bearish shift is identified when the price moves down with displacement and breaks the higher low (which has already taken a previous high).
Trading the ICT Market Structure Shift in Forex
Understanding how to trade the ICT Market Structure Shift is crucial for forex traders looking to capitalize on significant trend changes. Here’s a detailed breakdown of how to approach both bullish and bearish shifts:
Identifying the Shift
Before entering any trades, it’s essential to accurately identify the market structure shift:
- Monitor Higher Timeframes: Start by analyzing daily and weekly charts to identify the overall trend.
- Look for Displacement: Watch for powerful moves that break previous swing highs or lows.
- Confirm with Lower Timeframes: Use 4-hour and 1-hour charts to confirm the shift and fine-tune entry points.
Trading a Bullish Market Shift
When the forex market shifts from bearish to bullish, follow these steps:
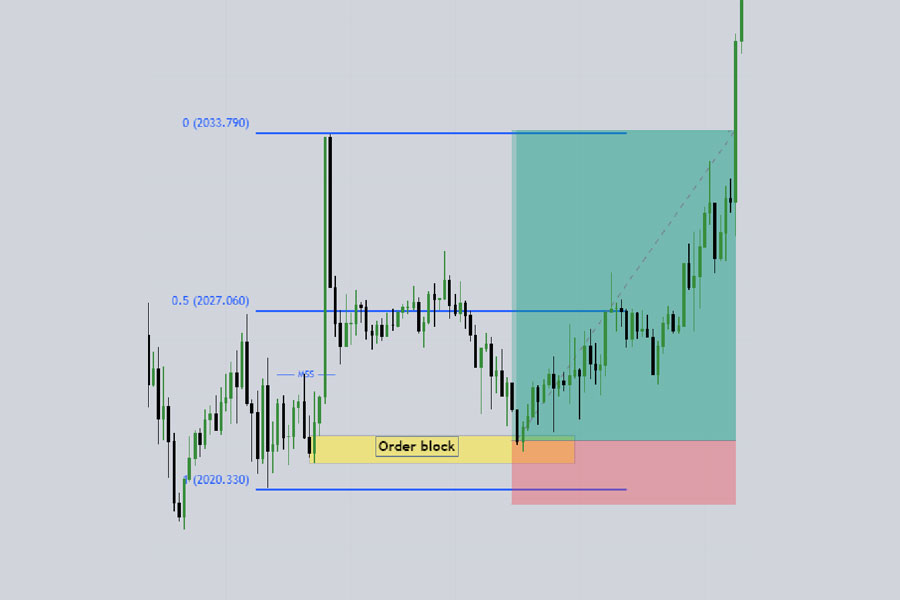
- Identify the Displacement Move: Look for a strong upward move that breaks a previous lower high.
- Draw Fibonacci Retracement:
- Use the Fibonacci tool from the low to the high of the displacement move.
- Pay special attention to the 50% retracement level.
- Mark Key Levels:
- Below the 50% retracement, identify any fair value gaps (FVGs), order blocks, or breaker blocks.
- These areas often act as support in the new bullish trend.
- Wait for Retracement:
- Allow the price to retrace to the identified support levels.
- Look for bullish candlestick patterns or price action signals at these levels.
- Enter the Trade:
- When the price reacts at the support level, enter a buy trade.
- Use a limit order to get a better entry price, or a market order if the move is aggressive.
- Set Stop Loss:
- Place your stop loss 10-20 pips below the low of the displacement move.
- Alternatively, set it below the nearest swing low or support level.
- Define Take Profit:
- Target a minimum 1:2 risk-reward ratio.
- Consider using previous highs as potential take profit levels.
- For longer-term trades, use trailing stops to capture extended moves.
Trading a Bearish Market Shift
When the market shifts from bullish to bearish, the approach is similar but inverted:
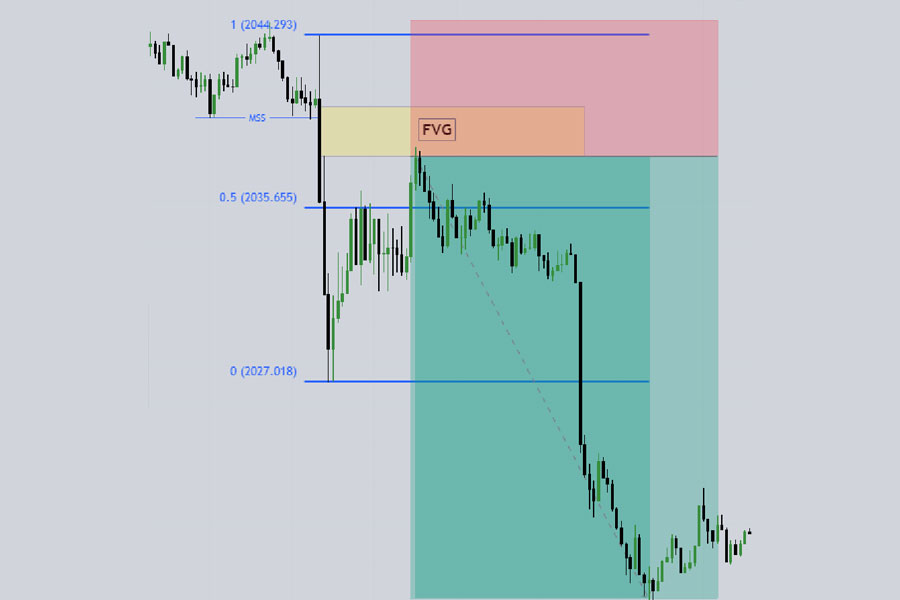
- Identify the Bearish Displacement: Look for a strong downward move breaking a previous higher low.
- Apply Fibonacci Retracement:
- Draw from the high to the low of the bearish displacement move.
- Focus on the 50% retracement level.
- Mark Resistance Levels:
- Above the 50% retracement, identify FVGs, order blocks, or breaker blocks.
- These areas often act as resistance in the new bearish trend.
- Wait for Pullback:
- Allow the price to rally to the identified resistance levels.
- Look for bearish candlestick patterns or price action signals at these levels.
- Enter the Trade:
- When the price reacts at the resistance level, enter a sell trade.
- Use a limit order for a better entry, or a market order for aggressive moves.
- Set Stop Loss:
- Place your stop loss 10-20 pips above the high of the displacement move.
- Alternatively, set it above the nearest swing high or resistance level.
- Define Take Profit:
- Aim for a minimum 1:2 risk-reward ratio.
- Use previous lows as potential take profit targets.
- Consider trailing stops for capturing larger downward moves.
Understanding Key ICT Concepts in Forex Trading
Market Structure Shift vs. Break of Structure
In forex trading, it’s crucial to distinguish between a market structure shift and a break of structure:
Break of Structure (BOS): This occurs when the price of a currency pair moves beyond a defined support or resistance level. However, a break of structure doesn’t necessarily indicate a trend reversal. It can be a temporary move or a continuation of the existing trend.
Market Structure Shift (MSS): This is a more significant move that suggests a new trend is beginning in the forex market. A market structure shift is usually represented by an aggressive move above or below an old structure level where a signal for a price reversal is given. It’s often confirmed by a series of breaks in structure and indicates a potential long-term change in the currency pair’s direction.
Market Structure Shift vs. Liquidity Grab
Understanding the difference between these two concepts is vital for forex traders:
Market Structure Shift (MSS):
- Occurs when price breaks past a swing high or low with a full-bodied candlestick
- Signals a potential change in the market’s direction
- Indicates the beginning of a new trend in the currency pair
- Often followed by the establishment of new highs or lows
Liquidity Grab:
- A quick move past a previous swing high or low, usually with just a wick on the candlestick
- Doesn’t indicate a trend reversal, but rather a temporary move
- Often seen around areas like double tops and double bottoms in forex charts
- Typically followed by a return to the previous range or trend
- Designed to “shake out” weak hands before continuing the established trend
Key Differences and Trading Implications
- Duration and Impact: An MSS suggests a longer-term change in the forex market, while a liquidity grab is a short-lived movement.
- Candlestick Appearance: MSS often involves full-bodied candlesticks, while liquidity grabs are characterized by long wicks.
- Aftermath: After an MSS, new highs or lows are often established. In contrast, a liquidity grab is usually followed by a return to the previous trend.
- Trading Opportunities:
- Liquidity grabs might offer quick in-and-out trades for agile forex traders.
- Market structure shifts could signal a time to reevaluate positions and consider longer-term trades in the currency pair.
- Confirmation: An MSS is often confirmed by subsequent price action, while a liquidity grab is typically a standalone event.
Understanding these distinctions is crucial for forex traders employing ICT strategies. It allows for more accurate interpretation of price action and can significantly influence trading decisions in the foreign exchange market.
Read More: Mastering ICT Draw On Liquidity
Advanced ICT Market Structure Concepts in Forex

Smart Money Concepts (SMC)
SMC is closely related to ICT market structure and focuses on understanding the intentions of large institutional forex traders. Key concepts include:
- Institutional order flow in currency pairs
- Liquidity grabs in major and minor forex pairs
- Stop hunts in popular currency crosses
- Accumulation and distribution phases in forex markets
Wyckoff Method Integration
The Wyckoff Method, when applied to forex trading, shares many similarities with ICT market structure. Integrating these approaches can provide a more comprehensive understanding of currency pair dynamics.
Order Flow Analysis in Forex
Incorporating order flow analysis into your ICT-based forex strategy can provide additional insights into market sentiment and potential price movements in currency pairs.
Challenges and Limitations of ICT Market Structure in Forex Trading
Subjectivity in Analysis
Identifying ICT structural elements in forex charts can be subjective, leading to potential differences in interpretation among currency traders.
Overcomplication
Some forex traders may become overly focused on complex structural analysis, losing sight of broader currency market trends and fundamental factors affecting exchange rates.
Backtesting Difficulties
Due to the subjective nature of ICT analysis, backtesting forex strategies based on this approach can be challenging.
OpoFinance Services: Empowering Forex Traders with Advanced Tools
OpoFinance, an ASIC-regulated forex broker, is at the forefront of providing traders with the tools and resources needed to succeed in the evolving foreign exchange market. Their commitment to innovation and customer success aligns perfectly with the principles of ICT market structure analysis in forex trading.

OpoFinance offers a robust trading platform that supports advanced charting and analysis tools, making it easier for forex traders to implement ICT-based strategies on various currency pairs. Their competitive spreads and fast execution speeds ensure that traders can take advantage of the precise entry and exit points identified through ICT analysis in the forex market.
One of OpoFinance’s standout features is their social trading service, which allows forex traders to connect with and learn from experienced professionals who may be using ICT market structure concepts in their currency trading. This collaborative environment can accelerate the learning curve for traders new to ICT analysis and provide valuable insights into real-world application of these strategies in forex trading.
With a strong focus on education and customer support, OpoFinance is an excellent choice for forex traders looking to explore and implement ICT market structure strategies in their foreign exchange trading journey.
Read More: Master The ICT Market Structure Break (MSB)
Conclusion
The ICT market structure shift represents a significant evolution in forex trading analysis and strategy development. By focusing on the actions of institutional players and key structural elements in currency pairs, traders can gain a deeper understanding of forex market dynamics and potentially improve their trading outcomes.
While implementing ICT concepts requires dedication and practice, the potential benefits in terms of enhanced price action analysis, improved risk management, and more precise trade entries and exits make it a valuable approach for serious forex traders.
As the foreign exchange market continues to evolve, staying informed about approaches like ICT market structure can help traders maintain a competitive edge. By combining these concepts with sound risk management principles and continuous learning, forex traders can position themselves for long-term success in the dynamic world of currency trading.
How does ICT market structure differ from traditional technical analysis in forex trading?
ICT market structure focuses on identifying key levels of institutional interest and order flow in currency pairs, rather than relying primarily on indicators and chart patterns. It emphasizes understanding the behavior of “smart money” and how it influences forex price movements. Traditional technical analysis often uses lagging indicators, while ICT analysis aims to anticipate future price action based on structural elements like order blocks and liquidity pools in the foreign exchange market.
Can ICT market structure be applied to all currency pairs and timeframes?
Yes, ICT market structure concepts can be applied to all currency pairs and timeframes in forex trading. However, many ICT traders prefer to focus on higher timeframes (4H, Daily, Weekly) for major currency pairs, as these often show clearer structural elements and are more likely to reflect institutional trading activity. Lower timeframes can still be useful for fine-tuning entries and exits once the overall structure has been identified on higher timeframes in the forex market.
How long does it typically take to become proficient in ICT market structure analysis for forex trading?
The time it takes to become proficient in ICT market structure analysis for forex trading varies depending on the individual trader’s background, dedication, and learning pace. Generally, it can take several months to a year of consistent study and practice to develop a solid understanding of ICT concepts and apply them effectively in real forex trading situations. Continuous learning and refinement of skills are essential, as currency market dynamics can change over time.


