

Identifying imbalance in forex is a crucial skill for traders looking to gain an edge in the highly competitive foreign exchange market. Forex imbalance occurs when there’s a significant disparity between buying and selling pressure, often leading to sharp price movements. Learning how to identify imbalance in forex can help traders anticipate potential market reversals and capitalize on lucrative trading opportunities. For better trading outcomes, working with a regulated forex broker can ensure a secure and reliable trading environment. This comprehensive guide will explore the concept of forex imbalance, its importance, and provide practical strategies to spot these market inefficiencies effectively.

Understanding Forex Imbalance
Forex imbalance refers to a situation where there’s a significant discrepancy between supply and demand for a particular currency pair. This imbalance can manifest in various forms, such as:
- Order flow imbalance
- Liquidity imbalance
- Price action imbalance
- Market sentiment imbalance
When traders learn how to find imbalance in forex, they gain a valuable tool for predicting potential price reversals and identifying high-probability trade setups.
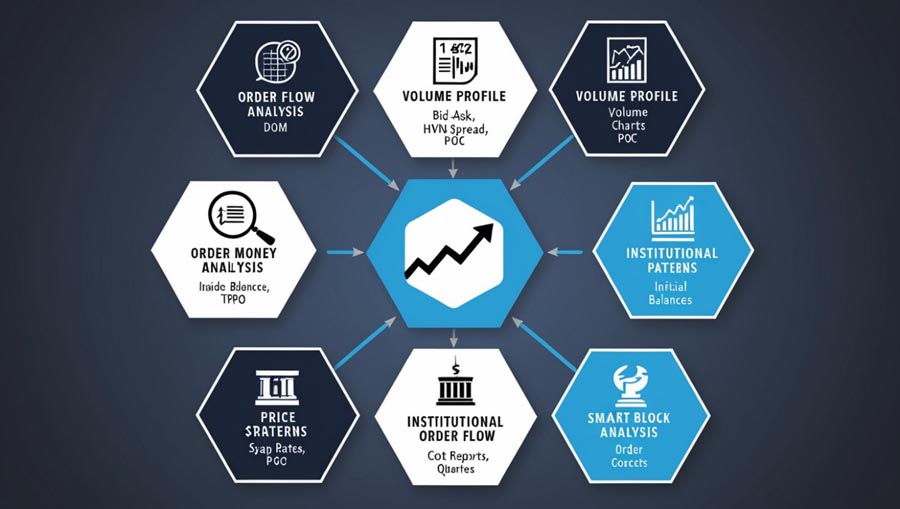
7 Proven Strategies to Identify Imbalance in Forex
Read More: Identify liquidity in forex
1. Analyze Order Flow
One of the most effective ways to identify imbalance in forex is by analyzing order flow. Order flow analysis involves studying the buying and selling pressure in the market by examining the depth of market (DOM) or order book.
Key steps to analyze order flow:
- Monitor large limit orders
- Observe the bid-ask spread
- Track sudden changes in volume
By focusing on these aspects, traders can gain insights into potential imbalances and make informed trading decisions.
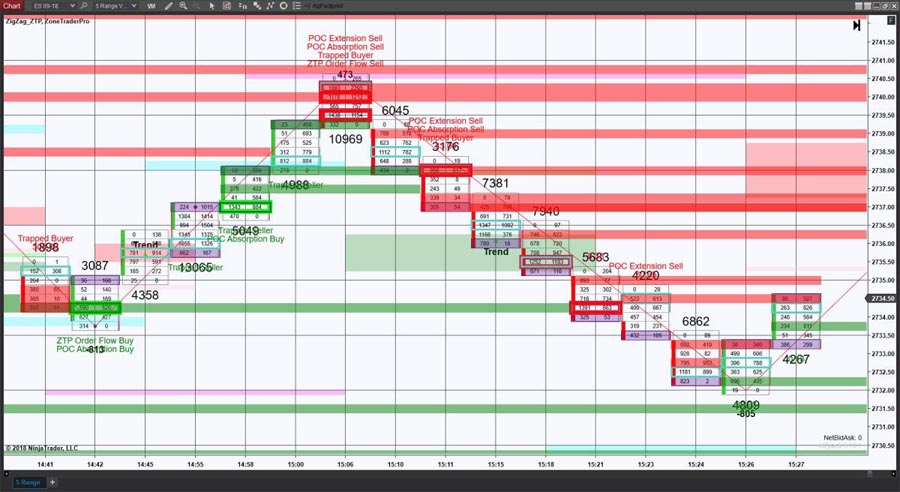
Advanced Order Flow Analysis Techniques
To further enhance your order flow analysis, consider incorporating these advanced techniques:
a) Cumulative Delta: This metric measures the net buying or selling pressure over time by calculating the difference between market buy and sell orders. A significant imbalance in cumulative delta can signal potential price reversals.
b) Footprint Charts: These charts combine price and volume data, allowing traders to visualize buying and selling pressure at each price level. Areas of high volume imbalance on footprint charts can indicate potential support or resistance levels.
c) Time and Sales Data: By closely monitoring time and sales data, traders can identify large block trades or unusual order patterns that may signal institutional activity and potential imbalances.
Read More: Identify Order Blocks in Forex
2. Utilize Volume Profile
The volume profile is a powerful tool for identifying areas of imbalance in the forex market. This indicator displays the trading volume at different price levels, helping traders spot potential support and resistance zones.
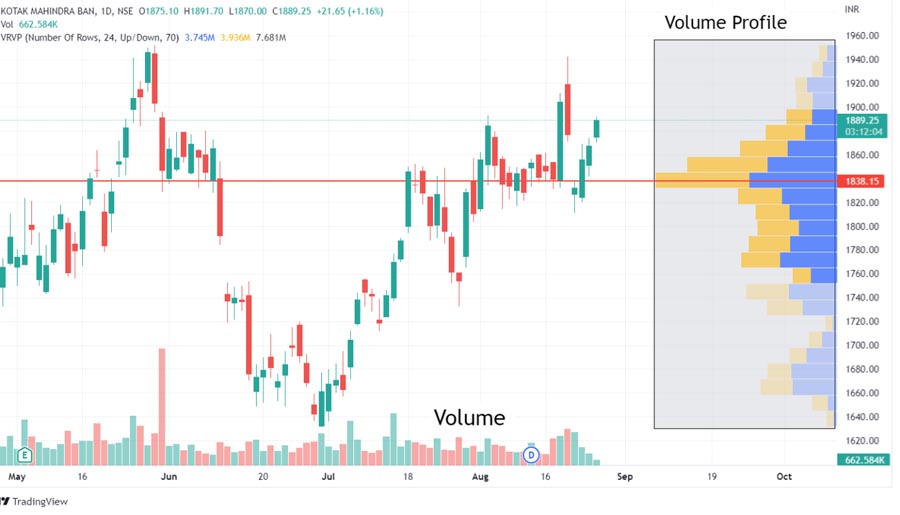
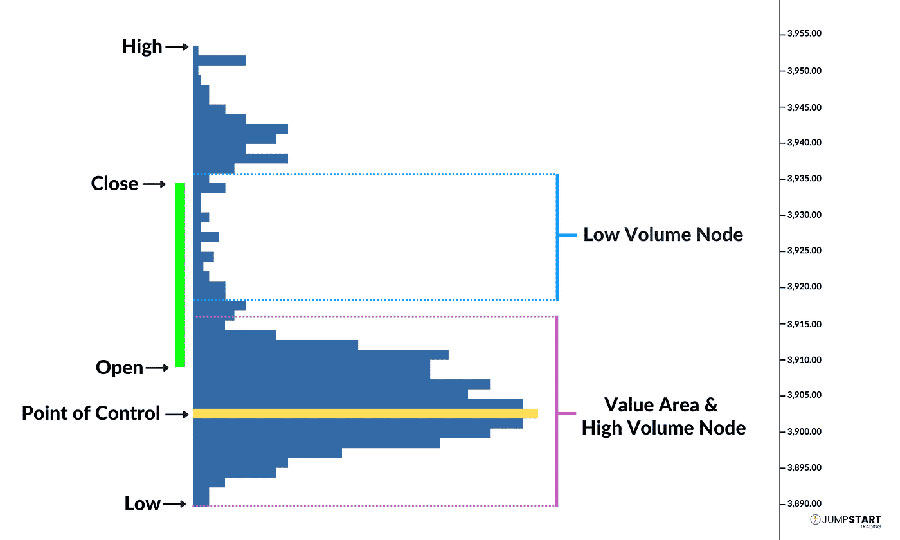
How to use volume profile:
- Look for high-volume nodes (HVNs)
- Identify low-volume nodes (LVNs)
- Analyze the point of control (POC)
Areas with significant volume imbalances often act as key levels where price may reverse or consolidate.
Interpreting Volume Profile Structures
Understanding different volume profile structures can provide additional insights into market imbalances:
a) Bell Curve: A symmetrical distribution of volume indicates a balanced market. Significant deviations from this shape may signal potential imbalances.
b) Double Distribution: This structure shows two distinct areas of high volume, often indicating a transitional market phase and potential imbalances between the two value areas.
c) Flat Profile: A relatively even distribution of volume across a wide price range may indicate uncertainty and potential for future imbalances.
d) Narrow Profile: A concentrated volume distribution in a small price range could suggest a tightly coiled market, prone to explosive moves when imbalances occur.
3. Implement Market Profile Analysis
Market profile analysis is another effective technique for identifying imbalance in forex. This method organizes price and time data into a graphical format, revealing valuable information about market structure and potential areas of imbalance.
Key components of market profile analysis:
- Value area
- Initial balance
- Profile shape (balanced vs. imbalanced)
By studying these elements, traders can identify potential imbalances and anticipate future price movements.
Read More: Identifying Support and Resistance in Forex
Advanced Market Profile Concepts
To deepen your understanding of market imbalances using market profile, consider these advanced concepts:
a) Balance Areas: Extended periods of price consolidation within a specific range. Breakouts from these areas often indicate significant imbalances and potential trend changes.
b) Single Print Areas: These are price levels with minimal trading activity, often representing areas of quick price rejection. They can signal potential imbalances and future support/resistance levels.
c) Poor High/Low: When the market fails to continue in the direction of the initial balance extension, it creates a poor high or low. These structures often indicate potential imbalances and reversal opportunities.
d) Value Area Divergence: When price moves away from the value area but fails to attract new business, it can signal a potential imbalance and impending price reversal.
4. Leverage Price Action Patterns
Price action patterns can provide valuable clues about potential imbalances in the forex market. Certain candlestick formations and chart patterns often indicate shifts in supply and demand dynamics.
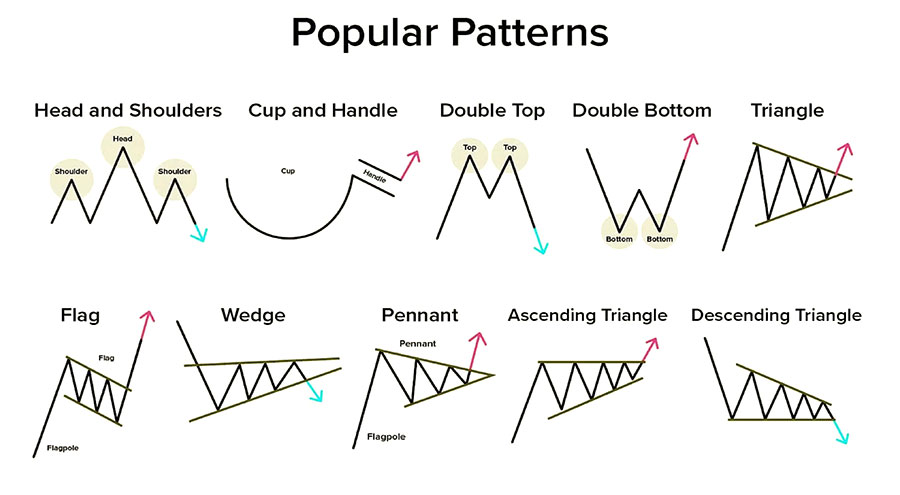
Notable price action patterns to watch:
- Engulfing patterns
- Pin bars
- Inside bars
- Wedges and triangles
These patterns can signal impending price reversals or breakouts, highlighting areas of potential imbalance.
Advanced Price Action Analysis for Imbalance Detection
To refine your ability to spot imbalances using price action, consider these advanced techniques:
a) Multiple Time Frame Analysis: Compare price action patterns across different time frames to identify confluences and potential imbalances with higher probability.
b) Fibonacci Retracements and Extensions: Use these tools in conjunction with price action patterns to identify potential areas of imbalance and price reversal.
c) Harmonic Patterns: Complex patterns like Gartley, Butterfly, and Crab can provide insights into potential market imbalances and reversal points.
d) Volume-Confirmed Patterns: Pay special attention to price action patterns that are accompanied by significant changes in volume, as these often signal stronger imbalances.
5. Monitor Institutional Order Flow
Institutional traders often move large sums of money, creating significant imbalances in the forex market. By monitoring institutional order flow, retail traders can gain insights into potential market-moving events.
Ways to track institutional order flow:
- Follow commitment of traders (COT) reports
- Analyze swap rates and carry trade activity
- Monitor news and economic events
Understanding institutional positioning can help traders identify potential imbalances and align their strategies accordingly.
Interpreting Institutional Activity
To gain deeper insights into institutional order flow and potential imbalances:
a) Futures Positioning: Analyze the COT report to understand how large speculators and commercial traders are positioned in currency futures markets.
b) Options Market Activity: Monitor changes in options market implied volatility and put-call ratios to gauge institutional sentiment and potential imbalances.
c) Intermarket Analysis: Study correlations between forex and other markets (e.g., equities, bonds) to identify potential institutional capital flows and resulting imbalances.
d) Dark Pool Activity: While challenging for retail traders to access, any available information on dark pool trading can provide valuable insights into institutional order flow and potential imbalances.
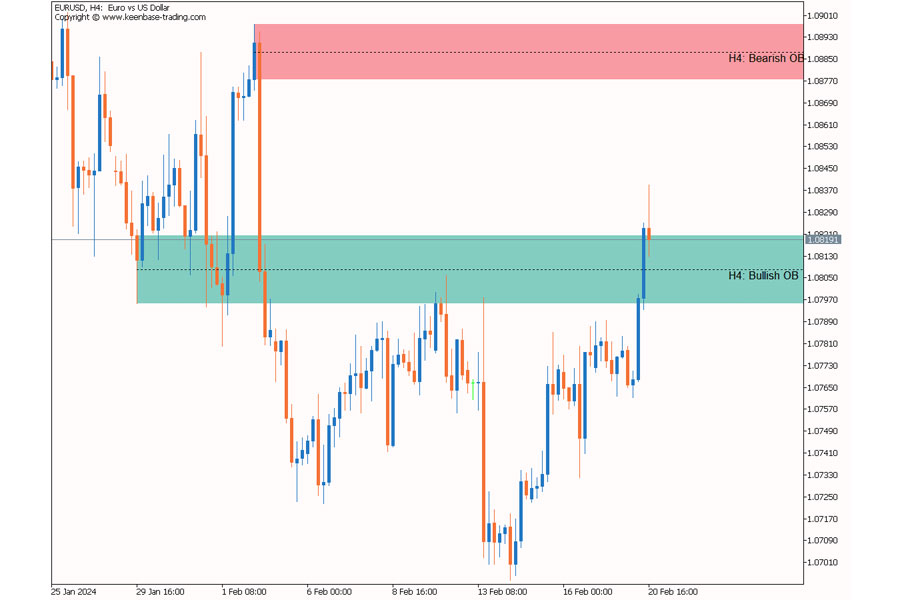
6. Employ Order Block Analysis
Order blocks are areas on a chart where significant buying or selling pressure has occurred, often leading to sharp price movements. These zones can indicate potential imbalances in the market.
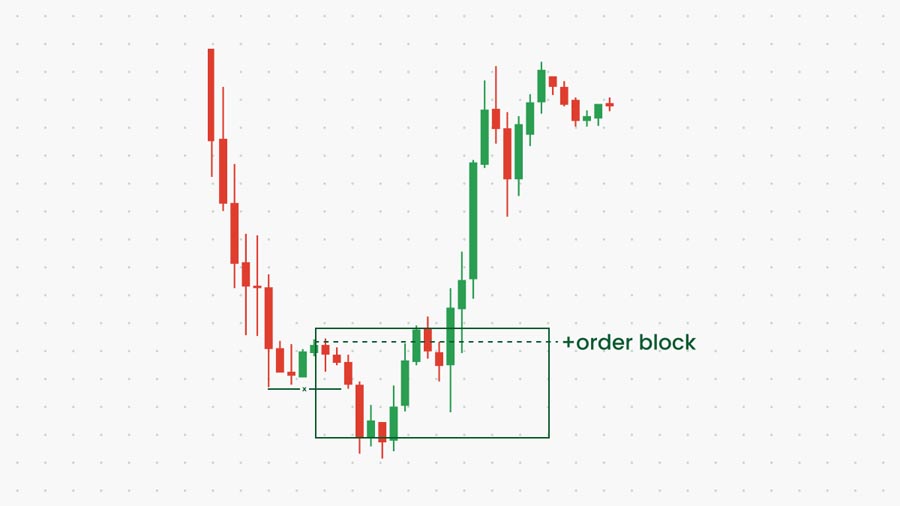
Steps to identify order blocks:
- Look for strong impulse moves
- Identify the origin of these moves
- Mark the last candle before the impulse
Order blocks often act as support or resistance levels and can be used to anticipate future price reactions.
Refining Order Block Analysis
To enhance your order block analysis and better identify imbalances:
a) Fair Value Gaps (FVG): Look for significant gaps between candle bodies that occur during strong moves. These gaps often represent areas of imbalance that price may return to fill.
b) Liquidity Voids: Identify areas on the chart with minimal trading activity between two price levels. These voids can represent potential imbalances and areas for sharp price movements.
c) Breaker Blocks: When price breaks through a significant order block and then returns to retest it, the original order block may now act as the opposite type of support/resistance. This concept can help identify potential imbalances and trade opportunities.
d) Time-Based Order Blocks: Consider the time of day when order blocks form, as certain periods (e.g., London or New York session opens) may create more significant imbalances.
7. Utilize Smart Money Concepts
Smart money concepts focus on understanding how institutional traders and large market participants operate. By aligning with these “smart money” moves, retail traders can identify potential imbalances and high-probability trade setups.
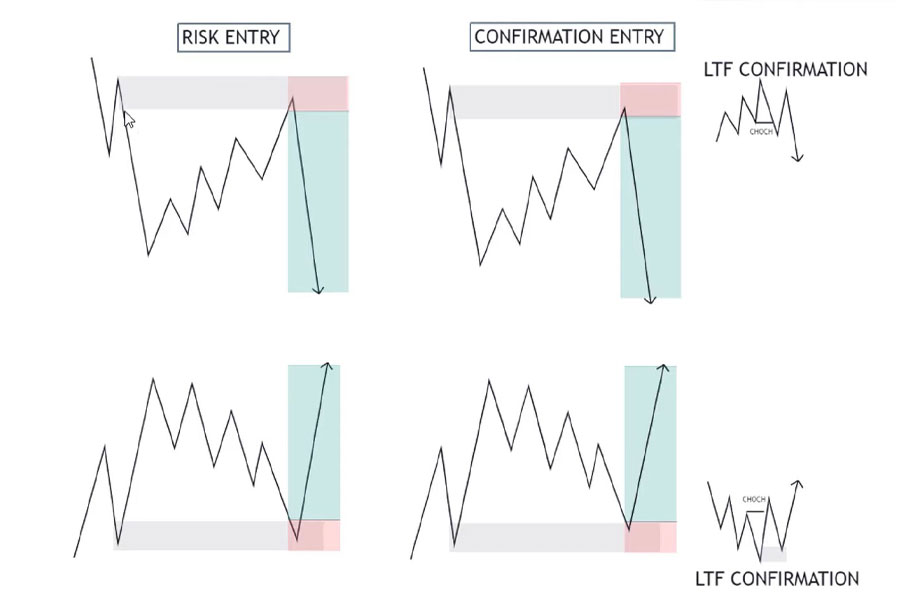
Key smart money concepts to consider:
- Liquidity grabs
- Stop hunts
- Accumulation and distribution phases
Mastering these concepts can help traders spot imbalances and make more informed trading decisions.
Advanced Smart Money Techniques
To further refine your ability to identify imbalances using smart money concepts:
a) Wyckoff Method: Study the Wyckoff method to understand market cycles and identify accumulation and distribution phases, which often precede significant imbalances.
b) Order Flow Imbalance (OFI): Analyze the difference between aggressive buying and selling to identify potential smart money activity and resulting imbalances.
c) Volume Spread Analysis (VSA): Use VSA principles to interpret the relationship between price, volume, and spread, providing insights into potential smart money operations and market imbalances.
d) Market Maker Methods: Study techniques believed to be used by market makers, such as stop runs and liquidity hunts, to anticipate potential imbalances and price reversals.
The Importance of Identifying Imbalance in Forex
Understanding and identifying imbalance in forex is crucial for several reasons:
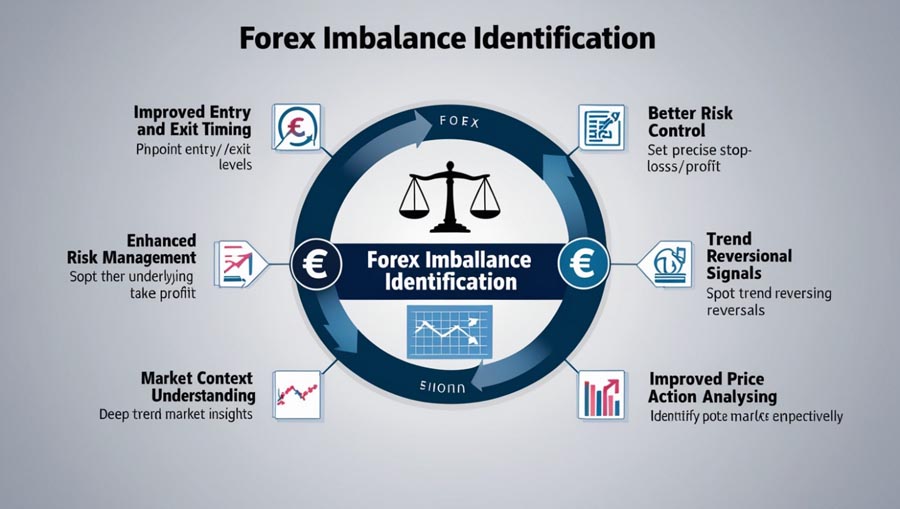
- Improved Entry and Exit Points: Recognizing imbalances helps traders pinpoint optimal entry and exit levels, potentially increasing profitability.
- Risk Management: Imbalance identification aids in setting appropriate stop-loss and take-profit levels, enhancing overall risk management.
- Market Context: Imbalances provide valuable context about market sentiment and potential future price movements.
- Trend Reversal Signals: Significant imbalances often precede trend reversals, offering traders opportunities to catch the beginning of new trends.
- Enhanced Price Action Understanding: Studying imbalances deepens traders’ understanding of price action and market dynamics.
By mastering the art of identifying imbalance in forex, traders can develop a more comprehensive and effective trading approach.
Practical Tips for Implementing Imbalance Trading Strategies

To effectively incorporate imbalance identification into your forex trading strategy, consider the following tips:
- Combine Multiple Approaches: Use a combination of the strategies mentioned above to confirm potential imbalances.
- Practice on Demo Accounts: Hone your skills in identifying imbalances using demo accounts before risking real capital.
- Keep a Trading Journal: Document your observations and trades to refine your ability to spot imbalances over time.
- Stay Informed: Keep up with market news and economic events that may create imbalances in the forex market.
- Use Multiple Timeframes: Analyze imbalances across different timeframes to gain a more comprehensive market view.
- Be Patient: Wait for clear confirmation of imbalances before entering trades to avoid false signals.
- Continuously Educate Yourself: Stay updated on new tools and techniques for identifying imbalances in the ever-evolving forex market.
Conclusion
Mastering the art of identifying imbalance in forex can significantly enhance your trading performance and decision-making process. By implementing the seven proven strategies outlined in this guide – analyzing order flow, utilizing volume profile, implementing market profile analysis, leveraging price action patterns, monitoring institutional order flow, employing order block analysis, and utilizing smart money concepts – traders can gain valuable insights into market inefficiencies and potential trading opportunities.
Remember that identifying imbalance in forex is both a science and an art. It requires practice, patience, and continuous learning to develop proficiency. As you incorporate these techniques into your trading routine, you’ll likely see improvements in your ability to spot high-probability setups and make more informed trading decisions.
Stay committed to honing your skills, and don’t hesitate to adapt your approach as you gain experience. With dedication and persistence, you can turn the concept of forex imbalance into a powerful tool in your trading arsenal, potentially leading to more consistent and profitable results in the dynamic world of forex trading.
How can I use the Relative Strength Index (RSI) to identify imbalance in forex?
The RSI can indicate potential imbalances through overbought/oversold levels, divergences with price action, and centerline crossovers. Use it in conjunction with other indicators for more reliable signals.
What role do gap fills play in identifying imbalance in forex markets?
Gaps often represent market imbalances. Analyzing how quickly gaps are filled, whether they’re filled partially or fully, and the market’s behavior around gaps can provide insights into potential imbalances and trading opportunities.
How can I use the concept of “fair value” to identify imbalance in forex trading?
Fair value represents a balanced price level. Significant deviations from fair value (determined through methods like moving averages or statistical models) may indicate potential imbalances. Combine this with other analysis techniques for more robust imbalance identification.


