

Keltner Channels are a volatility-based technical indicator composed of three lines that help traders identify trends, potential reversals, and overbought or oversold conditions. Unlike other channel indicators, they use the Average True Range (ATR) to set the channel distance from a central Exponential Moving Average (EMA), providing a smoother and more responsive view of market volatility. Whether you are trading with a leading online forex broker or analyzing stocks, this tool is indispensable. This guide covers everything from the core formula of the Keltner Channels to advanced, actionable strategies for today’s dynamic markets.

Key Takeaways
- Volatility Gauge: Keltner Channels expand during high volatility and contract during low volatility, signaling potential breakouts.
- Core Formula: They are built using an Exponential Moving Average (EMA) for the middle line and the Average True Range (ATR) to plot the upper and lower bands.
- Trend Identification: Prices consistently “walking” along the upper or lower band signal a strong, sustained trend.
- Mean Reversion: In ranging markets, price movement towards the outer bands can signal an opportunity to trade back towards the middle EMA line.
- Versatile Application: The keltner channels indicator is effective across various markets, including forex, stocks, commodities, and cryptocurrencies, due to its adaptive nature.
Keltner Channels: Proven Volatility Indicator
For decades, traders have sought tools to cut through market noise and reveal underlying structure. The Keltner Channel, developed by Chester W. Keltner in the 1960s and later refined by Linda Bradford Raschke, has stood the test of time. It is a powerful envelope-based tool that provides an objective framework for market volatility and trend direction, making it a cornerstone of many successful trading systems.
What Are Keltner Channels?
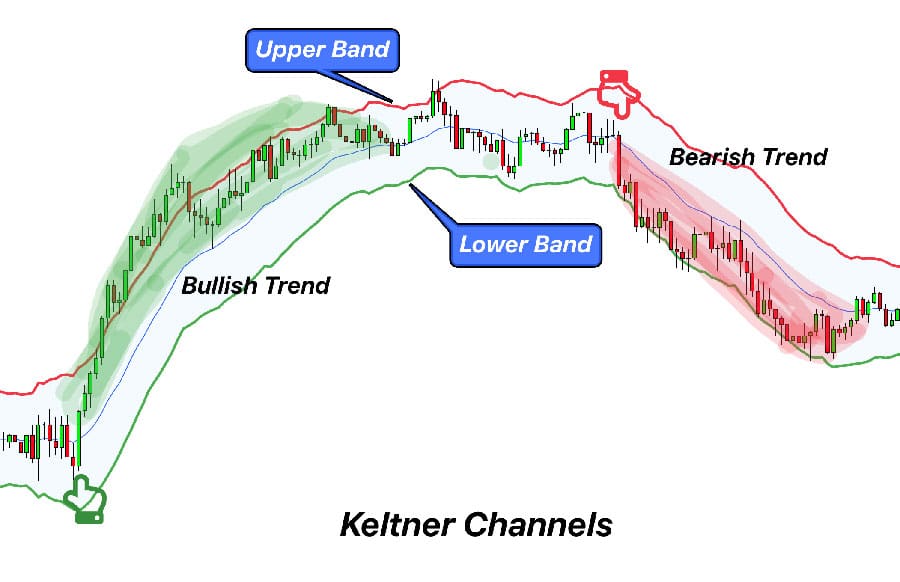
At their core, Keltner Channels are a set of three bands plotted over a price chart. The middle band is typically a 20-period Exponential Moving Average (EMA), which reflects the medium-term trend. The upper and lower bands are placed at a calculated distance from this middle line. This distance is determined by the Average True Range (ATR), a pure measure of volatility. When price action is volatile, the bands widen. When the market is quiet, they contract. This dynamic nature is what makes the keltner channels indicator so insightful for traders aiming to understand current market sentiment.
Why Traders Rely on This Indicator
Traders favor Keltner Channels for several key reasons. First, they provide a clear, visual representation of both trend and volatility simultaneously. You can instantly see if a market is trending strongly, consolidating, or becoming excessively volatile. Second, their reliance on ATR makes them less susceptible to whipsaws compared to standard deviation-based indicators, offering a smoother and often more reliable signal. This reliability makes them a go-to for developing a robust keltner channel strategy that can adapt to changing market phases. From my experience, the clarity they offer reduces hesitation and promotes more disciplined trade execution.
Keltner Channels vs. Bollinger Bands
A frequent point of confusion for new traders is the difference between Keltner Channels and Bollinger Bands. While both are envelope indicators, their calculation and behavior differ significantly.
- Middle Line: Bollinger Bands use a Simple Moving Average (SMA), which gives equal weight to all data points. Keltner Channels use an Exponential Moving Average (EMA), which gives more weight to recent prices, making it more responsive.
- Band Calculation: This is the most critical difference. Bollinger Bands use standard deviation to set their band width. Standard deviation measures how dispersed prices are from the average. Keltner Channels use the Average True Range (ATR), which measures market volatility based on the high-low range of recent periods.
- Resulting Behavior: Because ATR is generally less volatile than standard deviation, Keltner Channels tend to be smoother and more uniform in width. Bollinger Bands can expand and contract dramatically and suddenly. Many traders, myself included, find the smoothness of Keltner Channels more conducive to trend-following systems, while Bollinger Bands are often preferred for identifying extreme price “squeezes.”
Read More: Keltner Channels vs Bollinger Bands
Keltner Channels Indicator Structure & Formula
Understanding the mechanics behind the keltner channels indicator is crucial for customizing it to your trading style and the asset you are trading. Unlike a “black box” system, its logic is transparent and based on two of the most respected concepts in technical analysis: moving averages and true range. This transparency allows for intelligent adaptation rather than blind application.
How Keltner Channels Are Calculated
The calculation involves three distinct components, which come together to form the visual channel on your chart. The standard settings are a 20-period EMA and a 2x ATR multiplier, but these can be adjusted.
- Middle Line: This is an Exponential Moving Average (EMA) of the price. The typical period used is 20.
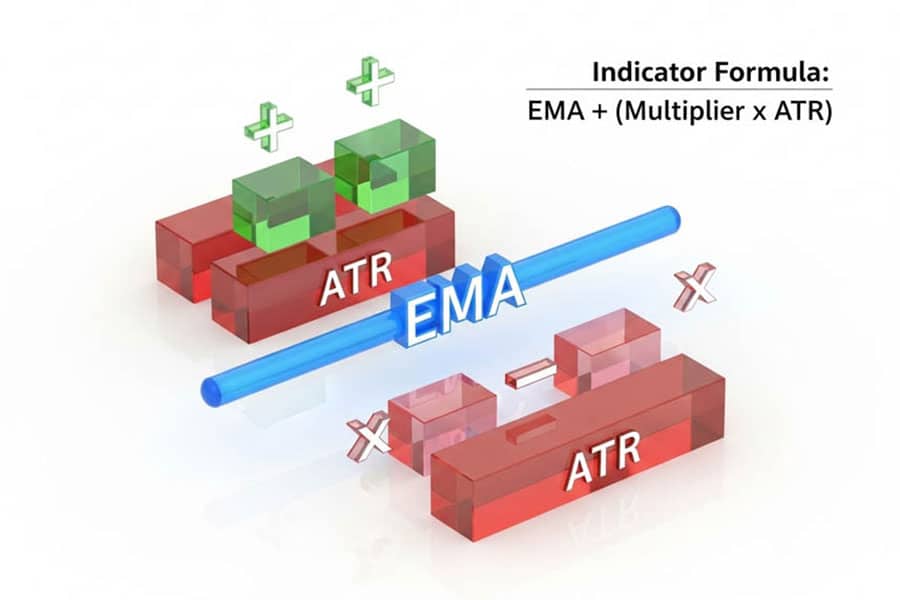
Middle Line = EMA(Price, Period) - Upper Band: This is calculated by taking the Middle Line and adding a multiple of the Average True Range (ATR).
Upper Band = EMA(Price, Period) + (Multiplier × ATR(Period)) - Lower Band: This is calculated by taking the Middle Line and subtracting the same multiple of the ATR.
Lower Band = EMA(Price, Period) - (Multiplier × ATR(Period))
The ‘Multiplier’ is a key variable. A smaller multiplier (e.g., 1.5) creates a tighter channel, resulting in more frequent price touches. A larger multiplier (e.g., 2.5 or 3.0) creates a wider channel, indicating that a price touch is a more significant, overextended event.
Visualizing Keltner Channel Bands
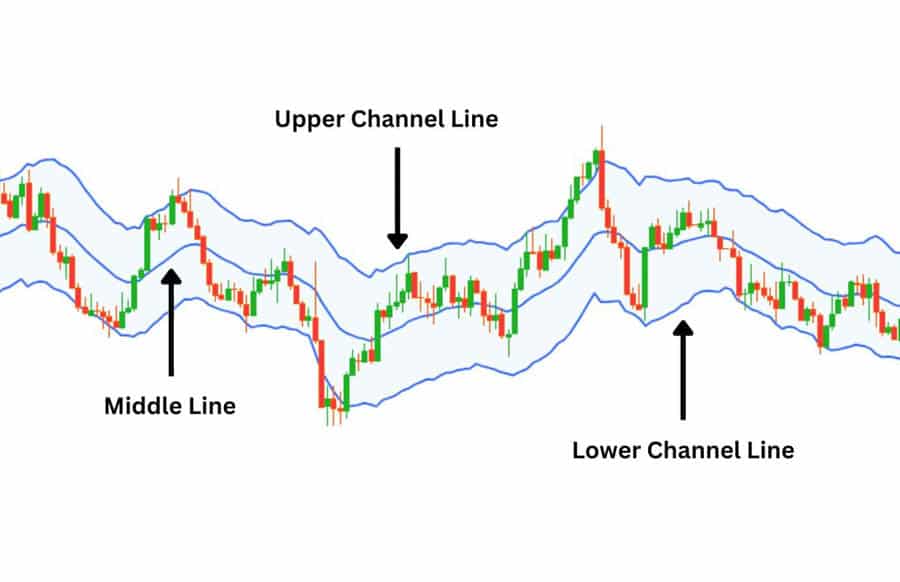
On a trading chart, the three lines of the Keltner Channels create a dynamic river around the price. When the river is wide and flowing upwards or downwards, it signifies a strong, volatile trend. When it narrows and flattens, it indicates a period of consolidation and low volatility, often a precursor to a significant price move. Price action contained within the bands is considered normal. A decisive close outside the bands is an event that demands a trader’s attention, as it signals a potential breakout or a climax condition.
Key Settings for Different Styles
There are no “magic” settings that work for everyone. The optimal parameters for your Keltner channel trading depend on your timeframe and strategy. Here are some widely used starting points based on different trading styles:
- Day Trading / Scalping (e.g., 5-min, 15-min charts): A faster EMA and a tighter multiplier are often preferred. A common setup is a 10-period EMA with a 1.5x ATR multiplier. This makes the indicator highly sensitive to short-term momentum and volatility shifts.
- Swing Trading (e.g., 1-hour, 4-hour charts): The standard settings of a 20-period EMA and a 2.0x ATR multiplier are very popular here. This provides a balanced view of the medium-term trend and is excellent for capturing multi-day moves.
- Position Trading (e.g., Daily, Weekly charts): Long-term traders often use a slower EMA to capture the primary trend and a wider multiplier to filter out market noise. A setup like a 50-period EMA with a 2.5x or 3.0x ATR multiplier can be effective for identifying major trend shifts.
Read More: Keltner Channel vs Donchian
How Does Keltner Channel Strategy Work?
A successful keltner channel strategy is not about a single signal but about interpreting the language of the indicator. The channels tell a story about the market’s ongoing battle between buyers and sellers, its energy (volatility), and its overall direction. By learning to read these cues, a trader can develop a flexible approach that works in various market conditions.
Channel Expansion and Contraction
The width of the Keltner Channel is a direct barometer of market volatility.
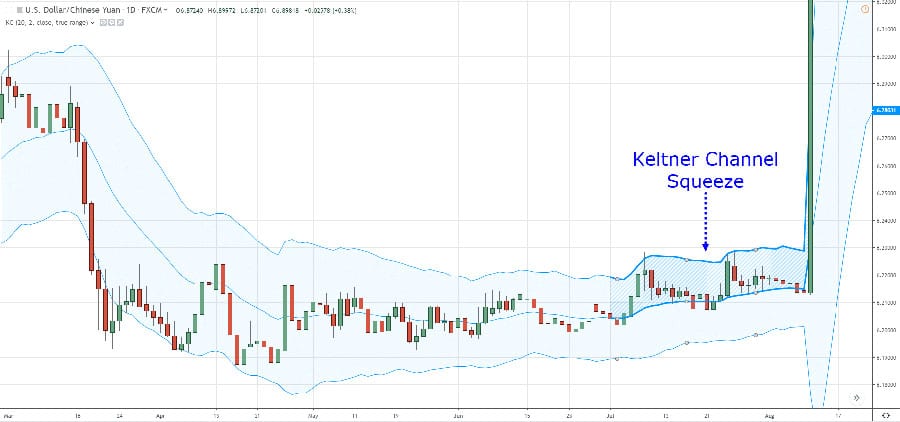
- Contraction (The Squeeze): When the bands narrow and move closer together, it signifies that volatility is drying up. The market is consolidating and building energy. Experienced traders watch these periods closely, as they often precede an explosive breakout. A quiet market rarely stays quiet for long.
- Expansion: When the bands begin to widen dramatically, it confirms that volatility is increasing and a new move is underway. This expansion often accompanies a strong breakout from a consolidation phase and validates the start of a new trend.
Identifying Trends with the Indicator
Keltner Channels are exceptionally good at identifying and confirming trends. The angle of the entire channel provides the most obvious clue. An upward-sloping channel indicates an uptrend, while a downward-sloping channel signals a downtrend. A flat, horizontal channel points to a ranging market.
A more nuanced technique is watching how price interacts with the bands. In a strong uptrend, price will often “walk the band,” consistently touching or riding along the upper Keltner band. Pullbacks may only reach the middle EMA line before resuming the upward move. Conversely, in a strong downtrend, the price will hug the lower band. When you see this behavior, it’s a powerful confirmation to trade with the trend, not against it.
Understanding Mean Reversion
While powerful for trends, the indicator is also useful in range-bound markets. The concept of mean reversion suggests that prices, after reaching an extreme, tend to revert to their average. In the context of a sideways market (where the channel is flat), the outer bands can act as dynamic support and resistance. A move to the upper band may present a short-selling opportunity with the expectation that the price will return to the middle EMA. A touch of the lower band could be a buying opportunity for a move back to the mean. This approach is central to many short-term Keltner channel trading systems.
Adapting the Indicator to Any Market
One of the greatest strengths of the Keltner Channels is their universal applicability. Because the band width is based on ATR, the indicator automatically adapts to the unique volatility profile of any asset. A highly volatile instrument like Bitcoin will naturally have much wider channels than a stable blue-chip stock or a major forex pair like EUR/USD. This self-adjusting nature means you don’t have to radically change your interpretation method when switching between markets, making it a truly versatile tool in a trader’s arsenal.
Advanced Keltner Channel Strategies
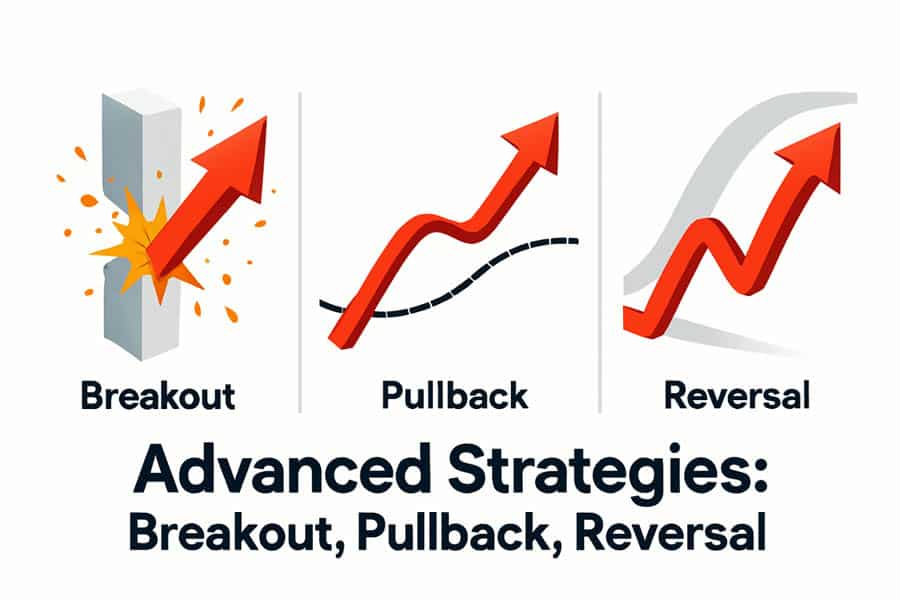
Once you’ve mastered the basics, you can begin to integrate Keltner Channels into more sophisticated, experience-based strategies. These advanced methods often involve combining the indicator with other tools and using multi-timeframe analysis to increase precision and filter out lower-probability setups. These are the kinds of strategies that, through backtesting and live application, have proven their worth over time.
Breakout Trading: Entry/Exit Tactics
The classic breakout strategy is a cornerstone of Keltner channel trading. The setup begins by identifying a “squeeze” where the channel contracts, indicating low volatility. The entry trigger is a strong candle that closes decisively outside either the upper or lower band.
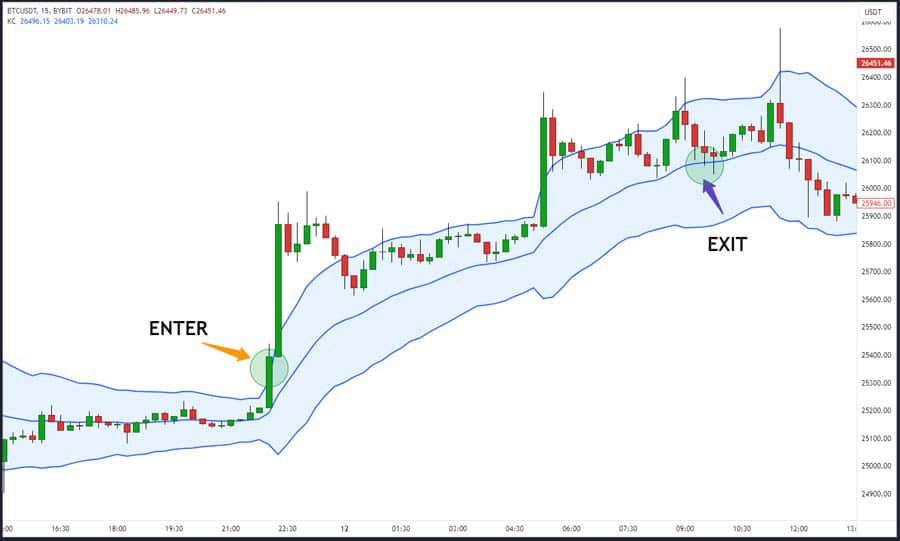
- Entry: For a long position, wait for a candle to close above the upper Keltner band. For a short, wait for a close below the lower band. A “pro tip” is to ensure the breakout candle has significant volume to confirm conviction behind the move.
- Exit (Stop-Loss): A common stop-loss placement is just on the other side of the middle EMA line. A more dynamic approach is to place the stop at a distance of 1x or 1.5x ATR below your entry point for a long trade (or above for a short).
- Exit (Take-Profit): Profit targets can be set at a fixed risk-to-reward ratio (e.g., 2:1) or by using a trailing stop that follows the middle EMA line, allowing you to ride the trend as long as it lasts.
Read More: How to Use Bollinger Bands in Forex Trading
Pullback & Trend-Following Approaches
Breakouts can be difficult to catch and are prone to failure. A more consistent keltner channel strategy for many traders is trend-following via pullbacks. This method involves waiting for an established trend and entering on a dip.
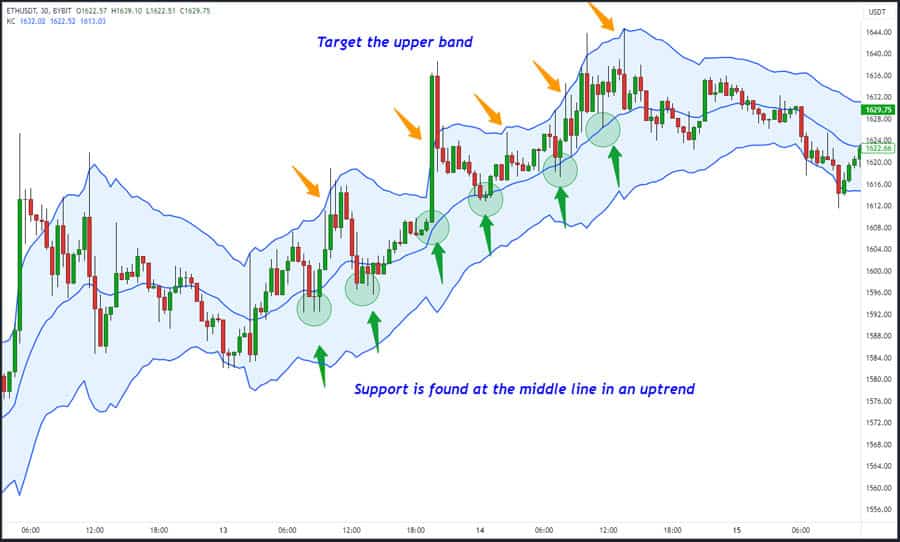
- Identify the Trend: First, confirm a strong trend is in place (e.g., price is walking the upper band and the channel is angled up).
- Wait for a Pullback: Do not chase the price. Wait patiently for the price to pull back towards the middle EMA line. This area often acts as a dynamic support zone in an uptrend (or resistance in a downtrend).
- Entry Signal: The entry is triggered when a bullish candlestick pattern (like a hammer or engulfing bar) forms at or near the EMA, signaling that buyers are stepping back in.
- Filter: This strategy works best when the primary trend is strong. Using an indicator like the ADX can help confirm trend strength. A reading above 25 often indicates a trend strong enough for this strategy to be effective.
Reversal Setups and Filtering False Signals
Detecting reversals requires more than just a price touch of an outer band. A high-probability reversal setup often involves a failure test and divergence.
- The “Two-Touch” Failure: A common reversal pattern is when the price pushes outside the upper band, pulls back inside, and then attempts a second push that fails to make a new high before falling back inside the channel. This “failure to continue” is a strong sign of exhaustion.
- Filtering with Divergence: Combining Keltner Channels with an oscillator like the RSI (Relative Strength Index) is extremely powerful. Look for bearish divergence: price makes a new high outside the upper band, but the RSI makes a lower high. This indicates that the momentum behind the move is fading and a reversal is likely. This is one of the most reliable ways I’ve found to filter out false breakout signals.
Combining Keltner Channels With Other Tools
The keltner channels indicator shines brightest when used as part of a confluence-based system.
- RSI: As mentioned, use RSI for overbought/oversold confirmation and divergence signals. A close above the upper Keltner band is more significant if the RSI is also overbought (>70).
- Volume: Volume confirms the strength of a move. A breakout on high volume is far more reliable than one on low volume. During a pullback to the EMA, an increase in volume as price bounces off the line adds conviction to the entry.
- ADX (Average Directional Index): The ADX measures trend strength, not direction. Use it to decide which strategy to apply. If ADX is high (>25), use trend-following strategies. If ADX is low (<20), the market is ranging, and mean-reversion strategies are more appropriate.
Multi-Timeframe Analysis for Precision
Professional traders rarely make decisions based on a single timeframe. Using a multi-timeframe approach with Keltner Channels can dramatically improve entry precision.
- Higher Timeframe (e.g., Daily): Use this to establish the primary trend and bias. Is the daily channel pointing up, down, or flat? This is your strategic map.
- Lower Timeframe (e.g., 4-Hour or 1-Hour): Use this for tactical entries. If the daily trend is up, wait for a pullback to the middle EMA on the 4-hour chart to find your entry point. This ensures you are trading with the dominant market flow, significantly increasing your probability of success.
Real-World Settings & Backtesting Insights
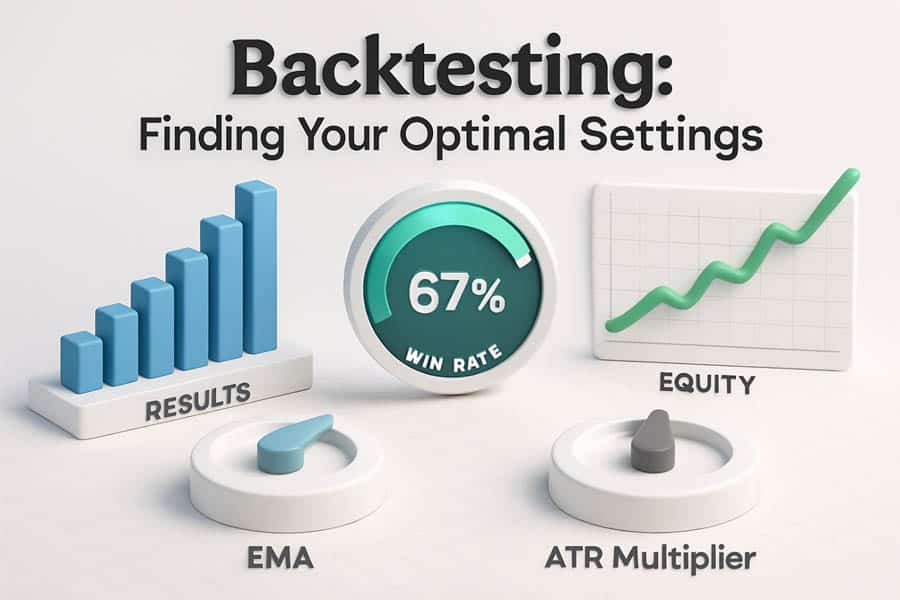
Theory is one thing, but successful trading comes from practical application, testing, and adaptation. The default settings of the Keltner Channel are a great starting point, but optimizing them for specific assets and market conditions can provide a significant edge. This process requires a disciplined approach to backtesting and a willingness to adjust as the market evolves.
Choosing Optimal EMA/ATR Settings
The “optimal” settings depend entirely on the asset’s personality and your strategy’s goal. For instance, a volatile asset like a meme stock or a cryptocurrency might frequently breach a 2.0x ATR multiplier, giving false signals. For such assets, widening the multiplier to 2.5x or even 3.0x can help filter out noise and identify only the most significant overextensions. Conversely, for a stable, slow-moving forex pair, a tighter multiplier of 1.5x might be necessary to generate enough signals. The key is to visually inspect the chart and backtest: choose settings that contain the majority of price action but are still touched during meaningful extensions.
Backtesting: What Actually Works?
Backtesting is non-negotiable for any serious trader. Based on extensive testing of various keltner channel strategy variations, a few patterns emerge:
- Pullbacks to the 20 EMA: This is arguably the most robust strategy across multiple markets. A system that enters on a pullback to the 20 EMA in a strongly trending market (confirmed by ADX or a higher timeframe) consistently shows positive expectancy. On major forex pairs using the H4 chart, a strategy with a 20 EMA / 2.0 ATR setting, targeting a 1.5:1 risk-to-reward, has historically yielded win rates in the 50-60% range.
- Breakouts After a Squeeze: While having a slightly lower win rate (often 40-50%), the winning trades can be significantly larger. The key is to be highly selective. Backtests show that breakouts are most profitable when they follow a prolonged period of channel contraction and are accompanied by a spike in volume.
Sharing specific win rates is illustrative, but it’s vital you conduct your own tests on your chosen asset and timeframe, as past performance is not a guarantee of future results.
Adapting Parameters to Volatility
Markets are not static; they cycle between high and low volatility. A smart trader adapts their tools accordingly. For example, in the lead-up to a major economic news release like Non-Farm Payrolls, volatility is expected to spike. In this scenario, it can be prudent to temporarily widen your ATR multiplier or avoid trading altogether until the channels stabilize. Conversely, during quiet summer trading months, you might tighten your parameters to better capture the smaller price swings of a low-volatility environment. This dynamic adaptation is a hallmark of professional Keltner channel trading.
Dynamic Position Sizing & Stop-Losses
The ATR component of Keltner Channels provides a perfect tool for dynamic risk management. Instead of using a fixed pip or dollar amount for your stop-loss, you can base it on the current market volatility.
- ATR-Based Stop-Loss: After entering a long trade, you could place your stop-loss at a distance of 2x the current ATR value below your entry price. This means your stop is wider in volatile markets and tighter in quiet markets, which is logical.
- ATR-Based Position Sizing: You can also use ATR to normalize your position size. Decide on a fixed dollar amount you are willing to risk per trade (e.g., $100). Divide this amount by your stop-loss distance (e.g., 2x ATR) to calculate your position size. This ensures you are risking the same percentage of your account on every trade, regardless of the asset’s volatility.
Avoiding Common Keltner Channel Mistakes
Like any technical indicator, Keltner Channels are not infallible. Understanding their limitations and the common traps traders fall into is just as important as knowing the strategies. Awareness of these pitfalls can save you from costly errors and help you maintain confidence in your system.
When the Indicator Gives False Signals
The most common source of false signals from Keltner Channels occurs in choppy, directionless markets. In such conditions, the price can whip back and forth, frequently touching the outer bands without initiating a sustained move. This can lead to a series of small losses from failed breakout or mean-reversion trades. The best defense is to use a filter, like the ADX, to identify these non-trending periods. If the ADX is low and drifting, it’s often better to stay on the sidelines and wait for clarity.
Strategies for Low-Volatility Markets
A common mistake is trying to force a trend-following strategy in a low-volatility, sideways market. When the channels are flat and narrow, breakouts are unreliable. The better approach is to switch your mindset to a range-trading or mean-reversion strategy. Look for overextensions to the bands as potential fading opportunities, with the middle EMA as your target. Alternatively, the most patient approach is to simply wait. A prolonged period of low volatility (a “squeeze”) is a setup in itself, signaling that a powerful move is likely on the horizon.
Over-Optimization: The Silent Killer
In the quest for the “perfect” system, it’s easy to fall into the trap of over-optimization, also known as curve-fitting. This happens when you tweak the indicator’s settings (EMA period, ATR multiplier) until they produce flawless results on historical data. The problem is that these “perfect” settings are tailored to past noise, not the underlying market logic. When applied to live market conditions, they almost always fail. The solution is to use robust, industry-standard settings (like 20, 2.0) as your baseline and only make small, logical adjustments. Your goal is a strategy that is robust and generally effective, not one that is perfectly fitted to the past.
Practical Implementation and Pro Tips
Moving from theory to practice requires setting up the indicator on your platform and building a structured plan. Here we’ll cover the practical steps for implementation and share some final tips that can help refine your use of the Keltner Channels indicator.
Setup on TradingView, MT4/MT5
Adding the keltner channels indicator to most modern trading platforms is straightforward.
- TradingView: Click on the “Indicators” button at the top of your chart. In the search box, type “Keltner Channels” and select it from the list. You can then click the gear icon next to the indicator’s name on your chart to adjust the settings (EMA Length, ATR Length, Multiplier).
- MetaTrader 4/5 (MT4/MT5): Keltner Channels are not included by default in MT4/5, but thousands of free and paid versions are available on the MQL5 marketplace. Download a popular version, place it in your “Indicators” folder, restart MT4/5, and then find it in the “Custom” section of your Navigator window to drag it onto a chart.
Building a Strategy From Scratch
Let’s build a simple, rule-based pullback strategy for swing trading EUR/USD on the 4-hour chart.
- Rule 1 (Trend Filter): Use a 200-period SMA on the chart. Only take long trades if the price is above the 200 SMA and only short trades if it is below.
- Rule 2 (Setup): Add Keltner Channels with standard settings (20, 2.0). The trend must be established, with the channel clearly angled up (for longs) or down (for shorts).
- Rule 3 (Entry): Wait for the price to pull back and touch the middle 20 EMA. Enter a long position on the close of the first bullish candle that forms after touching the EMA.
- Rule 4 (Stop-Loss): Place the initial stop-loss just below the lower Keltner band.
- Rule 5 (Take-Profit): Set a primary profit target when the price touches the upper Keltner band. Consider leaving a portion of the position on with a trailing stop at the middle EMA to capture a longer run.
This step-by-step plan removes emotion and discretion, leading to more consistent execution.
Real Case Studies: Pro Trader Use
Many professional traders use Keltner Channels in nuanced ways. For example, some futures traders use them not for entries, but as a dynamic “area of value.” They view the space between the middle EMA and the upper band (in an uptrend) as the “buy zone.” They will look for other confirming signals within this zone to time their entries. Another common professional use is for scaling out of winning trades. As a trend extends and becomes parabolic, a trader might take partial profits as the price hits 2x ATR, more at 3x ATR, and so on, banking profits as the move becomes statistically overextended.
Trade with an Edge at Opofinance
Enhance your Keltner channel trading with a broker built for modern markets. Opofinance, regulated by ASIC, offers a comprehensive trading environment designed to empower your strategy.
- Advanced Trading Platforms: Choose from MT4, MT5, cTrader, and the proprietary OpoTrade platform.
- Innovative AI Tools: Leverage the AI Market Analyzer, AI Coach, and instant AI Support to find and execute better trades.
- Flexible Trading Options: Explore Social Trading to follow experts and Prop Trading to get funded.
- Secure & Convenient Transactions: Enjoy safe and fast deposits and withdrawals, including crypto payments with zero fees.
Discover a smarter way to trade. Get Started with Opofinance Today!
Summary: A Core Trading Tool
Keltner Channels have remained a favorite tool for technical traders for good reason. Their elegant design, which combines trend and volatility into a single, intuitive visual, makes them incredibly versatile. Whether used for identifying breakouts, trading pullbacks, or pinpointing reversals, the channels provide an objective framework for decision-making. By understanding their calculation, mastering a few core strategies, and integrating them with other analytical tools, you can make the Keltner Channels a reliable and indispensable part of your trading process.
What is the best timeframe for Keltner Channels?
There is no single “best” timeframe. It depends on your trading style. Swing traders often find success on the 4-hour and daily charts, while scalpers may use the 5-minute or 15-minute charts. The key is to match the indicator’s settings to your chosen timeframe.
Are Keltner Channels better than Bollinger Bands for beginners?
Many traders find Keltner Channels slightly more intuitive for beginners because their smoother, ATR-based bands make trend-following easier to visualize. Bollinger Bands’ sharp expansions and contractions can be harder to interpret initially.
Can Keltner Channels predict market crashes?
No indicator can predict a crash with certainty. However, Keltner Channels can signal conditions that often precede sharp declines, such as an extreme, parabolic price spike far outside the upper band followed by a sharp reversal and break below the lower band.
How do you use Keltner Channels with price action?
Combine them by watching for specific price action signals at key channel levels. For example, look for a bullish engulfing candle or a pin bar forming at the middle EMA during a pullback in an uptrend. This confluence provides a much stronger signal.
Is the Keltner Channel a leading or lagging indicator?
It is primarily a lagging indicator because its calculations are based on past price data (the EMA and ATR). However, its predictive value comes from interpreting its signals, such as a channel squeeze, which can foreshadow future volatility.


